The Brazilian standard NBR 7212 states that the time of transporting the concrete between the start of mixing should be less than 90 minutes so that by the end of the discharge is a maximum of 150 minutes. Yet often, in construction, concrete is used after this period. In order to investigate the behavior of concrete after setting time of cement was cast six concrete mixtures with two types of cement. The mixtures were produced and kept fresh for six hours, adopting a procedure for maintenance of abatement by superplasticizer and agitation. The results show that of the test piece molded over six hours of maintained or increased the compressive strength average.
Keywords: start time of catching, transportation of concrete, concrete machined
A norma brasileira NBR 7212 coloca que o tempo de transporte do concreto decorrido entre o início da mistura deve ser inferior a 90 minutos de maneira que até o im da descarga seja de no máximo 150 minutos. No entanto muitas vezes, em obra, o concreto é utilizado após este período. Com intuito de investigar o comportamento do concreto após o tempo de pega do cimento foram moldados seis traços de concreto com dois tipos de cimento. As misturas foram produzidas e mantidas no estado fresco por seis horas, adotando-se um procedimento de manutenção do abatimento através de aditivo superplastiicante e agitação. Os resultados mostram que os corpos-de-prova moldados ao longo das seis horas mantiveram ou aumentaram a resistência à compressão média.
Palavras-chave: tempo de início de pega; transporte de concreto; concreto usinado.
Time for concrete casting: a new paradigm
Tempo de lançamento do concreto: um novo paradigma
A. B. ROHDEN a [email protected]
D. C. C. DAL MOLIN b [email protected]
G. L. VIEIRA c [email protected]
a Universidade Federal do Rio Grande do Sul, Departamento de Engenharia Civil, Escola de Engenharia, Núcleo Orientado para Inovação
da Ediicação, [email protected], Rua Osvaldo Aranha, 99 - Centro, Porto Alegre, Brasil;
b Universidade Federal do Rio Grande do Sul, Departamento de Engenharia Civil, Escola de Engenharia, Núcleo Orientado para Inovação
da Ediicação, [email protected], Rua Osvaldo Aranha, 99 - Centro, Porto Alegre, Brasil.
c Universidade Federal do Espirito Santo, Departamento de Engenharia Civil , Centro Tecnológico, [email protected],
Av. Fernando Ferrari, 514 – Vitória, Espírito Santo, Brasil.
Received: 17 Jul 2011 • Accepted: 04 Jun 2012 • Available Online: 05 Dec 2012
Abstract
1. Introduction
The transportation time of concrete from the irst addition of water until the beginning of its discharge at the construction site must be, according to NBR 7212:
a) ixed, so that the end of compacting does not occur after the ini -tial setting of the cast concrete and the layers or parts adjacent to this batch;
b) under 90 min and ixed, so that by the end of the discharge no more than 150 minutes have elapsed, in case of using a vehicle equipped with an agitator;
c) under 40 min and ixed, so that by the end of the discharge no more than 60 minutes have elapsed, in case of using a vehicle without an agitator.
The transportation of pre-mixed concrete to the construction site must be undertaken as fast as possible in order to minimize the effects of stiffening and loss of workability, and to allow appropri-ate setting and inishing after casting. Under normal conditions, there is generally negligible slump loss during the irst 30 minutes after the initial hydration of Portland cement. When the concrete is agitated at low speed or when it is periodically remixed, there may occur some slump loss with time, which does not generally cause any serious problems for the casting and setting of fresh concrete in the irst 90 minutes (Mehta and Monteiro, 2008).If that time interval is exceeded, it is still possible to add plasticizers and/ or superplasticizer to recover the concrete’s slump for subsequent casting and setting, as slump correction with water causes signii -cant damage to the mechanical properties.
The workability of concrete is the property that determines the ef-fort required to manipulate a speciic amount of fresh concrete, with minimal loss of homogeneity. The term manipulate includeeesarly stage operations, such as casting, setting and inishing (Mehta and Monteiro, 2008).
The change from the luid to the rigid state is, in general terms, deined as setting (NEVILLE, 1995). Setting is the term used to designate the stiffening of the cement paste, even though the dei -nition of stiffening of the paste is arbitrary. According to MEHTA
and MONTEIRO (1994), what causes the stiffening of the paste and, inally, its setting and hardening is the gradual loss of free wa -ter due to hydration reactions, physical adsorption on the surface of the hydration products with poor crystallinety (such as C-S-H and ettringite) and evaporation. The beginning of the setting marks the moment when the paste becomes unworkable. Consequently, the casting, compacting and inishing of the concrete become dif -icult after this stage.
The paste does not solidify suddenly, it needs considerable time to become totally rigid. The time necessary for the paste to totally solidify marks the end of the setting, which should not be long, so that other constructive activities can be resumed as soon as pos-sible after the concrete casting (MEHTA and MONTEIRO, 2008). The terms initial set and inal set are used to arbitrarily describe speciic states of the setting. Although in the interval between the initial and the inal set, the paste acquires a certain resistance, from a practical point of view, the development of the paste’s resis-tance is considered after the end of the setting, when the harden-ing starts (NEVILLE, 1995).
The standard test to determine setting times is the needle pen-etration test. It is done almost universally by using the Vicat ap-paratus. In Brazil, the testing method is prescribed by the NBR NM 65 (2002). The initial set time is designated as the time elapsed between the moment water is added to the cement and the mo-ment when the Vicat needle, with standard diameter and mass, penetrates the standard consistency paste and stops 1 mm from the bottom of a particular mold. Therefore, for each cement, it is necessary to determine the water content of the paste that pro-duces the standard slump (NBR NM 67, 1998). The inal set time is deined as the time interval between the pouring of water into the cement and the irst of three successive readings equal or higher than 38 mm, done in the normal consistency paste, using a Vicat needle (SILVA, 2007).
Speciication norms establish the acceptable limits for each Port -land cement designation. NBR 5733 – CPV, NBR 5735 – CPIII, NBR 5736 – CPIV and NBR 11578 – CPII establish that the initial set time should be equal to or over1 hour.
The reactions between cement and water are the basic
sequent stage, they start forming amass, continuous subgroups of mechanically connected grains. The appearance of the irst con -tinuous path going through the group constitutes the percolation threshold, which is the irst continuous path of grains mechanically connected, joining one face of the volume to the opposing face (Figure1) (SILVA, 2007).
When the setting time has ended and the hydration process and formation of the irst amass start, the remix of the concrete neces -sarily includes the breaking of the irst crystals derived from the hydration process. Would this fact damage the mechanical proper-ties? Could this material be used with a structural function? Vieira (2008) investigated the influence that micro fissures caused by early loading have on the mechanical properties of concrete. Microscopy tests detected the recovery of micro fis -sures verified in samples of concrete produced with CPV ARI and submitted to pre-loads of 75% of their breaking load, at 7 days. The recovery of the micro fissures corroborates the the-ory that there occurs autogenous healing, cracking of weaker crystalsand hydration of remaining resistant compounds, pro-posed by that study.
causes of concrete setting, even though, for several reasons, the setting time of the concrete does not coincide with the setting time of the cement used in the concrete. The phenom-ena of stiffening, setting and hardening are physical manifes-tations of the progressive hydration reactions of the cement (SILVA, 2007).
In practical terms, the initial set time gives an idea of the time avail-able to manipulate the concrete made with particular cement. How -ever, the result is not very precise, since the test is done under standardized conditions, while on the ield, the concrete suffers the inluence of uncontrolled factors, such as temperature and relative air humidity, as well as the addition of chemical additives, which can alter the set time (SILVA, 2007).
The percolation theory by ACKER (1988) apud SILVA (2007) al -lows the simulation of cement hydration and a description of the setting phenomenon. The solid grains of cement, isolated in the suspension phase, start to come into contact with each other as hydration products start forming around those grains. The estab-lishment of these mechanical links between the grains occurs in a random and discontinuous manner in the volume, and at the
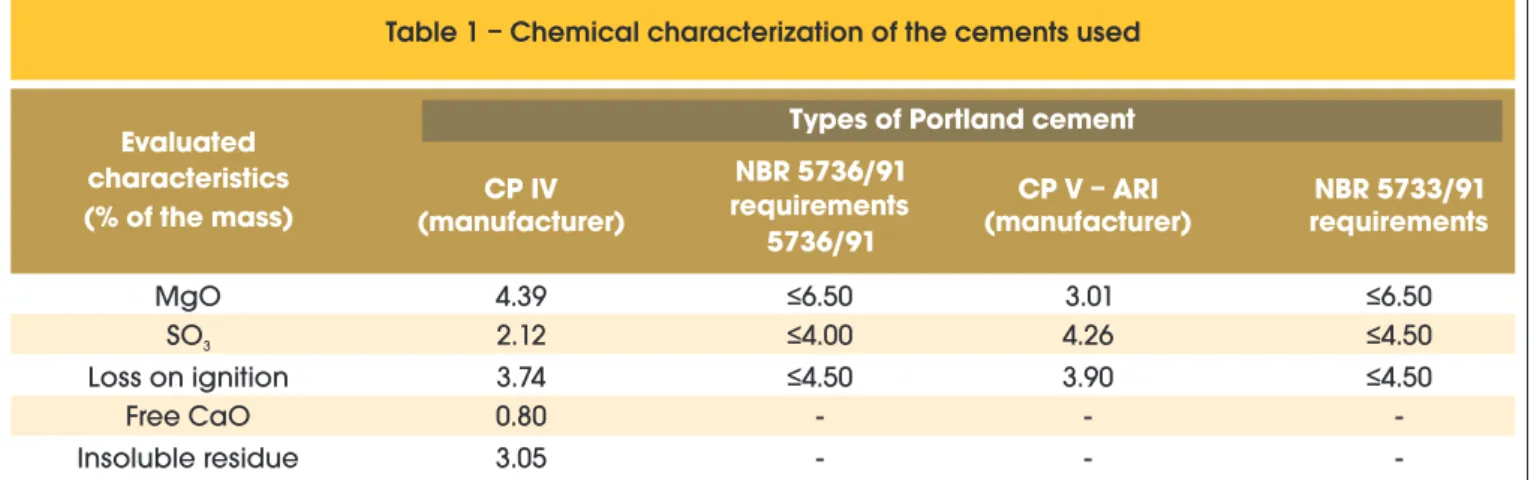
sub-Table 1 – Chemical characterization of the cements used
Evaluated
characteristics
(% of the mass)
Types of Portland cement
CP IV
(manufacturer)
NBR 5736/91
requirements
5736/91
CP V – ARI
(manufacturer)
requirements
NBR 5733/91
MgO
4.39
≤6.50
3.01
≤6.50
SO
32.12
≤4.00
4.26
≤4.50
Loss on ignition
3.74
≤4.50
3.90
≤4.50
Free CaO
0.80
-
-
-
Insoluble residue
3.05
-
-
-
Table 2 – Physical characterization of the cements used
Characteristics
evaluated
Types of Portland cement
CP IV
(manufacturer)
NBR 5736/91
requirements
CP V – ARI
(manufacturer)
NBR 5733/91
requirements
2.80
-
3.05
-
0.0
≤5.0
0.0
≤5.0
04:12
≥01:00
02:55
≥01:00
05:21
≤12:00
04:35
≤10:00
34.9
-
-
-
4306
-
4970
≥3000
1.1
≤8.0
0.16
≤6.0
3
Specific mass (cm /g)
Heat expansion (mm)
Set time (h:mm)
Initial
Final
Normal slump (%)
2
Blaine fineness (cm /g)
Sieve residue #3250mm (%)
Sieve residue #200mm (%)
ciic mass of 2.90 g/cm³, as determined by NBR NM 53 (2003), maximum dimension equal to 25 mm and shape index equal to 2.66,as determined by NBR NM 248 (2003)and NBR 7809 (1983), respectively.
2.1.4 Water
The water used was potable water, available in the water supply network of the city of Porto Alegre, RS.
2.1.5 Superplasticizer
In order to maintain workability through time, a third generation polycarboxylate additive with speciic mass of 1.087 g/cm³ and 40 % solids content was used.
2.2 Methodology
Four independent variables (factors) were used. They are: type of cement, cracking age, unit mix proportion, compacting time. An experimental dosage was used with the natural aggregates, us-ing the IPT/EPUSP (HELENE and TERZIAN, 1992) method. First, the mortar content of the concrete mix proportion was set at 53%. Based on the mortar content, three concrete mixes were made at the proportions of 1:2.5, 1:4 e 1:5.5 (cement: aggregates) for each cement, i.e., six mix proportions. The mix proportions were made using a 120 ± 20 mm slump as standard. Initially, the mixes were made without additives, hence the slump was adjusted by adding water. The mixtures and the water/cement ratios necessary to at-tain the slump are presented in table 3.
The concrete was mixed in a tumble mixer truck, with capacity for 250 L. Each mix was executed only once, with the volume of mate -rial determined proportionally for100 kg of coarse aggregate. The volume of dry material was maintained constant in all the mixes. The materials were added to the mixer in the following order: coarse aggregate, approximately 1/3 of the water in the recipe, cement, second third of the water, sand, and the water necessary to achieve a 120 ± 20 mm slump. The cement to water addition time was designated asinitial time or zero. From the initial time, a standard protocol was adopted:20-minute cycles, where the mixer does not rotate/rests for 15 minutes, and then it is turned on for the 5 remaining minutes. These cycles were carried out from 20 minutes up to 360 minutes or 6 hours. During the resting periods, a humid cloth was placed over the mixer’s mouth in order to minimize the evaporation of water from the mix.
Following the rest and tumble cycles of the mixture inside the mixer at the time intervals of 120, 180, 240, 300 and 360 minutes, the
1.1 Justiication
In view of the stiffening mechanism of the cement and concrete paste and the capacity of recovery of its structure even when sub-mitted to loads already in the hardened state, this study aims to investigate the viability of using the concrete after the cement set time. Hence, this initial study sought to characterize the compres -sive strength of concrete mixed over a period of six hours. Given the importance of the slump of the mix for the processes of concrete casting and inishing, in this study, the slump was main -tained at 100±20 mm over time, by using a superplasticizer.
2. Materials and experimental program
2.1 Materials used
2.1.1 Cement
With the aim of contemplating different test situations, two types of cement with very different chemical compositions and initial resis-tance were used. One was a high initial strength Portland cement (CPV – ARI), with speciic mass of 3.10 kg/dm³, which develops high strength in its irst days. CPV – ARI has minimal addition in its composition (NBR 5733). The other cement used was pozzolanic Portland cement (CPIV), with speciic mass of 2.90 kg/dm³, with the addition of large amounts of pozzolan, developing lower initial strength (NBR 5736).
Table1 presents the chemical characterization of the cements used, the data provided by the manufacturer and the Brazilian standards’ requirements.
Table 2 presents the physical characterization of the cements used, the data provided by the manufacturer and the require-ments of the Brazilian standards. It was observed that the values of speciic mass previously cited, and which were determined in a laboratory, are, as expected, similar to those informed by the manufacturer.
2.1.2 Fine aggregate
The ine aggregate used was quartz sand, with speciic mass of 2.62 g/cm³, as determined by NBR NM 52, maximum characteristic dimension equal to 4.8 mm and ineness modulus of 2.4, according to NBR NM248.
2.1.3 Coarse aggregate
The coarse aggregate used was crushed basalt stones, with
spe-Table 3 – Composition of the mixes and water/cement ratios
Mix
proportion
Cement
Fine aggregate
Unit mix proportion
Coarse aggregate
water/cement ratio
1:2.5
1
0.86
1.65
1:4
1
1.65
2.35
1:5.5
1
2.45
3.06
procedure adopted was to determine the slump of the mix. After a checking of the slump, the procedure was to re-establish the slump so that it was equal or higher than 120 mm. This was done by incorporating a superplasticizer into the mix.
Once the intended slump was attained, for each mix produced three cylindrical test samples were cast, measuring 10 cm in di-ameter by 20 cm in height, as prescribed by NBR 5738/03 – con-crete – procedure for casting and curing test samples to carry out compressive strength tests.
In view of the characteristics of the mix, test samples were cast at zero minutes, immediately after the homogenization of the mix, and at 120, 180, 240, 300 and 360 minutes, i.e., every hour, start-ing at two hours.
After they were cast, the cylindrical test samples were covered with humid burlap bags and exposed to ambient temperature and hu-midity during 24 hours, thereafter they were demolded and taken to a tank illed with lime-saturated water, where they were sub -merged at a temperature of 23±2°C, until one day prior to the test-ing date. On that day, the test samples were coated and taken to the compression test.
The compressive strength tests were carried out as prescribed by NBR 5739 – concrete –compression test of cylindrical test sam-ples. They were executed using the servo controller machine Shi-madzu 2.000 kN at a tension application speed of 0.45 MPa/s, maintained constant throughout the test. The test samples were coated with sulphur.
3. Results and discussion
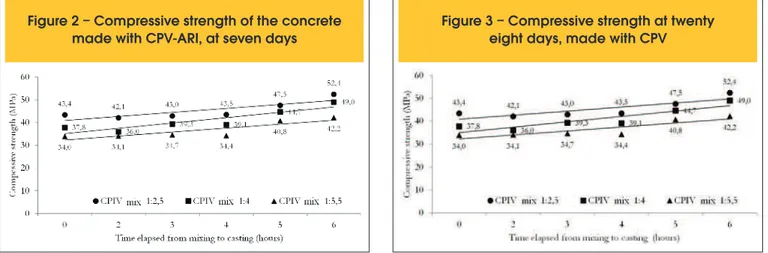
The test samples were broken at 7 and 28 days after casting. The average of the results are shown on igures 2 to 5. Figure 2 presents the average values obtained from 3 test samples, for the concretes produced with CP V ARI. In general, the average results obtained for the three mixes, at 7 days, were constant for the intermediary mix throughout the different casting times. However, for the bad mix, as well for the good mix, an increase in average resistance was veriied over time, from the mixing until the casting. This fact can be attributed to the loss of water from the mixture to the environment, which decreases the actual water/cement ratio of the mixture, thus increasing resistance. Another possible explanation is the breaking of the irst hydration products, which are larger and more fragile, and are subsequently replaced by smaller, more resistant crystals.
Figure 3 presents the average resistance of test samples pro-duced with CPV-ARI and broken 28 days after casting. Gener-ally, at this age, as shown in Figure 2, resistance increases as the time interval between mixing and casting increases. At 28 days, a signiicant increase occurs for the richer mix proportion, but the intermediary and the poorer mix also have their resis-tances increased.
Figure 4 presents the average resistance of the test samples cast with CPIV and broken 7 days after casting. For the CPIV cement, which presents a weaker resistance gain in the early ages, compared with CPV, the behaviour of the resistance, particularly for the richer mix proportion, was the maintenance of the resistance over the time elapsed until casting. However, for the poorer mix proportion the aver -ages increase as the time elapsed until casting increases.
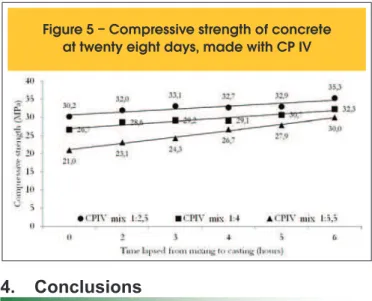
Figure 5 presents the average resistance for test samples cast with CPIV and broken at 28 days. A small increase in resistance is veri-ied through the time interval between mixing and casting. Similarly to what is observed in Figure 4, the increase in resistance for the poor mix proportion is greater than for the others.
A variance analysis (ANOVA) was made using the individual val-ues to check whether the analysed valval-ues are signiicant. Table 1 summarizes the parameters of the analysis of the experimental data collected in this study.
As expected, the variables type of cement, breaking age and mix proportion are signiicant, and their behaviour is widely consolidated in the current literature. The variable casting time, which is the time elapsed from the mixing of the materials until the casting, and which constitutes the object of this study, has also proven to be signii -cant. The behaviour observed in igures 2 to 5, however, show that compressive strength increases as the time interval until the casting increases. This observation is evidently only valid for the particular conditions through which the slump was maintained constant and which were proposed in the methodology of this study.
As previously mentioned, the observation of the increase in the average compression strength of concretes cast over a longer time may be explained by the loss of water to the environment and, consequently, a reduction in the actual water-cement ratio of the mix, as well as a possible breaking of the irst hydration products formed, which are larger and more fragile. It is impor-tant to highlight that this increase can vary depending on the characteristics of the equipment used and the volume produced. Hence, it is necessary to investigate whether the same occurs
Figure 2 – Compressive strength of the concrete
with other equipment and, especially, with a greater volume of concrete mixes.
However, it is important to emphasize that the employment of su -perplasticizers, along with regular agitation, allowed the casting of the concrete to be done over a time interval 2.5 times longer than what is prescribed by NBR 7212, while maintaining its me-chanic performance.
4. Conclusions
This study shows that differently from the standards set by NBR 7212 and from what is widely indicated in the literature, the concrete casting and finishing time can be extended be-yond150 min, to up to 360 min, as long as slump is maintained through the use of superplasticizers (maintaining the water/
Figure
4 – Compressive strength of the concrete
made with CPIV, at seven days
Figure 5 – Compressive strength of concrete
at twenty eight days, made with CP IV
Table 4 – Variance analysis
Source
Test
SQ
GDL
MQ
F
Probab
Comment
A: Type of cement
8780.53
1
8780.53
519,32
0.00%
S
B: Breaking age
2787.30
1
2787.30
164,85
0.00%
S
C: Compacting time
1056.91
5
211.38
12.50
0.00%
S
D: Mix proportion
1792.62
2
896.31
53.01
0.00%
S
AB
24.48
1
24.48
1.45
23.09
NS
AC
258.96
5
51.79
3.06
1.18%
S
AD
262.74
2
131.37
7.77
0.06%
S
BC
146.57
5
29.31
1.73
13.09%
NS
BD
77.52
2
38.76
2.29
10.49%
NS
CD
241.03
10
24.10
1.43
17.52%
NS
ABC
65.99
5
13.20
0.78
56.54%
NS
ABD
108.75
2
54.37
3.22
4.32%
S
ACD
406.53
10
40.65
2.40
1.16%
S
BCD
414.57
10
41.46
2.45
1.00%
S
ABCD
284.74
10
28.47
1.68
9.03%
NS
Error
2316.35
137
16.91
–
–
–
–
–
–
–
cement ratio), without loss of compressive strength.
5. Acknowledgments
The authors would like to thank NORIE (Núcleo Orientado à Inovação da Ediicação), UFRGS, for their support in the experimental phase of this study and the Coordenação de Aperfeiçoamento de Pessoal de Nível Superior (CAPES) for providing funding for this study.
6. References
[01] ASSOCIAÇÃO BRASILEIRA DE NORMAS TÉCNICAS. NBR NM 52: Agregado miúdo – Determinação da massa especíica aparente. Rio de Janeiro:
ABNT, 2003.
[02] ___. NBR NM 53: Agregado graúdo – Determinação da massa especíica, massa especíica aparente e absorção de água. Rio de Janeiro: ABNT, 2003. [03] ___. NBR NM 65: Cimento Portland – Determinação
dos tempos de pega – método de ensaio. Rio de Janeiro: ABNT, 2002.
[04] ___. NBR NM 67: Concreto – Determinação da consistência pelo abatimento do tronco de cone. Rio de Janeiro: ABNT, 1998.
[05] ___. NBR NM 248: Agregados – Determinação da composição granulométrica. Rio de Janeiro:
ABNT, 2003.
[06] ___. NBR 5733: Cimento Portland – Cimento Portland de alta resistência inicial – especiicação. Rio de Janeiro: ABNT, 1991.
[07] ___. NBR 5735: Cimento Portland – Cimento Portland de alto-forno - especiicação. Rio de Janeiro:
ABNT, 1991.
[08] ___. NBR 5736: Agregados – Determinação da composição granulométrica. Rio de Janeiro:
ABNT, 2003.
[09] ___. NBR 5738: Concreto – Procedimento para moldagem e cura de corpos-de-prova. Rio de Janeiro: ABNT, 2003.
[10] ___. NBR 5739: Concreto – Ensaio de compressão de corpos-de-prova. Rio de Janeiro: ABNT, 1994. [11] ___. NBR 7112: Concreto – Execução de concreto
dosado em central. Rio de Janeiro: ABNT, 1984. [12] ___. NBR 11578: Agregados – Determinação da
composição granulométrica. Rio de Janeiro:
ABNT, 2003.
[13] HELENE, P. L.; TERZIAN, P. R. Manual de dosagem e controle do concreto. Brasília: Pini, 1992.
[14] MEHTA, P. K.; MONTEIRO, P. J. M. Concreto: estrutura, propriedades e materiais. São Paulo: IBRACON, 2008.
[15] NEVILLE, A. M. Propriedades do concreto. 2° ed. São Paulo: PINI, 1997.
[16] SILVA, E. F. Variações dimensionais em concreto de alto desempenho contendo aditivo redutor de retração. 2007. Tese (Doutorado em Ciências em Engenharia Civil) – Programa de Pós-Graduação em Engenharia, Universidade Federal do Rio de Janeiro, Rio de Janeiro.
[17] VIEIRA, G. L. Inluência da microissuração causada por carregamento precoce nas propriedades mecânicas de concretos produzidos com diferentes tipos de cimento. 2008. Tese (Doutorado em Engenharia Civil) – Programa de Pós-Graduação em Engenharia Civil, Universidade Federal do Rio Grande do Sul,