Vibrational investigation of pressure- and
temperature-induced phase transitions in metal
formates templated by ethylammonium ions
Aneta Ciupa,
a*
Maciej Ptak,
aMiros
ł
aw M
ą
czka,
aJosé Gadelha da Silva Filho
band Paulo Tarso Cavalcante Freire
bWe report for the first time phonon properties of [CH3CH2NH3][Mg(HCOO)3] (EtAMg). The studied compound undergoes two
structural temperature-induced phase transitions and temperature-dependent Raman and infrared studies let us to obtain insight into mechanism of these transitions. In particular, very large broadening of infrared and Raman bands, attributed to vibrations of the NH3groups, revealed highly dynamic nature of these groups in the both high-temperature phases. This result indicates that
the phase transitions at 374 and 426 K are associated with disordering of the template cations. Raman and infrared data also show that both phase transitions are accompanied by significant distortion of the anionic framework. We also present the pressure-dependent Raman data of EtAMn framework up to 7.1 GPa. These data revealed presence of two pressure-induced phase transitions, one between 3.7 and 4.0 GPa and second between 5.6 and 6.0 GPa. We discuss mechanisms of these transitions. Copyright © 2017 John Wiley & Sons, Ltd.
Keywords:metal–organic framework; Raman spectra; infrared spectra; high-pressure Raman scattering; phase transition
Introduction
Metal–organic frameworks (MOFs) are porous hybrid materials consisting of metal ions and organic components as building blocks. Practically, the infinite number of inorganic–organic combinations, which can be selected for the design of novel MOFs, makes these materials very interesting for researchers. They are well known for exhibiting a wide spectrum of properties and functionalities that make them attractive materials for technological applications.[1–4]Although a lot of attention has been focused on
the application resulting from their porosity, that is, in catalysis, gas storage or separation,[5–7]there is a growing interest in studies
of phase transitions in the class of dense MOFs.[8–17]
Worthwhile examples are metal formate frameworks of general formula [cat] [M(HCOO)3] with M═Mg, Zn, Mn, Ni, Co, Fe, and cat = ammonium,
methylammonium and dimethylammonium (DMA), which have been particularly extensively examinated because of their polymorphism, magnetic and multiferroic properties.[8–17]Previous
studies have shown that these metal formate frameworks with magnetic ions exhibit long-range canted antiferromagnetic order at low temperatures and undergo ferroelectric phase transitions associated with orientational ordering of organic cations located in the cavities of the framework.[8–17]
One of interesting sub-group of dense MOFs are those containing ethylammonium cations (CH3CH2NH3+, EtA+) as
templates. Up to now, only four metal formates with EtA+cations
and divalent Mn (EtAMn), Cu (EtACu), Mg (EtAMg) and Cd (EtACd) ions were reported.[18–21]They are isostructural and crystallize at
room temperature in the non-centrosymmetricPna21space group
with ordered EtA+cations. Because the structure is polar, these
compounds are possible ferroelectrics and EtAMn can be regarded as a multiferroic material.[22,23] Interestingly, theoretical
considerations showed that the ferroelectric polarization can be strongly increased by applying compressive strain.[23] These compounds received also attention because of their polymorphism. For EtAMg, two phase transitions were reported, one at 374 K to trigonalR3 phase (HT-I) and second one at 426 K to orthorhombicImmaphase (HT-II).[18]It has been suggested that
these transitions are mainly associated with disorder of the EtA+
cations. In contrast to EtAMg, the phase transition in EtACu involves a strong distortion of the anionic framework, that is, the perovskite-like structure transforms at 375 K to a chiral diamond structure with orthorhombicP212121symmetry.[19]A quite unusual feature of this
material is that the high-temperature phase is metastable on cooling (phase transition is irreversible) and the backward phase can be restored only by high pressure.[19]It is worth adding that
although presence of structural changes in MOFs is fairly common, two temperature-induced phase transitions were rarely observed for metal formate frameworks, that is, beyond aforementioned EtAMg, such behavior was reported for [(CH2)3NH2][Zn(HCOO)3]
with azetidinium cations as templates (Tc1= 299 K, Tc2= 254 K).[24]
It is known that structures of solid-state materials and their mechanical properties can also be affected by an external pressure. As a consequence, an investigation of behavior of MOFs in
* Correspondence to: Aneta Ciupa, Institute of Low Temperature and Structure Research, Polish Academy of Sciences, Okolna 2, P.O. Box 1410, 50-950 Wrocław 2, Poland.
E-mail: [email protected]
a Institute of Low Temperature and Structure Research, Polish Academy of Sciences, P.O. Box 1410, 50-950, Wrocław 2, Poland
b Departamento de Física, Universidade Federal do Ceará, P.O. Box 6030, 60455-970, Fortaleza, CE, Brazil
Received: 14 December 2016 Revised: 13 March 2017 Accepted: 14 March 2017 Published online in Wiley Online Library: 10 May 2017
(wileyonlinelibrary.com) DOI 10.1002/jrs.5154
97
response to this external stimulus is necessary, especially from the application point of view. Up to date, a few papers reported high pressure studies of chiral,[25–27] perovskite [19,24,28,29] and
niccolite[30] metal formate frameworks. These studies revealed
presence of pressure-induced transformations and negative linear compressibility for some compounds. It is worth adding that high-pressure studies of the ferroelectricPna21phases were not
reported for any of the known EtAM compounds.
In this paper, we report temperature-dependent Raman and infrared (IR) studies of EtAMg in order to achieve deeper insight in the phase transitions mechanism that is responsible for the onset of ferroelectric properties below 374 K. We compare vibrational properties of EtAMg with data obtained for the manganese analogue for better understanding the differences in the behavior of both compounds. We also report pressure-dependent Raman data for EtAMn to obtain deeper insight into the stability of this compound and mechanisms of pressure-induced phase transitions. We will demonstrate that EtAMn undergoes pressure-induced phase transitions between 3.7 and 4.0 GPa as well as between 5.6 and 6.0 GPa that are associated with significant distortion of the framework.
Materials and methods
Preparation of crystals
Commercially available MnCl2(98%, Sigma-Aldrich), MgCl2· 6H2O
(98%, Sigma-Aldrich),N-ethylformamide (99%, Sigma-Aldrich) and HCOOH (98%, Fluka) were used without further purification. Both compounds were prepared under solvothermal method. A mixture of MCl2 (3 mmol),N-ethylformamide (25 mL), H2O (30 mL) and
formic acid (5 mL) was heated in a Teflon-lined microwave autoclave for 24 h. Colorless crystals were obtained by slow evaporation at room temperature and harvested after a few days. The crystals were filtered from the mother liquid and washed with methanol. The yield was about 74% (EtAMg) and 68% (EtAMn) based on the starting metal salts. Hygroscopy is mainly the feature of porous MOFs, whereas the dense ones are usually less sensitive to moisture. So far, our experience showed that MOFs with very small ions, for example, ammonium [[NH4][MII(HCOO)3] (M═Ni,
Mn, Zn, Fe, Mg) are sensitive to humidity.[31]Our studies of other
metal formates, including the studied here ethylammonium analogues, indicate that they do not change physicochemical properties after being exposed to moisture for a prolonged time. Nevertheless, in order to avoid possible problems with moisture, samples were stored in a desiccator in the presence of a drying agent with the humidity less than 20%.
Our synthesis method differs from that proposed by Shanget al.
[18]or
Wang et al.[20]; however, a good match of the powder XRD patterns with the simulation from the single-crystal structure determination confirms the phase purity of the grown crystals (Fig. S1).
X-ray diffraction powder pattern was recorded at room temperature by using X’Pert PRO powder diffractometer (PANalytical) working in the transmission or reflection geometry, equipped with a linear PIXcel detector and using CuKα1radiation
(λ= 1.54056 Å) in the 2Θrange from 10 to 80o.
Temperature-dependent Raman and infrared measurements
Raman spectra in the range of 3500–50 cm1was measured using a Renishaw InVia Raman spectrometer equipped with confocal DM
2500 Leica optical microscope, a thermoelectrically cooled CCD as a detector, and an argon laser operating at 488 nm. Temperature-dependent Raman spectra 300–460 K were measured using a Linkam cryostat cell THMS600 with a temperature stability of 0.5 K. Infrared spectra were measured in KBr pellet in the range 4000– 600 cm1 using Nicolet iN10 Fourier transform IR spectroscopy
microscope equipped with a ZnSe-Linkam cryostat cell THMS600 with a temperature stability of 0.1 K, liquid nitrogen (LN2) cooled
mercury-cadmium-telluride detector, permanently aligned 15× objective, 0.7 numerical aperture with working distance set to 16 mm. The spectral resolution was 2 cm1in all Raman and IR measurements.
High-pressure Raman scattering measurements
The high-pressure Raman spectra were recorded in back-scattering geometry using a microscope attached to a triple-grating spectrometer Jobin Yvon T64000. The 532 nm line of solid-state ion laser were used as excitation. The spectral resolution was 2 cm1. In an attempt to achieve high pressure, the EtAMg sample
was loaded into a membrane-type diamond-anvil cell μ-scope FROM Almax easyLab with a diamond of 0.35 mm of culets. A stainless steel gasket with a thickness of 200μm was pre-indented to 50μm. A 130μm hole was drilled in the center of the indentation by using an electric discharge machine from Almax easyLab. As pressure, transmitting media was served Nujol mull. Pressure were determined based on the shifts (Δω) of the ruby fluorescence lines (R1 and R2). Because these lines shift linearly with increasing
pressure (P), the pressure-values were calculated using the empirical relation P =Δω/7.535.
Results and discussion
Crystal structures
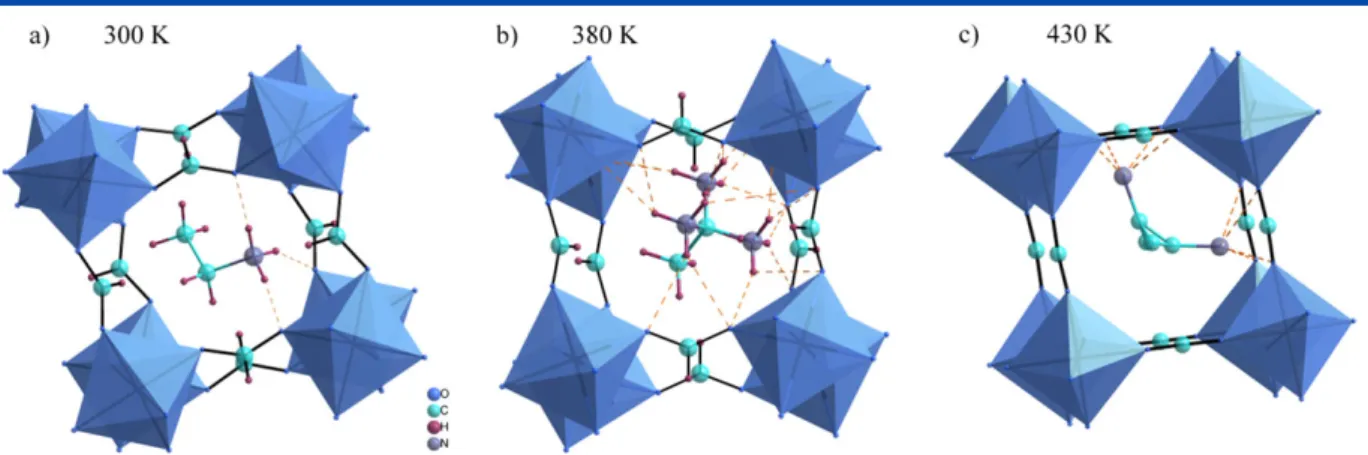
The correct interpretation of Raman and IR data requires the knowledge of crystal structure. Both EtAMg and EtAMn are isostructural and crystallize in the orthorhombic, non-centrosymmetric Pna21space group.[18,20]At room temperature,
each MIIion is octahedrally coordinated by HCOOligands that connect neighboring coordination spheres in the anti-anti
configuration mode (Fig. 1a). The ordered EtA+cations located in
the cavities of the [MII(HCOO)3] anionic framework interactvia
N─H O hydrogen bonds (HBs) with the oxygen atoms of the
HCOOligands.[18]All three hydrogen atoms from the NH 3 +
groups are involved in the formation of HBs. Above 374 K the HBs are too weak to overcome the thermally activated motions of the NH3+
groups. As a result, they are dynamically disordered within three symmetrically equivalent positions around the three-fold axis (Fig. 1b). What is more, the MgO6 octahedra are rotated by
approximately 30o to match the trigonal symmetry.[18] Further
heating leads to the occurrence of a second phase transition, at 426 K, in which the structure returns to the orthorhombic symmetry (space groupImma) with twofold disordered arrangement of the EtA+cations (Fig. 1c).[18]
According to literature data, manganese analogue does not undergo any structural transformations upon heating.[20]
Room temperature spectra
The observed Raman and IR bands should be divided into internal vibrations of the EtA+and HCOOions as well as lattice modes.
97
Free formate ion has C2vsymmetry and its fundamental internal
vibrations are as follows: the C-H stretching (ν1), the symmetric
(ν2) and asymmetric (ν4) C-O stretching, the symmetric OCO
bending (ν3), the C-H in-plane bending (ν5) and C-H out-of-plane
bending (ν6).[32]The isolated EtA+cation has Cssymmetry, and its
27 internal modes are distributed among 16A0 + 11A″
representation.[33]These modes consist of: (1) the symmetric and
antisymmetric stretching (νs(CH2) and νas(CH2), respectively),
scissoring (δ(CH2)), rocking (ρ(CH2)), wagging (ω(CH2)) and
torsion/twisting (τ(CH2)) modes of the CH2group; (2) the symmetric
and antisymmetric stretching (νsandνas, respectively), bending (δ),
rocking (ρ) and torsion (τ) modes of the CH3/NH3groups; (3) the
symmetric and antisymmetric stretching (νs(CCN) and νas(CCN),
respectively) and bending (δ(CCN)) modes of the CCN moiety.[34]
The lattice modes may be divided into translational (T0) modes of
magnesium, formate and EtA+ions and librational (L) modes of HCOOand EtA+ions. Because the studied materials crystallize in
the orthorhombicPna21 (C2v[9], No. 33, Z= 4) space group, the factor group analysis predicts that in the Brillouin zone center normal modes are distributed among 72A1+ 72A2+ 72B1+ 72B2 irreducible representations. All modes are Raman-active, whereas onlyA2modes are IR silent.
Room temperature Raman and IR spectra EtAMg and EtAMn are shown in Figs 2 and 3. The observed wavenumbers along with the
assignment are given in Table 1. We propose the assignment of bands corresponding to internal vibrations of the HCOO and EtA+ ions based mainly on the data available for the related
formates with NH4+ ([NH4][Mg(HCOO)3]), DMA+ ([(CH3)2NH2]
[Mg(HCOO)3]) and EtA+ cations, ([CH3CH2NH3][Na0.5MIII0.5(HCOO)3]
(MIII= Al, Cr, Fe), [CH3CH2NH3]2[FeIIFeIII(HCOO)6], and [CH3CH2NH3]
[Cd(HCOO)3]).[21,34–38] Because the room temperature phonon
properties of EtACd and EtAMn have been reported recently by us,[21]the detailed description will be avoided here. However, we
would like to highlight the importance of metal cation size on vibrational properties of HCOOions. For example, the comparison of previous Raman results for EtACd and EtAMn[21]with present
ones for EtAMg shows that the υ1 (C─H stretching) modes’
wavenumbers of EtAMg, EtAMn and EtACd change in the order 2875–2869 cm1
< 2860–2850 cm1 < 2853–2848 cm1,
respectively. Similar behavior is also observed for theυ6(C─H
out-of-plane bending) modes that shift from 1065 to 1059 cm1for
EtACd to 1068–1059 cm1 for EtAMn and 1075–1062 cm1 for EtAMg. Because the ionic radius increases in the sequence MgII
(0.72 Å)<MnII(0.83 Å)<CdII(0.95 Å),[39]the observed shifts can
be attributed to shortening of the C─H bonds with decreasing size
of the divalent cation.
It is also worth to mention that the position of modes involving HBs reflects their strength. Theν(NH3) vibrations of free ethylamine
molecule can be found in the 3300–3500 cm1region.[40–42]The
formation of intermolecular HBs (N─H O bonds) is manifested in
two ways in the vibrational spectra: (1) the N─H stretching modes
exhibit pronounced red-shift; (2) the intensity and bandwidth of the corresponding bands increase.[40–42] The magnitude of the
observed changes increases with increasing strength of the N─H
O bonds. Theν(NH3) bands of EtAMg are observed at about 130–
200 cm1 lower wavenumbers than expected for the isolated amine molecules. The obtained result indicates, therefore, that HBs in EtAMg are of medium strength.
The assignment of lattice modes is more difficult because these modes are strongly coupled. Our former room-temperature studies of EtACd and EtAMn allowed us to attribute the 71–199 cm1
bands to translations of MIIions and those above 200 cm1 to translational motions of formate ions.[21] This proposed and
tentative assignment requires verification because measurements performed for the magnesium analogue in the far IR region provide some important information (Fig. 3b). It is well known that wavenumbers of some lattice modes depend significantly on mass and size of ions building the structure. It is expected, therefore, that modes having stronger contribution of MII translations will shift
Figure 1. The view of the [CH3CH2NH3][Mg(HCOO)3] structure along thecaxis at (a) 300 K, (b) 380 K and (c) 430 K. Hydrogen bonds are marked as dashes
lines. [Colour figure can be viewed at wileyonlinelibrary.com]
Figure 2. Raman spectra of EtAMg and EtAMn recorded at room
temperature corresponding to the 40–3300 cm1
spectral range. [Colour figure can be viewed at wileyonlinelibrary.com]
97
toward lower wavenumbers as the mass of MIIincreases. This shift
should be approximately proportional to the square root of the appropriate reciprocal reduced mass.[43] Atomic mass of
magnesium (24.3 u) is over two times smaller than mass of manganese (54.9 u) and nearly five times smaller than mass of cadmium (112.4 u). Thus, translational modes of the lightest MgII ion should exhibit significant upshift in comparison with the corresponding modes of CdII and MnII. Because our spectrum of EtAMg shows most pronounced changes for the 339–354 cm1
bands, we assign them to T0(MgII) motions. A significant
contribution of T0(MgII) modes can also be observed in the 208–
266 cm1 spectral range. These bands shift towards higher wavenumbers when heavier MnIIor CdIIions are replaced by lighter
MgIIions. According to the literature data, librations of formate ions
are usually observed as strong Raman bands and weak or medium intensity IR bands[31,34,36]; therefore, we assigned the bands in the
92–198 cm1spectral range to L(HCOO) modes and those below 80 cm1to T0and L modes of the EtA+ions (Fig. 3b). Translations of
the formate ions give rise to presence of the 169–266 cm1bands.
Temperature-dependent Raman and infrared studies
Raman spectra of EtAMn sample recorded as a function of temperature (300–440 K) are presented in Fig. S2. Increasing of temperature leads to broadening and shift of bands. As a consequence, many bands are overlapped and hardly resolved above the room temperature. Since splitting as well as an emergence of additional or a disappearance of already present bands is not observed, the occurrence of a structural phase transition in EtAMn can be excluded, in agreement with the literature.[20] This conclusion is further supported by the
temperature evolution of wavenumbers and full width at half maximum (FWHM) values for a few selected Raman modes (Fig. S3), which do not show any splitting or discontinuous shifts in the temperature range studied.
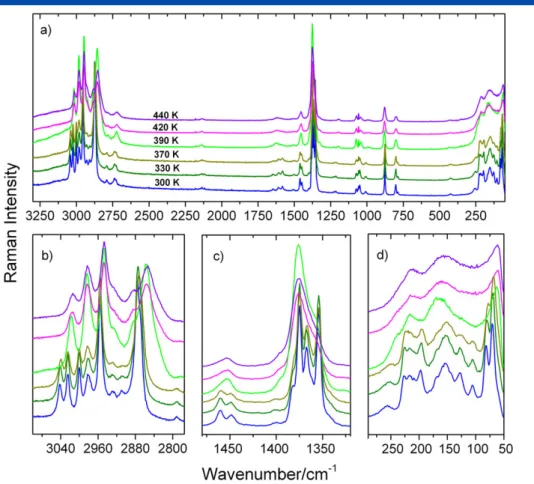
Infrared and Raman spectra of EtAMg recorded as a function of temperature (300–440 K) are presented in Figs 4 and 5, respectively. The increase of temperature up to 370 K does not cause any significant changes. However, at 390 K, the spectra modify abruptly showing the disappearance and pronounced broadening of a large number of bands. These sudden changes indicate the first-order character of the phase transition in EtAMg. According to the X-ray
diffraction data, EtAMg structure becomes trigonal (R3 ) above 374 K with trigonally disordered EtA+ cations.[18] Therefore, all
bands corresponding to these ions are expected to show a very pronounced changes in wavenumber, FWHM, etc. Our spectra are consistent with X-ray diffraction studies since they clearly show that above 374 K the bands attributed to internal modes of EtA+ions
exhibit strong broadening. For instance, the IR-activeρ(NH3) mode
observed at 1010 cm1is clearly apparent at room temperature but
becomes hardly visible at 390 K (Fig. 4). Similar behavior is also observed for the IR stretching modes of the NH3groups in the
3174–3297 cm1range. The highly dynamic nature of the phase transition is also manifested in the Raman spectra. For example, the well-resolved bands at 1449 and 1460 cm1, corresponding to bending modes of the CH3 and CH2 groups, merge above
390 K into one very broad band at 1452 cm1.
Increase of temperature also leads to significant changes in the 790–810 cm1 spectral range attributed to the symmetric OCO bending modes (ν3) of the HCOOions. The room-temperature IR
spectrum shows three bands at 789, 801 and 808 cm1, which become broad and overlapped in the HT-I phase (Fig. 4). Additionally, the new band appears at 974 cm1. Theν
5mode also
shows similar behavior, that is, the room-temperature doublet observed at 1382 + 1376 cm1transforms at 390 K into singlet at 1373 cm1. Such behavior indicates that the phase transition is
accompanied by significant distortion of the anionic magnesium-formate framework upon cooling. The presence of the phase transition in EtAMg is also clearly visible in the low wavenumber region (Fig. 5). The number of bands corresponding to the lattice modes is higher at room-temperature phase, what clearly evidence the lowering of EtAMg symmetry on cooling.
In order to better visualize the spectral changes occurring at the phase transition, we present the temperature dependences of selected Raman and IR wavenumbers as well as FWHM values (Figs S4 and S5). Figure S5 shows that upon heating up to 370 K the Raman band at 876 cm1, corresponding to theν
s(C─C) andνs
(C─N) modes, exhibits weak shift to lower wavenumbers and weak
broadening. This behavior is very similar to that observed for EtAMn (Fig. S3). However, both IR and Raman bands of EtAMg show noticeable discontinuous changes in wavenumbers and bandwidths values at the first structural phase transition indicating clearly the first-order character of this transformation. For example, upon heating up to 370 K the 809 (υ3(HCOO)), 1010 (ρ(NH3)) and
Figure 3. Room temperature spectra of EtAMg and EtAMn in (a) the mid-infrared (IR) and (b) far-IR region. For the sake of comparison, far-IR data for
previously reported EtACd[21]are also presented. [Colour figure can be viewed at wileyonlinelibrary.com]
97
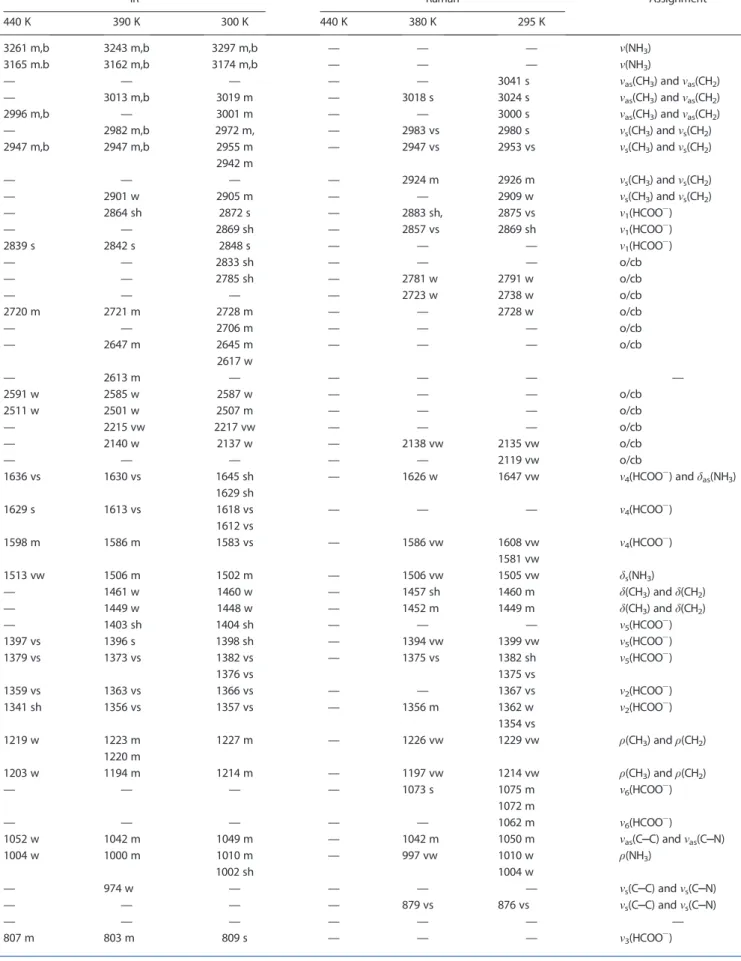
Table 1. Wavenumbers observed in the polycrystalline IR and Raman spectra of EtAMg
IR Raman Assignment
440 K 390 K 300 K 440 K 380 K 295 K
3261 m,b 3243 m,b 3297 m,b — — — ν(NH3)
3165 m.b 3162 m,b 3174 m,b — — — ν(NH3)
— — — — — 3041 s νas(CH3) andνas(CH2)
— 3013 m,b 3019 m — 3018 s 3024 s νas(CH3) andνas(CH2)
2996 m,b — 3001 m — — 3000 s νas(CH3) andνas(CH2)
— 2982 m,b 2972 m, — 2983 vs 2980 s νs(CH3) andνs(CH2)
2947 m,b 2947 m,b 2955 m
2942 m
— 2947 vs 2953 vs νs(CH3) andνs(CH2)
— — — — 2924 m 2926 m νs(CH3) andνs(CH2)
— 2901 w 2905 m — — 2909 w νs(CH3) andνs(CH2)
— 2864 sh 2872 s — 2883 sh, 2875 vs ν1(HCOO)
— — 2869 sh — 2857 vs 2869 sh ν1(HCOO)
2839 s 2842 s 2848 s — — — ν1(HCOO)
— — 2833 sh — — — o/cb
— — 2785 sh — 2781 w 2791 w o/cb
— — — — 2723 w 2738 w o/cb
2720 m 2721 m 2728 m — — 2728 w o/cb
— — 2706 m — — — o/cb
— 2647 m 2645 m
2617 w
— — — o/cb
— 2613 m — — — — —
2591 w 2585 w 2587 w — — — o/cb
2511 w 2501 w 2507 m — — — o/cb
— 2215 vw 2217 vw — — — o/cb
— 2140 w 2137 w — 2138 vw 2135 vw o/cb
— — — — — 2119 vw o/cb
1636 vs 1630 vs 1645 sh
1629 sh
— 1626 w 1647 vw ν4(HCOO) andδas(NH3)
1629 s 1613 vs 1618 vs
1612 vs
— — — ν4(HCOO)
1598 m 1586 m 1583 vs — 1586 vw 1608 vw
1581 vw
ν4(HCOO)
1513 vw 1506 m 1502 m — 1506 vw 1505 vw δs(NH3)
— 1461 w 1460 w — 1457 sh 1460 m δ(CH3) andδ(CH2)
— 1449 w 1448 w — 1452 m 1449 m δ(CH3) andδ(CH2)
— 1403 sh 1404 sh — — — ν5(HCOO)
1397 vs 1396 s 1398 sh — 1394 vw 1399 vw ν5(HCOO)
1379 vs 1373 vs 1382 vs
1376 vs
— 1375 vs 1382 sh
1375 vs
ν5(HCOO)
1359 vs 1363 vs 1366 vs — — 1367 vs ν2(HCOO)
1341 sh 1356 vs 1357 vs — 1356 m 1362 w
1354 vs
ν2(HCOO)
1219 w 1223 m
1220 m
1227 m — 1226 vw 1229 vw ρ(CH3) andρ(CH2)
1203 w 1194 m 1214 m — 1197 vw 1214 vw ρ(CH3) andρ(CH2)
— — — — 1073 s 1075 m
1072 m
ν6(HCOO)
— — — — — 1062 m ν6(HCOO)
1052 w 1042 m 1049 m — 1042 m 1050 m νas(C─C) andνas(C─N)
1004 w 1000 m 1010 m
1002 sh
— 997 vw 1010 w
1004 w
ρ(NH3)
— 974 w — — — — νs(C─C) andνs(C─N)
— — — — 879 vs 876 vs νs(C─C) andνs(C─N)
— — — — — — —
807 m 803 m 809 s — — — ν3(HCOO)
(Continues)
97
Table 1. (Continued)
IR Raman Assignment
440 K 390 K 300 K 440 K 380 K 295 K
— 800 m 801 sh — 803 m 801 m ν3(HCOO)
795 s 792 m 789 s — 794 m 787 w ν3(HCOO)
777 w — — — — — ν3(HCOO)
— — 424 m — 430w 425 w δ(CCN)
— — 354 vs — 351 w — T0(MgII)
— — 339 sh — — — T0(MgII)
— — 266 m — — — T0(HCOO) and T0(MgII)
— — — — 240 m 256 w T0(HCOO) and T0(MgII
)
— — 235 s — — — T0(HCOO) and T0(MgII)
— — 216 sh — 216 m,b 226 m, 217 m
214 m, 208 m
T0(HCOO) and T0(MgII )
— — 198 w
178 w
— 173 m,b 197 m, 181w
176 w,169 m
T0(HCOO)
— — 162 w,153 w
145 w
— 156 m,b 159 m,153 m
145 m
L(HCOO)
— — 127 w — 122 m,b 128 m
105 m
L(HCOO)
— — 115 w — — — L(HCOO)
— — 92 vw — — — L(HCOO)
— — — — 82 sh 81 s L(EtA+) and T0(EtA+)
— — 73 vw — 68 s
62 s
70 s L(EtA+) and T0(EtA+)
Key:ν, stretching;δ, bending;ρ, rocking vibration; the intensity of bands is describes as vs, s, m, w, vw, sh, b and denote very strong, strong, medium, weak, very weak, shoulder and broad, respectively; o, overtone; cb, combination band.
Figure 4. Details of mid-infrared spectra results for EtAMg measured at a few selected temperatures. The temperature intervals were set to 5 K in the I and II
temperature ranges and to 3 K in the III one. [Colour figure can be viewed at wileyonlinelibrary.com]
97
1500 cm1(
δs(NH3)) IR modes (at room temperature) display weak
red-shifts, followed by abrupt shifts near 373 K by about5,6
and +4 cm1, respectively (Fig. S4). These shifts are accompanied
by abrupt increase in FWHM. Furthermore, the Raman bands near 257 and 227 cm1coalescence at the phase transition (Fig. S5).
The observed shifts, coalescence and broadening proves that the phase transition at 374 K is related to ordering-disordering of the EtA+ cations as well as changes in the magnesium formate framework that lead to symmetry increase of the high-temperature phase.
Let us now discuss the second previously reported structural phase transition in EtAMg. DSC and XRD studies performed by Shanget al.showed that this compound transforms at 426 K from trigonal (space groupR3) to another orthorhombic system (space groupImma) with a twofold disordered state of EtA+.[18]According to group theory, the calculated irreducible representations for the
Pna21 phase, 72A1 + 72A2 + 72B1 + 72B2, become 24Ag + 24Au + 24Eg + 24Eu for the R3 phase and 18Ag+ 18B1g+ 18B2g+ 18B3g+18Au+ 18B1u+ 18B2u+ 18B3ufor theImmaone. Among these modes, theA1,A2,B1,B2,Ag,Eg,Ag,
B1g,B2gandB3gmodes are Raman-active whereas theA1,B1,B2,
Au,Eu,B1u,B2uandB3uones are IR-active. After subtracting the three acoustic modes for each phase, the expected number of Raman (IR) bands is 285, 48 and 72 (213, 46 and 69) for thePna21,R3 andImma
phase, respectively. The change of symmetry upon heating should be, therefore, observed as a disappearance of some bands at 374 K followed by splitting of some bands at 426 K. It is worth noting, however, that according to the X-ray diffraction data the framework
of theImma phase becomes more regular than those of the R3 one,[18]and thus the expected splitting can be small and not well
resolved in the high-temperature spectra. However, this structural transformation is mainly driven by reorientational motions of EtA+
cations, that is, the three-fold disorder of EtA+ in the R3 phase
changes into two-fold disorder in the Immaphase. This change should affect significantly vibrations of the EtA+cations.
Temperature-dependent Raman spectra do not show clear changes that could be attributed to the second phase transition at 426 K (Fig. 5). However, clear evidences of this phase transition can be found in the IR spectra that show presence of much stronger bands related to the EtA+ cations than the Raman
spectra. Firstly, a new band appears at 777 cm1 (
ν3(HCOO)),
whereas band around 1510 cm1
(δs(NH3)) becomes hardly visible.
Secondly, the 1042 cm1band (value at 390 K) attributed to
νas
(C-C) and νas(C-N) mode shows pronounced shift toward higher
wavenumbers by about 10 cm1 (Fig. 4). Thirdly, the bands at
803 (ν3(HCOO)) and at 2842 cm1 (ν1(HCOO)) (at 390 K) shift
to lower wavenumbers by 4 and 3 cm1, respectively. Fourthly,
the doublet observed at 1220 + 1223 cm1(at 390 K), assigned
to theρ(CH3) andρ(CH2) modes, transforms into a broad singlet
at 1219 cm1. Because the discussed changes concern vibrations
of both HCOOand EtA+ions, it is clear that the phase transition
is associated with changes in the distortion of the [Mg(HCOO)3]
framework and interactions between the framework and the EtA+ cations. The observed changes at the R3 to Imma phase transition are, however, much less pronounced than those observed at thePna21toR3 one.
Figure 5. Details of Raman spectra results for EtAMg measured at a few selected temperatures corresponding to the spectral range (a) 50–3300 cm1
; (b) 2775–3100 cm1
; (c) 1320–1475 cm1
; (d) 50–290 cm1
. [Colour figure can be viewed at wileyonlinelibrary.com]
97
In order to understand better the observed changes occurring during the second phase transition, we also plot wavenumber and FWHM values as a function of temperature for a few selected IR modes (Fig. S4). As can be seen, when temperature increases either significant changes in the slopes or discontinuous upshifts of wavenumbers and FWHM values can be observed near 430 K. For instance, the increase of FWHM for theρ(NH3) andυ3(HCOO)
modes are about 4 and 2 cm1, respectively. These changes are
much smaller than those at 374 K. This result is consistent with the fact that the first structural phase transition is associated with change of the structure from ordered to disordered whereas the second one is related to modification of an existing disorder of EtA+cations (from threefold to twofold disordered state).[18]
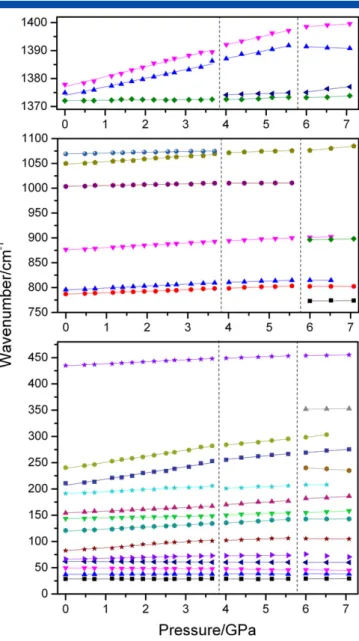
Pressure-dependent Raman scattering studies
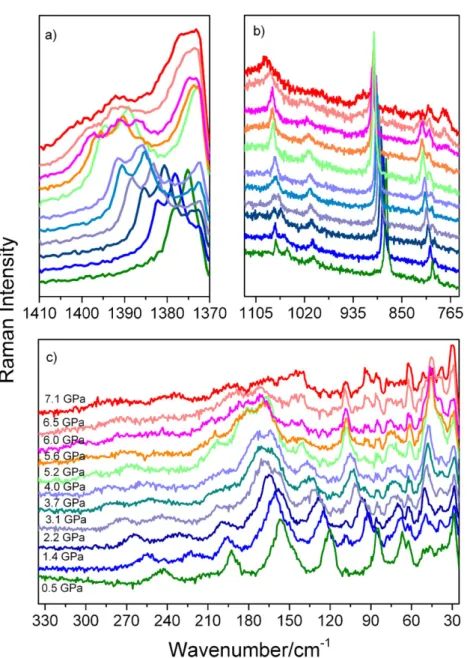
The pressure-dependent Raman spectra of EtAMn were collected up to 7.1 GPa (Fig. 6) followed by decompression to ambient
conditions (Fig. S9). Presented data showing pressure dependence of wavenumbers can be well described as a linear function
ω(P) =ωo+αP. Values of wavenumbers intercepts at zero pressure
(ωo) and pressure coefficients (α= dω/dP), obtained from fitting of
the experimental data by linear function are summarized in the Table 2.
As can be seen in Fig. 6, spectra remain unchanged up to about 3.1 GPa. The highestαcoefficients in this pressure range, 11.57 and 11.81 cm1GPa1, are observed for bands corresponding to the T0(HCOO) and T0(MnII) modes. This result indicates that the
metal-formate framework is more strongly affected by the applied pressure than EtA+ cations, that is, the metal-oxygen octahedra
become more compressed.
When pressure reaches 4.0 GPa, the bands observed at ambient pressure at 1050 and 1069 cm1 merge into a single peak at 1071 cm1. Intensity of the 121 and 191 cm1 bands,
corresponding to translations and librations of the HCOOions, strongly decreases whereas intensity of the 49 cm1 band,
Figure 6. Enlarged parts of Raman spectra recorded for EtAMn crystal during compression experiment showing details in the spectral range (a) 1370–
1410 cm1
; (b) 750–1125 cm1
; (c) 25–345 cm1
. [Colour figure can be viewed at wileyonlinelibrary.com]
97
corresponding to the L(EtA+) and T0(EtA+) modes, exhibits an
opposite dependence. Furthermore, many modes exhibit change of slope of their wavenumbersversus pressure between 3.7 and 4.0 GPa (Fig. 7). The observed changes indicate that EtAMn undergoes a structural phase transition between 3.7 and 4.0 GPa. The observed features suggest that the phase transition leads to stronger distortion of the metal formate framework. However, widths of bands corresponding to the EtA+ions are weakly affected, indicating that the pressure-induced transition does not involve the ordering/disordering of the templated cations.
Upon further compression beyond 4.0 GPa, majority of modes exhibit positive pressure dependence. However, some low wavenumber modes have negative measured pressure coefficientsα(Table 2) and this results indicates instability of this phase. It is also worth noting that intensity of the 136 cm1band
(at 4.0 GPa), which has been attributed to HCOO librations, strongly decreases with increasing pressure and this band becomes very weak at 5.6 and 6.0 GPa but again relatively intense at higher pressures. In contrast to this behavior, intensity of the band near 50 cm1 significantly increase on compression and this band exhibits strongly negative pressure dependence. Furthermore, when pressure reaches 6.0 GPa, a few new bands appear at 898 cm1(
νs(C─C) andνs(C─N)), 773 cm1(ν3(HCOO),
352 cm1(T0(MnII)) and 240 cm1(T0(MnII)). It can also be noticed
that when pressure reaches 6.0 GPa, theδ(CH3) andδ(CH2) modes
of the EtA+ cations gradually broaden and the ρ(NH3) mode
disappears. Broadening is also observed for several lattice bands
(131–156 cm1) corresponding to the L(HCOO) modes. The observed change in the spectra indicates that EtAMn exhibits a second pressure-induced phase transition between 5.6 and 6.0 GPa associated with lowering of symmetry and distortion of the manganese formate framework. Large width of Raman bands corresponding to the lattice and EtA+ modes suggests that distortion of the manganese formate framework is accompanied by some disorder of the EtA+cations. It is worth adding that apart the 898 cm1band, the spectrum at 6.0 and 6.5 GPa also shows
presence of the 901 cm1 band of the original intermediate phase. This behavior indicates that at these pressures the sample has some admixture of the intermediate phase. The coexistence of two phases can be most likely attributed to strongly first-order nature of this transition.
The Raman spectrum of EtAMn collected upon decompresion (Fig. S6) looks similar to the ambient one, indicating that both structural changes in the studied compound are reversible. From the application point of view, it is especially important to study stability and flexibility of MOFs under different pressures. Most of the Raman bands at 7.1 GPa are still intense and do not exhibit a very pronounced broadening, which could suggest amorphization. Similar stability was reported for [(CH3)2NH2]
[Zn(HCOO)3].[24]
Recent high-pressure Raman studies of [(CH3)2NH2][Mn(HCOO)3]
(DMMn)[44] revealed the existence of three high-pressure
polymorphs at 2.1, 4.1 and 6.7 GPa. It was shown that all of phase transitions are associated with the deformation of
manganese-Table 2. Wavenumber intercepts at zero pressure (ω0) and pressure coefficients (α= dω/dP), obtained from fitting of the experimental data by linear
functions, for the three phases of EtAMn
Ambient pressure phase Intermediate phase High-pressure phase Assignment
ω0(cm1) α(cm1GPa1) ω0(cm1) α(cm1GPa1) ω0(cm1) α(cm1GPa1)
1377.1 3.57 1378.7 3.34 1392.9 0.94 ν5(HCOO)
— — 1372.3 0.48 1364.2 1.83 ν2(HCOO)
1373.9 3.08 1375.6 2.89 1394.8 0.56 ν2(HCOO)
1372.12 0.11 1370.1 0.57 1369.4 0.62 ν2(HCOO)
1069.2 1.64 1061.1 2.66 1047.2 8.14 ν6(HCOO)
1048.3 5.39 — — — — νas(C─C) andνas(C─N)
1003.7 1.73 1009.1 0.34 — — ρ(NH3)
875.7 4.67 879.4 3.72 888.1 2.17 νs(C─C) andνs(C─N)
— — — — 885.9 1.74 νs(C─C) andνs(C─N)
795.2 3.95 800.3 2.59 818.6 0.62 ν3(HCOO)
786.6 3.02 786.9 2.93 802.7 0.06 ν3(HCOO)
— — — — 768 0.86 ν3(HCOO)
434.5 3.74 437.94 2.76 445.8 1.32 δ(CCN)
— — — — 347.4 0.76 T0(MnII)
— — — — 268.3 4.66 T0(MnII)
239.1 11.57 254.0 7.39 241.0 9.56 T0(HCOO) and T0(MnII
)
206.9 11.81 228.6 7.02 234.9 5.75 T0(HCOO) and T0(MnII)
190.9 3.95 189.1 3.04 206.6 0.23 T0(HCOO)
154.4 3.48 151.4 4.60 158.1 3.93 L(HCOO)
143.4 4.06 140.2 2.54 134.3 3.25 L(HCOO)
119.7 3.92 117.4 4.46 141.1 0.26 L(HCOO)
82.5 5.56 91.2 2.73 109.6 0.69 L(EtA+) and T0(EtA+)
66.2 1.83 70.2 0.68 93.9 2.35 L(EtA+) and T0(EtA+)
62.3 0.51 60.9 0.13 60.7 0.08 L(EtA+) and T0(EtA+)
49.4 0.47 53.5 1.42 53.1 1.16 L(EtA+) and T0(EtA+)
37.5 0.20 38.4 0.02 42.2 0.58 L(EtA+) and T0(EtA+)
28.7 0.03 29.2 0.10 27.9 0.19 L(EtA+) and T0(EtA+)
98
formate frameworks, whereas the DMA+cations are not largely
influenced.[44] The transition at 6.7 GPa is also connected with
large structural changes in the HBs system.[44] Our results
obtained for EtAMn also reveal deformation of the anionic formate framework under applied high pressure. Similar behavior of these two compounds can be attributed to the similar values of ionic radii of EtA+and DMA+cations (r
Aeff= 274 pm and 272 pm,
respectively).[45]However, as can be noticed the phase transition
pressures of DMMn are significantly lower compared to EtAMn (the first transition in DMMn occurs already at 2.1 GPa, compared to 3.7–4.0 GPa for EtAMn). This behavior can be most likely attributed to more robust HBs in EtAMn compared to DMMn (the former compound has NH3 group that is involved in
formation of three medium-strength HBs in thePna21 phase[18]
whereas the latter has NH2 group involved in two
medium-strength HBs[18]), which leads to larger stiffness of EtAMn
compared to DMMn.
Conclusions
We have studied two metal-formate frameworks containing ethylammonium ions as templates, EtAMg and EtAMn, using vibrational spectroscopy. Our measurements allowed us to propose assignment of all observed IR and Raman bands.
The temperature-dependent vibrational spectra of EtAMg showed evidences for two structural phase transitions occurring at 374 and 426 K. The sudden changes of the spectra prove the first-order nature of these phase transformations. Moreover, the observation of the most significant changes upon heating for modes attributed to vibrations of the NH3groups confirms that
the driving force of the observed structural transformations is change in the re-orientational motions of the EtA+ions in the HT-I
and HT-II phases. However, order–disorder processes are accompanied by deformation of the anionic framework, as demonstrated, for example, by pronounced shifts of bands attributed to vibrational motions of the formate ions. It is worth to mention that the studied EtAMg compound is a rare example of dense MOFs undergoing more than one phase transition.
High-pressure Raman scattering measurements of EtAMn have confirmed its high stability because no amorphization was observed up to 7.1 GPa. Our results have indicated that studied compound exhibit two pressure-induced phase transitions. The first transition occurs between 3.7 and 4.0 GPa, and it is accompanied by the deformation of the metal formate framework and symmetry lowering. The second transition is observed between 5.6 and 6.0 GPa, and it is associated with distortions of both metal formate framework and EtA+cations as well as significant the strengthening
of the interactions between EtA+cations and manganese formate
framework because of significant collapse of the cavity occupied by these cations upon compression.
References
[1] C. Janiak, J. K. Vieth,New J. Chem.2010,34, 2366. [2] G. Férey,Chem. Soc. Rev.2008,37, 191.
[3] A. Schneemann, V. Bon, I. Schwedler, I. Senkovska, S. Kaskel, R. A. Fischer,Chem. Soc. Rev.2014,43, 6062.
[4] H. Furukawa, K. E. Cordova, M. O’Keeffe, O. M. Yaghi,Science2013,
341, 974.
[5] J.-R. Li, R. J. Kuppler, H.-C. Zhou,Chem. Soc. Rev.2009,38, 1477. [6] M. Alhamami, H. Doan, C.-H. Chen,Materials2014,7, 3198. [7] B. Li, H.-M. Wen, W. Zhou, B. Chen,J. Phys. Chem. Lett.2014,5, 3468. [8] M. Mączka, A. Gągor, B. Macalik, A. Pikul, M. Ptak, J. Hanuza,Inorg. Chem.
2014,53, 457.
[9] P. Jain, V. Ramachandran, R. J. Clark, H.-D. Zhou, B.-H. Toby, N. S. Dalal, H. W. Kroto, A. K. Cheetham,J. Am. Chem. Soc.2009,131, 13625. [10] K. Vinod, C. S. Deepak, S. Sharma, D. Sornadurai, A. T. Satya,
T. R. Ravindran, C. S. Sundara, A. Bharathi,RSC Adv.2015,5, 37818. [11] L. C. Gómez-Aguirre, B. Pato-Doldán, J. Mira, S. Castro-García,
M. A. Señarís-Rodríguez, M. Sánchez-Andújar, J. Singleton, V. S. Zapf,
J. Am. Chem. Soc.2016,138, 1122.
[12] R. Shang, S. Chen, Z.-M. Wang, S. Gao,Chem. A Eur. J.2014,20, 15872. [13] N. Abhyankar, M. Lee, M. Foley, E. S. Choi, G. Strouse, H. W. Kroto,
N. S. Dalal,Phys. Status Solidi RRL2016,10, 600.
[14] M. Mączka, A. Ciupa, A. Gągor, A. Sieradzki, A. Pikul, B. Macalik, M. Drozd,
Inorg. Chem.2014,53, 5260.
[15] S. Chen, R. Shang, K.-L. Hu, Z.-M. Wang, S. Gao, Inorg. Chem. Front.
2014,1, 83.
[16] K.-L. Hu, M. Kurmoo, Z. Wang, S. Gao,Chem. A Eur. J.2009,15, 12050. [17] M. Mączka, N. L. Marinho Costa, A. Gągor, W. Paraguassu, A. Sieradzki,
J. Hanuza,Phys. Chem. Chem. Phys.2016,18, 13993.
[18] R. Shang, G.-C. Xu, Z.-M. Wang, S. Gao,Chem. A Eur. J.2014,20, 1146. [19] R. Shang, S. Chen, B.-W. Wang, Z.-M. Wang, S. Gao,Angew. Chem.2016,
55, 2097.
Figure 7. Wavenumber versus pressure plots of the Raman modes
observed in EtAMn crystal for compression experiment. The solid lines are linear fits on the data toω(P) =ωo+αP. Vertical lines show the pressures at which structural phase transitions occur. [Colour figure can be viewed at wileyonlinelibrary.com]
98
[20] Z. Wang, B. Zhang, T. Otsuka, K. Inoue, H. Kobayashi, M. Kurmoo,Dalton Trans.2004,15, 2209.
[21] A. Ciupa, M. Ptak,Vib. Spectrosc.2016,86, 67.
[22] D. Di Sante, A. Stroppa, P. Jain, S. Picozzi,J. Am. Chem. Soc.2013,135, 18126.
[23] S. Ghosh, D. Di Sante, A. Stroppa,J. Phys. Chem. Lett.2015,6, 4553. [24] M. Mączka, T. A. da Silva, W. Paraguassu, M. Ptak, K. Hermanowicz,Inorg.
Chem.2014,53, 12650.
[25] W. Li, M. R. Probert, M. Kosa, T. D. Bennett, A. Thirumurugan, R. P. Burwood, M. Parinello, J. A. K. Howard, A. K. Cheetham,J. Am. Chem. Soc.2012,134, 11940.
[26] M. Mączka, P. Kadłubański, P. T. C. Freire, B. Macalik, W. Paraguassu, K. Hermanowicz, J. Hanuza,Inorg. Chem.2014,53, 9615.
[27] M. Mączka, K. Pasińska, M. Ptak, W. Paraguassu, T. Almeida da Silva, A. Sieradzki, A. Pikul,Phys. Chem. Chem. Phys.2016,18, 31653. [28] W. Li, A. Thirumurugan, P. T. Barton, Z. Lin, S. Henke, H. H. M. Yeung,
M. T. Wharmby, E. G. Bithell, J. A. K. Howard, A. K. Cheetham,J. Am. Chem. Soc.2014,136, 7801.
[29] M. Mączka, T. Almeida da Silva, W. Paraguassu, K. Pereira da Silva,
Spectrochim. Acta, Part A2016,156, 112.
[30] M. Mączka, A. Gągor, N. L. Marinho Costa, W. Paraguassu, A. Sieradzki, A. Pikul,J. Mater. Chem. C.2016,4, 3185.
[31] M. Mączka, K. Szymborska-Małek, A. Ciupa, J. Hanuza,Vib. Spectrosc.
2015,77, 17.
[32] M. Mączka, J. Hanuza, A. A. Kamińskii,J. Raman Spectrosc.2006,37, 1257.
[33] D. Zeroka, J. O. Jensen, A. C. Samuels,J. Mol. Struct.1999,465, 119.
[34] M. Mączka, A. Ciupa, A. Gągor, A. Sieradzki, A. Pikul, M. Ptak,J. Mater. Chem. C2016,4, 1186.
[35] M. Mączka, A. Pietraszko, B. Macalik, K. Hermanowicz,Inorg. Chem.
2014,53, 787.
[36] K. Szymborska-Małek, M. Trzebiatowska-Gusowska, M. Mączka, A. Gągor,Spectrochim. Acta A2016,159, 35.
[37] M. Ptak, M. Mączka, A. Gągor, A. Sieradzki, A. Stroppa, D. Di Sante, J. M. Perez-Mato, L. Macalik,Dalton Trans.2016,45, 2574.
[38] M. Ptak, M. Mączka, A. Gągor, A. Sieradzki, B. Bondzior, P. Dereń, S. Pawlus,Phys. Chem. Chem. Phys.2016,18, 29629.
[39] R. D. Shannon,Acta Crystallogr., Sect. A: Cryst. Phys. Diffr., Theor. Gen. Crytallorg.1976,32, 751.
[40] G. Bator, T. Zeeger-Huyskens, R. Jakubas, J. Zaleski,J. Mol. Struct.2001,
570, 61.
[41] M. Drozd, D. Dudzic,Spectrochim. Acta A2013,115, 345. [42] L. Sobczyk, M. Obrzyd, A. Filarowski,Molecules2013,18, 4467. [43] M. Nicol, J. F. Durana,J. Chem. Phys.1971,54, 1436.
[44] L. Xin, Z. Fan, G. Li, M. Zhang, Y. Han, J. Wang, K. P. Ong, Y. Zheng, X. Lou,
New J. Chem.2017,41, 151.
[45] G. Kieslich, S. Sun, A. K. Cheetham,Chem. Sci.2014,5, 4712.
Supporting information
Additional Supporting Information may be found online in the supporting information tab for this article.