Discontinuous Sets of Knee Extensions Induce Higher Cardiovascular
Responses in Comparison to Continuous Ones
Marcos Doederlein Polito1, Roberto Simão2, Vitor Agnew Lira5, Antônio Cláudio Lucas da Nóbrega3, Paulo de Tarso Veras Farinatti4
Universidade Estadual de Londrina, Paraná, PR1, Universidade Federal do Rio de Janeiro, Rio de Janeiro, RJ2, Universidade Federal Fluminense,
Niterói, RJ3, Universidade do Estado do Rio de Janeiro, Rio de Janeiro, RJ4, University of Florida - College of Health and Human Performance, Florida,
United States5
Summary
Background: The strength training can promote significant cardiovascular responses during its performance and it is interesting to devise strategies to reduce them, without compromising the strength production.
Objective: To compare the acute cardiovascular responses of systolic arterial pressure (SAP), diastolic arterial pressure (DAP), heart rate (HR) and double product (DP) during the unilateral knee extension (four series of 8 maximum repetitions) performed continuously or discontinuously. Both protocols involved a 2-minute interval between the series and the discontinuous protocol had an extra interval of 2 seconds between the 4th and the 5th repetitions.
Methods: Eight healthy men trained in muscular strength (aged 26±6 years) participated in the data collection and were randomly divided in two non-consecutive days. The cardiovascular responses were measured by photoplethysmography (Finapres, Ohmeda, Louisville, CO, USA) at rest, at the end of each series and 2 minutes after the performance of each protocol.
Results: The discontinuous series showed significantly higher values when compared to the protocol of the continuous series for: SAP (mmHg) at the 2nd (173.1±5.4 vs 152.0±4.0; p=0.001), 3rd (188.9±8.6 vs 162.4±6.0; p=0.000) and 4th
series (193.1±8.1 vs 161.6±5.9; p=0.000); DAP (mmHg) at the 3rd(103.8±4.1vs 86.1±3.3; p=0.000) and 4th series
(104.1±2.7vs 83.4±3.3; p=0.000); DP (mmHg.bpm) at the 2nd (17,907.5±1,350.7 vs 14,541.9±1,848.0; p=0.03), 3rd
(19,687.3±1,444.3vs 15,612.1±1,180.3; p=0.008) and 4th series (21,271.0±1,794.2 vs 15,992.0±1,093.4; p=0.001).
Conclusion: The discontinuous protocol promoted higher increase in pressure responses when compared to the continuous one. However, due to the characteristics of the study design, further studies are necessary to support these findings. (Arq Bras Cardiol 2008; 90(6): 350-355)
Key words: Blood pressure; heart rate; photoplethysmography; muscle strength.
Mailing address: Marcos Doederlein Polito •
Universidade Estadual de Londrina - Centro de Educação Física e Esporte - Departamento de Educação Física - Rodovia Celso Garcia Cid km 380 - Campus Universitário - 86051-990 - Londrina - Paraná - Brazil E-mail: [email protected]
Manuscript received September 06, 2007, revised manuscript received November 20, 2007, accepted January 21, 2008.
Introduction
The strength training can promote significant increases in heart rate and blood pressure through the adrenergic and metabolic responses and the vascular compression caused by the exercise1,2. Several factors can determine the magnitude of
the cardiovascular response in situations of elevated strength production, such as velocity of movement3, number of series4,
percentage of maximum load5, type of muscular contraction
and involved muscular mass2,6, number of repetitions2, types
of exercise1, interval of recovery between the series7 and
training status8,9.
Regardless of the cardiovascular demand related to the strength training, this activity can be a part of the training routine
of people presenting heart diseases with relative safety10. One
way to decrease the cardiovascular exertion is the submaximum combination of loads and repetitions5, but it could compromise
a significant development of muscular strength.
Another strategy is related to the interruption throughout the performance of an exercise, instead of performing it continuously. This procedure was used in three studies11-13
and the results indicated a decrease in the cardiovascular responses. However, some methodological differences were identified that could discharacterize the strength training program, such as a discontinuous series characterized by the inclusion of another exercise11; a too-long interval (15 seconds)
and measurement of heart rate, only, which is limited to infer on the cardiovascular demand during the strength training12
and interval occurring at each repetition13.
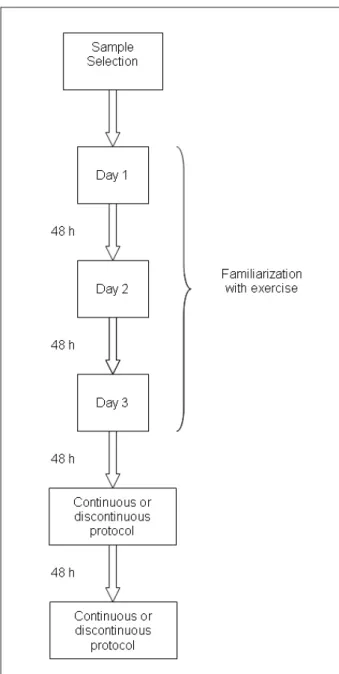
the continuous or the discontinuous protocol on each day. Both protocols involved four series of 8MR with a 2-minute interval between the series. The choice of number of series, repetitions and interval duration used those suggested by the American College of Sports Medicine, as reference15. In
the discontinuous protocol, a 2-second interval was inserted between the 4th and 5th repetition. During the interval, the
subjects remained immobile on the equipment.
The blood pressure at rest was recorded after 10 minutes in sitting position, at the equipment, maintaining the subject immobile, calm and without talking. Both at rest and during the exercise, the blood pressure was measured by photoplethysmography (Finapres™ 2350, Ohmeda, WI, USA), (Finapres™ 2350, Ohmeda, WI, USA), which can be considered a noninvasive procedure that is more adequate for the measurement of SAP and DAP during That did not occur in any of the three aforementioned
experiments or the evaluated cardiovascular response was not the best one. Therefore, we chose an interval of 2 sec during a series with maximum repetitions, considering that the cardiovascular responses must decrease 1-2 sec after the end of the exercise14. Our hypotheses was that 2 sec would be
enough to cause the decrease in the cardiovascular responses without compromising intensity.
Therefore, the objective of this study was to compare the systolic arterial pressure (SAP), diastolic arterial pressure (DAP), heart rate (HR) and double product (DP) during four series of eight maximum repetitions (8MR) in the unilateral knee extension with and without the 2-second interval.
Methods
The sample size was calculated in a previous pilot study, considering 0.80 as the statistical power and supposing a minimum detected difference of 32 mmHg with a standard deviation (SD) of 18 mmHg for SAP in four series of the exercise. Eight men (mean age±SD: 26±6 years; mean height:173.9±6.3 cm; mean weight:75.4±11.7 kg), non-athletes, with at least one year of experience in strength training were volunteers in the study. All participants signed a free and informed consent form. The sample was advised not to consume caffeine or alcohol 24 hours prior to the data collection and maintain a postprandial fast of 3 hours on the day of data collection.
Exclusion criteria were: use of ergogenic substance or any cardiovascular action drug; osteomyoarticular injuries; diagnosis of arterial hypertension.
Figure 1 shows the study design used. After sample selection, the data collection was started with the 8MR test performance during the unilateral knee-extension exercise in the dominant limb (right limb in all volunteers), using specific equipment (hyperextension chair, Life Fitness, Brunswick, Atlantic, USA). The exercise was performed with individuals sitting up straight at a 90-degree angle between the seat and back of the hyperextension chair. The angle of movement was calculated based on the knee flexion at 90o, ending with total
extension, with a 2-second duration for the concentric and eccentric movement timed by a metronome. The choice of unilateral performance was due to the fact that some subjects could elevate 100% of the equipment load in a bilateral performance and because it was more comfortable to stabilize the body by maintaining one hand free to have the blood pressure measured. Load attainment was obtained after three days of training, with 48-hr intervals, in order for the sample to get acquainted with the protocol. On each day, the subjects had up to 5 attempts to perform no more than 8 repetitions at the defined angulation, with an interval between attempts of at least 5 minutes. No interval was allowed between the concentric and eccentric phases or between repetitions; the sample was also instructed on the correct positioning on the equipment, in order to allow the measurement of the blood pressure and not to perform the Valsalva maneuver.
After the 8MR test, the subjects visited the laboratory on two different occasions with a 48-hr interval between them,
strength exercises4,16. A cuff was applied to the middle finger
of the left hand to detect the distension of the digital artery. To prevent possible interferences of gravity on the measurement site17, the left hand was positioned close to the heart through
a support and the subjects were instructed not to perform any contraction or movement involving the left fingers, wrist, elbow or shoulder. All cardiovascular variables related to physical exercise were recorded immediately after the end of each series (end of the movement) and 2 minutes after the end of the exercise. To help the sample get familiarized with the adequate position when performing the exercise, the blood pressure was measured during the 8MR test. High intraclass correlation coefficients were observed in the last two days of 8MR tests, both at rest [HR=0.93 (p=0.000); SAP=0.92 (p=0.000); DAP=0,84 (p=0.000)] and during exercise [HR=0.89 (p=0.001); SAP=0.91(p=0.000); DAP=0.82 (p=0.001)].
The same equipment that measured arterial pressure was used to record the HR. The DP was calculated through the equation: DP=SAP x HR.
The data were analyzed by the mean descriptive method and mean standard error to express the results. The inferential treatment was carried out by Student’s t test for dependent samples in order to compare the cardiovascular values at rest on both days of data collection. Two-way ANOVA (protocol
used and number of measurements – rest, series, post-exercise) with repeated measurements in the second factor was used to compare the cardiovascular responses before, during and after the exercise, followed by Bonferroni post-hoc test to detect significant differences (p<0.05). The data were analyzed with the StatisticaTM software (version 6.0,
Statsoft, OK, USA).
Results
Both protocols showed that the values of SAP, DAP, HR and DP in all the series of the exercise were significantly higher (p<0.05) than values at rest (Tables 1 and 2). All the variables returned to values close to those at rest 2 minutes after the end of the exercise. When analyzing each protocol separately, it is possible to observe that, despite the tendency to elevation regarding the cardiovascular responses during the series in the continuous protocol (especially SAP), the values were not statistically different between the 1stand the
4th series (Table 1). On the other hand, in the protocol of the
discontinuous series, there were significant increases throughout the series, especially for SAP, DAP and DP (Table 2).
When comparing the values observed in both protocols, there was no difference between at-rest and recovery values. However, during the exercise, the protocol of the discontinuous series showed significantly higher values
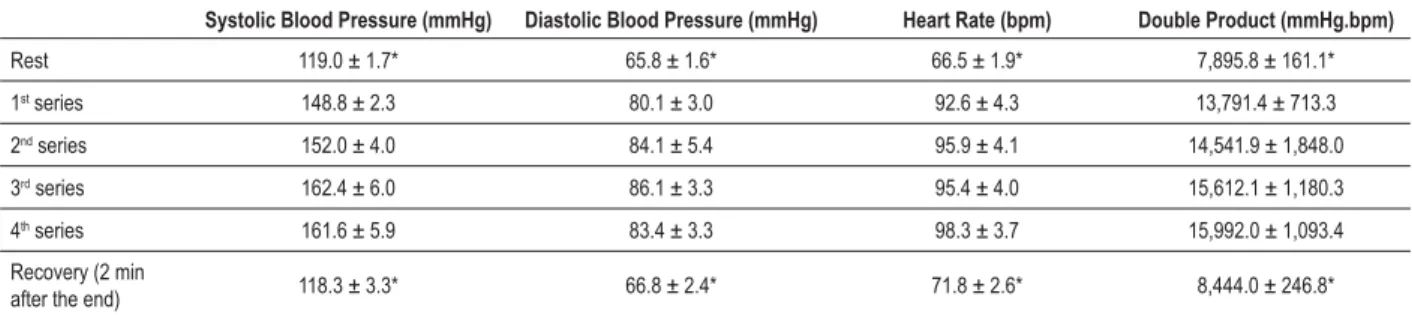
Table 1 - Blood pressure, heart rate and double product at the different moments of the protocol of the continuous series (mean ± standard error)
Systolic Blood Pressure (mmHg) Diastolic Blood Pressure (mmHg) Heart Rate (bpm) Double Product (mmHg.bpm)
Rest 119.0 ± 1.7* 65.8 ± 1.6* 66.5 ± 1.9* 7,895.8 ± 161.1* 1st series 148.8 ± 2.3 80.1 ± 3.0 92.6 ± 4.3 13,791.4 ± 713.3
2nd series 152.0 ± 4.0 84.1 ± 5.4 95.9 ± 4.1 14,541.9 ± 1,848.0
3rd series 162.4 ± 6.0 86.1 ± 3.3 95.4 ± 4.0 15,612.1 ± 1,180.3
4th series 161.6 ± 5.9 83.4 ± 3.3 98.3 ± 3.7 15,992.0 ± 1,093.4
Recovery (2 min
after the end) 118.3 ± 3.3* 66.8 ± 2.4* 71.8 ± 2.6* 8,444.0 ± 246.8*
VLJQL¿FDQWGLIIHUHQFHSIRUVHULHVDQG
Table 2 - Blood pressure, heart rate and double product at the different moments of the protocol of the discontinuous series (mean ± standard error)
Systolic Blood Pressure (mmHg) Diastolic Blood Pressure (mmHg) Heart Rate (bpm) Double Product (mmHg.bpm)
Rest 122.4 ± 3.0* 63.8 ± 2.0* 69.6 ± 1.8* 9,360.1 ± 341.4* 1st series 156.1 ± 2.6† 77.1 ± 1.9† 95.0 ± 7.3§ 14,941.9 ± 1,376.5‡
2nd series 173.1 ± 5.4‡ 90.0 ± 2.8‡ 102.5 ± 4.8 17,907.5 ± 1,350.7//
3rd series 188.9 ± 8.6 103.8 ± 4.1 106.3 ± 4.0 19,687.3 ± 1,444.3
4th series 193.1 ± 8.1 104.1 ± 2.7 109.4 ± 5.6 21,271.0 ± 1,794.2
Recovery (2 min
after the end) 132.9 ± 3.5* 69.6 ± 3.4* 79.8 ± 4.3* 10,672.0 ± 811.2*
when compared to the continuous series for SAP at the 2nd
(173.1±5.4vs 152.0±4.0 mmHg; p=0.001), 3rd (188.9±8.6
vs 162.4±6.0 mmHg; p=0.000) and 4th series (193.1±8.1
vs 161.6±5.9 mmHg; p=0.000). The difference between
the protocols remained statistically high in the discontinuous series protocol regarding DAP at the 3rd (103.8±4.1 vs
86.1±3.3 mmHg; p=0.000) and 4th series (104.1±2.7 vs
83.4±3.3 mmHg; p=0.000). The HR was the only variable that presented no differences between the protocols. The DP, as it calculated from the HR and SAP, was influenced by the latter and presented higher values in the discontinuous series protocol when compared to the continuous one at
the 2nd (17,907.5±1,350.7 vs 14,541.9±1,848.0 mmHg.
bpm; p=0.03), 3rd (19,687.3±1,444.3 vs 15,612.1±1,180.3
mmHg.bpm; p=0.008) and 4th series (21,271.0±1,794.2 vs
15,992.0±1,093.4 mmHg.bpm; p=0.001).
Figure 2 shows the behavior of SAP, DAP and HR in a study individual (case 3).
Discussion
The initial hypothesis of the present experiment was that the protocol with a 2-second interval between the repetitions would result in less cardiovascular demand than the continuous one. This fact is based on the possibility that, during a brief interval, a higher vascular perfusion occurs after a period of blood flow restriction caused by the exercise, in addition to starting the baroreflex response, compensating the pressure increase14. However, the 2-second interval
resulted in a higher cardiovascular response during the exercise. One possible explanation for the results observed in the present study resides in the characteristics of the exercise itself. We used the unilateral knee extension, which is initiated by the concentric phase of the movement. This characteristic requires some effort to move the load, caused by the absence of the stretching-shortening cycle, i.e., the muscle does not use the elastic energy resulting from the eccentric movement and needs to produce a higher force of contraction18,19.
Regarding the cardiovascular behavior, studies have shown that during the concentric phase of the exercise, the pressure responses tend to be higher than those observed during the eccentric phase9,20. Based on that, the interval
during the series, even if it decreased the cardiovascular responses, might have required a high degree of physical effort for the re-start of the movement. Therefore, both the degree of effort and the synergist muscle demand might have contributed to the increase in pressure responses2,5. This hypothesis is supported by the fact that the
cardiovascular responses are influenced by the motor cortex stimulus, inducing the up-regulation of the cardiovascular responses in relation to the motor units recruited during the exercise21.
Regardless of the hypotheses that were raised, it is
necessary to mention the possible limitations of the present study. The values of SAP, DAP and HR were not recorded during the 2-second interval of the discontinuous series protocol, due to the fact that the Finapres equipment eventually carries out the self-calibration, which prevents the reading of values for a short period. This occurred with some subjects during the 2-second interval and the sample would not be able to return in order to replicate the experiment. Additionally, electromyography was not used to detect the degree of muscular demand in both protocols. Moreover, it cannot be guaranteed that the Valsalva maneuver was not performed, especially in the discontinuous protocol.
However, considering the scarce amount of information on discontinuous series and strength exercises, the present investigation can be useful for the understanding of pressure behavior during high-intensity physical effort. For instance, despite the difference observed in the last series between the protocols for SAP, DAP and DP, the values measured 2 minutes after the exercise were not statistically different. Thus, regardless of the values observed, the post-effort decrease tends to be the same, probably caused by the higher vascular perfusion and baroreflex action14.
During each protocol, increases in all cardiovascular variables were observed in relation to at-rest values, with a tendency to elevation (in the continuous protocol) and significant increase (in the discontinuous protocol) from the first series to the last ones in SA, DAP and DP. These increases are due to the aforementioned mechanisms of cardiovascular adjustment, i.e., the accumulated fatigue in one series might have intervened in the pressure response increase. HR, on the other hand, showed no inter-protocol difference and little intra-protocol difference. A possible explanation is that HR is mediated by mechanisms that are similar to those of blood pressure21,22, but its behavior depends on striking increases in
muscle mass23, exercise duration24 and intensity8, which were
not the focus of the present study.
In conclusion, knee extension series, when performed discontinuously, can result in higher cardiovascular responses when compared to continuous series. However, these results must not be considered definitive and further experiments using different exercises and intensities are necessary.
Potential Conflict of Interest
No potential conflict of interest relevant to this article was reported.
Sources of Funding
This study was partially funded by CNPq.
Study Association
Fig. 2 -%HKDYLRURIV\VWROLFEORRGSUHVVXUHGLDVWROLFEORRGSUHVVXUHDQGKHDUWUDWHLQRQHVWXG\LQGLYLGXDOFDVH Rest Series 1 Series 2 Series 3 Series 4 Recovery
Heart Rate
Discontinuous series protocol Continuous series protocol
Diastolic Blood Preasure
Rest Series 1 Series 2 Series 3 Series 4 Recovery
Discontinuous series protocol Continuous series protocol
Systolic Blood Pressure
Rest Series 1 Series 2 Series 3 Series 4 Recovery
References
1. Benn SJ, McCartney N, McKelvie RS. Circulatory responses to weight lifting, walking, and stair climbing in older males. J Am Geriatr Soc. 2003; 44: 121-5.
2. MacDougall JD, Tuxen D, Sale DG, Moroz JR, Sutton JR. Arterial blood pressure response to heavy resistance exercise. J Appl Physiol. 1985; 58: 785-90.
3. Kleiner DM, Blessing DL, Mitchell JW, Davis WR. A description of the acute cardiovascular responses to isokinetic resistance at three different speeds. J Strength Cond Res. 1999; 13: 360-6.
4. Gotshall R, Gootman J, Byrnes W, Fleck S, Valovich T. Noninvasive characterization of the blood pressure response to the double-leg press exercise. JEPonline. 1999; 2: 1-6.
5. Haslam DRS, McCartney N, McKelvie RS, MacDougall JD. Direct measurements of arterial blood pressure during formal weightlifting in cardiac patients. J Cardiopulm Rehabil. 1988; 8: 213-25.
6. Overend T, Versteegh T, Thompson E, Birmingham T, Vandervoort A. Cardiovascular stress associated with concentric and eccentric isokinetic exercise in young and older adults. J Gerontol. 2000; 55: 177-82.
7. Polito MD, Simão R, Nóbrega ACL, Farinatti PTV. Pressão arterial, freqüência cardíaca e duplo-produto em séries sucessivas do exercício de força com diferentes intervalos de recuperação. Rev Port Ciênc Desporto. 2004; 4: 7-15.
8. Fleck SJ, Dean LS. Resistance-training experience and the pressor response during resistance exercise. J Appl Physiol. 1987; 63: 116-20.
9. Sale DG, Moroz DE, McKelvie RS, MacDougall JD, McCartney N. Effect of training on the blood pressure response to weight lifting. Can J Appl Physiol. 1994; 19: 60-74.
10. Williams MA, Haskell WL, Ades PA, Amsterdam EA, Bittner V, Franklin BA, et al. Resistance exercise in individuals with and without cardiovascular disease: 2007 Update. A Scientific Statement from the American Heart Association Council on Clinical Cardiology and Council on Nutrition, Physical Activity, and Metabolism. Circulation. 2007; 116: 572-84.
11. Veloso U, Monteiro W, Farinatti P. Do continuous and intermittent exercises sets induce similar cardiovascular responses in the elderly women? Braz J Sports Med. 2003; 9: 85-90.
12. Coelho CW, Hamar D, Araújo CGS. Physiological responses using 2 high-speed resistance training protocols. J Strength Cond Res. 2003; 17: 334-7.
13. Baum K, Ruther T, Essfeld D. Reduction of blood pressure response during strength training through intermittent muscle relaxations. Int J Sports Med. 2003; 24: 441-5.
14. Wiecek E, McCartney N, McKelvie R. Comparison of direct and indirect measures of systemic arterial pressure during weightlifting in coronary artery disease. Am J Cardiol. 1990; 66: 1065-9.
15. Kraemer WJ, Adams K, Cafarelli E, Dudley GA, Dooly C, Feigenbaum MS, et al. American College of Sports Medicine position stand. Progression models in resistance training for healthy adults. Med Sci Sports Exerc. 2002; 34: 364-80.
16. Polito MD, Farinatti PTV. Considerations on blood pressure assessment during resistive exercise. Braz J Sports Med. 2003; 9: 25-33.
17. Mourad A, Carney S, Gillies A, Jones B, Nanra R, Trevillian P. Arm position and blood pressure: a risk factor for hypertension? J Hum Hypertens. 2003; 17: 389-5.
18. Komi PV (ed.). Strength and power in sport. London: Blackwell; 1992. p. 169-79.
19. Fleck SJ, Kraemer WJ. Designing resistance training programs. Champaign, IL: Human Kinetics; 1997.
20. Sale DG, Moroz DE, McKelvie RS, MacDougall JD, McCartney N. Comparison of blood pressure response to isokinetic and weight-lifting exercise. Eur J Appl Physiol. 1993; 67: 115-20.
21. Mitchell JH, Schibye B, Payne FC, Saltin B. Response of arterial blood pressure to static exercise in relation to muscle mass, force development, and electromyographic activity. Circ Res. 1981; 48: 170-5.
22. Mitchell JH, Payne FC, Saltin B, Schibye B. The role of muscle mass in the cardiovascular response to static contractions. J Physiol. 1980; 309: 45-54.
23. Seals DR, Washburn RA, Hanson PG, Painter PL, Nagle FJ. Increased cardiovascular response to static contraction of larger muscle groups. J Appl Physiol. 1983; 54: 434-7.