www.atmos-chem-phys.net/11/5153/2011/ doi:10.5194/acp-11-5153-2011
© Author(s) 2011. CC Attribution 3.0 License.
Chemistry
and Physics
Sources and production of organic aerosol in Mexico City:
insights from the combination of a chemical transport model
(PMCAMx-2008) and measurements during MILAGRO
A. P. Tsimpidi1,2, V. A. Karydis1,2, M. Zavala3,4, W. Lei3,4, N. Bei4, L. Molina3,4, and S. N. Pandis1,2,5
1Institute of Chemical Engineering and High Temperature Chemical Processes, Foundation for Research and Technology Hellas, Patras, Greece
2Dept. of Chemical Engineering, University of Patras, Patras, Greece
3Department of Earth, Atmospheric and Planetary Sciences, Massachusetts Institute of Technology (MIT), USA 4Molina Center for Energy and the Environment (MCE2), USA
5Department of Chemical Engineering, Carnegie Mellon University, Pittsburgh, PA 15213, USA Received: 15 October 2010 – Published in Atmos. Chem. Phys. Discuss.: 15 November 2010 Revised: 5 May 2011 – Accepted: 9 May 2011 – Published: 1 June 2011
Abstract. Urban areas are large sources of organic aerosols and their precursors. Nevertheless, the contributions of pri-mary (POA) and secondary organic aerosol (SOA) to the ob-served particulate matter levels have been difficult to quan-tify. In this study the three-dimensional chemical transport model PMCAMx-2008 is used to investigate the temporal and geographic variability of organic aerosol in the Mex-ico City Metropolitan Area (MCMA) during the MILAGRO campaign that took place in the spring of 2006. The or-ganic module of PMCAMx-2008 includes the recently de-veloped volatility basis-set framework in which both primary and secondary organic components are assumed to be semi-volatile and photochemically reactive and are distributed in logarithmically spaced volatility bins. The MCMA emis-sion inventory is modified and the POA emisemis-sions are dis-tributed by volatility based on dilution experiments. The model predictions are compared with observations from four different types of sites, an urban (T0), a suburban (T1), a rural (T2), and an elevated site in Pico de Tres Padres (PTP). The performance of the model in reproducing or-ganic mass concentrations in these sites is encouraging. The average predicted PM1 organic aerosol (OA) concen-tration in T0, T1, and T2 is 18 µg m−3, 11.7 µg m−3, and 10.5 µg m−3respectively, while the corresponding measured values are 17.2 µg m−3, 11 µg m−3, and 9 µg m−3. The av-erage predicted locally-emitted primary OA concentrations,
Correspondence to:S. N. Pandis (spyros@chemeng.upatras.gr)
4.4 µg m−3 at T0, 1.2 µg m−3 at T1 and 1.7 µg m−3 at PTP, are in reasonably good agreement with the corresponding PMF analysis estimates based on the Aerosol Mass Spec-trometer (AMS) observations of 4.5, 1.3, and 2.9 µg m−3 re-spectively. The model reproduces reasonably well the av-erage oxygenated OA (OOA) levels in T0 (7.5 µg m−3 pre-dicted versus 7.5 µg m−3measured), in T1 (6.3 µg m−3 pre-dicted versus 4.6 µg m−3measured) and in PTP (6.6 µg m−3 predicted versus 5.9 µg m−3measured). The rest of the OA mass (6.1 µg m−3and 4.2 µg m−3in T0 and T1 respectively) is assumed to originate from biomass burning activities and is introduced to the model as part of the boundary condi-tions. Inside Mexico City (at T0), the locally-produced OA is predicted to be on average 60 % locally-emitted primary (POA), 6 % semi-volatile (S-SOA) and intermediate volatile (I-SOA) organic aerosol, and 34 % traditional SOA from the oxidation of VOCs (V-SOA). The average contributions of the OA components to the locally-produced OA for the en-tire modelling domain are predicted to be 32 % POA, 10 % S-SOA and I-S-SOA, and 58 % V-S-SOA. The long range transport from biomass burning activities and other sources in Mexico is predicted to contribute on average almost as much as the local sources during the MILAGRO period.
1 Introduction
1500 km2. The MCMA has a history of severe air quality problems due to a large number of pollution sources with un-even levels of emission control, which can be further exacer-bated by the topography and meteorology of the basin. The tropical location (19◦N) and high altitude (2200 m above sea level) result in high UV radiation fluxes and intense photo-chemistry. The basin is surrounded by mountains on three sides, reducing ventilation of pollutants, especially at night and in the early morning (Molina and Molina, 2002).
Fine particulate matter (PM) is one of the most serious air quality problems in Mexico City (Molina et al., 2007). Pollu-tion from megacities and large urban areas, such as MCMA, is important not only for its local effects on health (Pope and Dockery, 2006), visibility (Watson, 2002), and ecosys-tems/crops (Bytnerowicz and Fenn, 1996), but also because of its potential influence on regional scale atmospheric chem-istry and radiative forcing. Organic species account for a large fraction of the fine aerosol mass at most locations (Zhang et al., 2007) and are poorly understood. The MILA-GRO (Megacity Initiative: Local and Global Research Ob-servations) field campaign, which took place during March 2006, used multiple sites and mobile platforms to assess pol-lutant emissions, and evolution in and around Mexico City (http://mce2.org/mcma2006), providing a unique dataset to study the formation of organic aerosols.The MILAGRO field experiment involved more than 400 researchers from over 120 institutions in the USA, Mexico, and several other coun-tries (Molina et al., 2010). The campaign included coordi-nated aircraft and ground-based measurements supported by extensive modeling and satellite observations. Three main sites were chosen to characterize the transport and transfor-mation of the pollutants carried from the urban area of the city to its surroundings; one in the urban area of Mexico City, designated as T0 and located in Northeast Mexico City at the Instituto Mexicano del Petroleo (IMP), and the other two, T1 and T2 were located, respectively at suburban and rural locations approximately 32 km and 63 km north of IMP respectively (Molina et al., 2010).
During MILAGRO daily average PM2.5 levels varied be-tween 24–46 µg m−3 at the urban sites, 13–25 µg m−3 at the rural sites, and were around 30 µg m−3 at the industrial hotspot of Tula (Querol et al., 2008). Carbonaceous com-pounds accounted for a significant proportion of fine PM at the urban and industrial sites (around 50 %) and were markedly decreased at the suburban and rural sites (30 %) (Querol et al., 2008). DeCarlo et al. (2008) measured the concentration, size, and composition of non-refractory submicron aerosol (NR-PM1) over Mexico City and cen-tral Mexico with a High-Resolution Time-of-Flight Aerosol Mass Spectrometer (HR-ToF-AMS). OA correlated strongly with CO and HCN indicating that anthropogenic pollution and biomass burning (BB) were the main OA sources. Aiken et al. (2009) also used a HR-ToF-AMS to analyze submicron aerosols at the T0 urban site. The major components of OA were locally-emitted primary, biomass burning/woodsmoke
and secondary sources at similar magnitudes. Yu et al. (2009) used the semi-empirical EC tracer method to derive primary organic carbon (POC) and secondary organic carbon (SOC) concentrations. The majority of organic carbon particles at T1 and T2 were secondary (an average of 63±17 % and 67±12 % respectively). The geographic distribution of pho-tochemical age and CO was also examined by Kleinman et al. (2008), confirming that Mexico City is a major source re-gion for the area and that pollutants become more dilute and aged as they are advected towards T1 and T2.
Stone et al. (2008) used a chemical mass balance (CMB) model based on molecular marker species in order to deter-mine the relative contribution of major sources to ambient organic carbon (OC). Motor vehicles, including diesel and gasoline, consistently accounted for approximately 50 % of OC in the urban area and 32 % on the periphery. The daily contribution of BB to OC was highly variable, and ranged from 5–26 % at the urban site and 7–39 % at the peripheral site. The remaining OC unapportioned to primary sources showed a strong correlation with water soluble OC (WSOC) and was considered to be secondary in nature. Yokelson et al. (2007) also found high biomass burning emissions sug-gesting that the fires from forests near Mexico City could produce as much as 80–90 % of the primary fine particle mass in the Mexico City area. The 50±30 % of the “aged” fine particle mass in the March 2006 Mexico City outflow could be from these fires. Moreover, Crounse et al. (2009) found that fires contribute more than half of the organic aerosol mass and submicron aerosol scattering. DeCarlo et al. (2010) reported that during periods of high forest fire in-tensity near the basin, OA arising from open BB represents around 65 % of the OA mass in the basin and contributes similarly to OA mass in the outflow. Aiken et al. (2010) es-timated that during the low regional fire periods, 38 % of OC in the Mexico City center was from non-fossil sources, sug-gesting the importance of urban and regional non-fossil car-bon sources other than the fires, such as food cooking and regional biogenic SOA. They also showed that, by properly accounting for the non-BB sources of K, the fires from the region near the MCMA are estimated to contribute 15–23 % of the OA. Finally, De Gouw et al. (2009) investigated the di-urnal variations of hydrocarbons, elemental carbon (EC) and hydrocarbon-like organic aerosol (HOA) which were domi-nated by a high peak in the early morning. In comparison, diurnal variations of species with secondary sources such as OOA and WSOC stayed relatively high in the afternoon in-dicating strong photochemical formation.
of secondary organic aerosol (SOA) treatments. Modeled POA was consistently lower than the measured OA at the ground sites, which is consistent with the expectation that SOA should be a large fraction of the total organic matter mass. Other studies have reported large discrepancies in the measured vs. modeled OOA mass concentrations in both ur-ban and regional polluted atmospheres (Heald et al., 2005; de Gouw et al., 2005; Johnson et al., 2006; Volkamer et al., 2006; Kleinman et al., 2008). Hodzic et al. (2009) found fairly good agreement between predicted and observed POA within the city but large discrepancies were encountered for SOA, suggesting that less than 15 % of the observed SOA within the Mexico City can be explained by the oxidation of the traditional SOA precursors. These results are in agree-ment with the findings of Dzepina et al. (2009) where the traditional SOA precursors (mainly aromatics) by themselves failed to produce enough SOA to match the observations by a factor of 7. Hodzic et al. (2010) applied the CHIMERE model to estimate the potential contribution to SOA for-mation of recently identified semi-volatile and intermediate volatility organic precursors (Robinson et al., 2007) in and around Mexico City. Their results showed a substantial en-hancement in predicted SOA concentrations (2–4 times) both within and downwind of the city leading to much reduced discrepancies with the total OA measurements.
Robinson et al. (2007) proposed two major amendments to the current treatment of OA: (1) accounting for the volatility and gas particle partitioning of POA; and (2) explicit rep-resentation of gas-phase oxidation of all low-volatility va-pors in SOA production mechanisms. These amendments were implemented in a 3D-CTM, PMCAMx, resulting in the PMCAMx-2008 version (Lane et al., 2008a, b; Shrivastava et al., 2008; Murphy and Pandis, 2009). Tsimpidi et al. (2010) applied PMCAMx-2008 in MCMA during the MCMA-2003 campaign (Molina et al., 2007), reducing significantly the discrepancies between the measured and the modeled OOA. However, that study was limited by the availability of organic aerosol measurements in only one site.
The current study is based on the insights of the work of Tsimpidi et al. (2010) and its goal is to assess further the tem-poral and geographic variability of organic mass compounds during the 2006 MILAGRO campaign using PMCAMx-2008. The geographic variability of the OA concentration is evaluated by comparing the model predictions against mea-surements taken at an urban site in Mexico City, two periph-eral sites located on the outskirts of the metropolitan area, and an elevated site located at Pico de Tres Padres (PTP). This study aims to improve our understanding of the forma-tion pathways of organic aerosol in Mexico City.
2 Model description
PMCAMx-2008 simulates advection, dispersion, gas-phase chemistry, emission, wet/dry deposition, aerosol dynamics
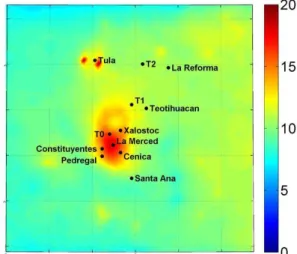
Fig. 1. The modeling domain for the Mexico City Metropolitan Area during the MILAGRO campaign. Also shown, the locations of the monitoring stations during the campaign.
the model, apart from the locally-emitted primary organic aerosols (POA), simulates three types of oxygenated organic aerosols based on the initial volatility of the corresponding precursor compounds: S-SOA (C∗≤ 102µg m−3), I-SOA (103≤C∗≤106µg m−3), and V-SOA (C∗>106µg m−3). A more comprehensive description of the organic aerosol mod-ule used by PMCAMx-2008 can be found in Tsimpidi et al. (2010), Murphy and Pandis (2009), Lane et al. (2008a, b), and Shrivastava et al. (2008).
3 Model application
This study uses PMCAMx-2008 to simulate March 2006 for the Mexico City Metropolitan Area. The first three days of the simulation are used for initialization and are not included in the results presented here. The modeling domain covers a 210×210 km region in the Mexico City Metropolitan Area with 3×3 km grid resolution and fifteen vertical layers total-ing 6 km (Fig. 1). This is a much larger domain than that used by Tsimpidi et al. (2010) and includes the industrial area of Tula to the north of Mexico City (Song et al., 2010). Inputs to the model include horizontal wind components, tempera-ture, pressure, water vapor, vertical diffusivity, clouds, and rainfall; all created using the Weather Research and Forecast (WRF) model.
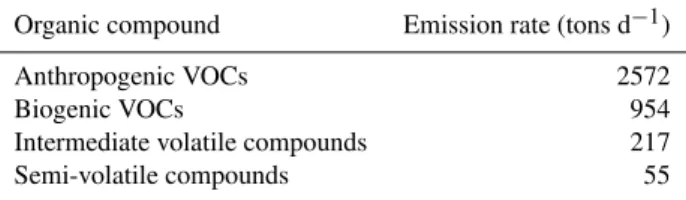
Table 1. Organic compound emission rates (tons d−1)over the modeling domain.
Organic compound Emission rate (tons d−1)
Anthropogenic VOCs 2572
Biogenic VOCs 954
Intermediate volatile compounds 217
Semi-volatile compounds 55
3.1 Emission inventory
The emission inventory has been updated in order to include the anthropogenic emissions from the refinery, power plant and chemical companies in the Tula area located north of Mexico City (Fig. 1), the biogenic emissions from the forests located on the northeast part of the model domain, and a semi-empirical HONO “source” (0.8 % of the NOxemissions based on Aumont et al. (2003) and Li et al. (2010)). In order to account for partitioning of primary organic emissions, the emission inventory was modified following the recommen-dations of Tsimpidi et al. (2010). Table 1 shows the amount of the emitted organic material within the limits of the mod-eling domain. Anthropogenic and biogenic VOC emissions serve as anthropogenic and biogenic V-SOA precursors re-spectively. Semivolatile (SVOC; 10−2≤C∗≤102µg m−3) primary organic emissions partition between the aerosol and the gas phase. The material that remains in the aerosol phase is locally-emitted POA while the gas phase material, which is subsequently oxidized by OH, is considered as S-SOA pre-cursor. Intermediate-volatility (IVOC; 103µg m−3≤ C∗≤
3.2 Boundary conditions
The values of the OA concentrations at the boundaries of the domain, approximately 8 µg m−3in the west, 11.5 µg m−3in the east, 7 µg m−3 in the south and 5 µg m−3 in the north-ern boundary, were chosen based on results of the GISS-II’ global CTM for March (Racherla and Adams, 2006). All concentrations in this paper are under ambient pressure and temperature conditions. These levels represent the av-erage OA concentrations over the Central Mexican Plateau approximately 100 km outside Mexico City and should not be confused with the larger-scale background concentrations of Mexico (reflecting concentrations over the lower to mid-dle troposphere over the Pacific Ocean) of much less than 0.5 µg m−3 (DeCarlo et al., 2008; Fast et al., 2009). 32 % of the OA concentration at the boundaries of the domain is assumed to be 0.04–0.08 µm in size, 24 % is the 0.08– 0.16 µm range, 20 % from 0.16 to 0.31 µm, 12 % from 0.31 to 0.625 µm, 8 % from 0.625 to 1.25 µm, and 4 % in the 1.25– 2.5 µm range. Because the biomass burning emissions are not included in the current inventory, they are implicitly provided to the model as a part of the boundary conditions. These rel-atively high boundary condition values are consistent with the findings of Yokelson et al. (2007) suggesting that the fires in the mountainous forests around Mexico City (MC) could produce as much as 80–90 % of the primary fine parti-cle mass in the MC area. DeCarlo et al. (2010) reported that OA arising from open BB represents around 65 % of the OA mass in the basin and contributes similarly to OA mass in the outflow. Crounse et al. (2009) estimated that biomass burn-ing contributed two thirds of the organic aerosol to the study area in March 2006. Subsequent atmospheric oxidation of co-emitted hydrocarbons can yield low vapor pressure com-pounds that condense on the existing particulate forming sec-ondary organic aerosol. Therefore, the organic mass trans-ported into the domain is assumed to be a mixture of aged pri-mary and secondary organic aerosols, and is referred to here-after as “long range transport oxygenated OA” (LT-OOA). The model assumes that V-SOA, I-SOA and S-SOA form a pseudo-ideal solution together with the LT-OOA, which are assumed to be non-reactive and nonvolatile, and therefore, are allowed to partition into this pre-existing organic aerosol.
3.3 Ground observations
To evaluate the model results for the OA components within the city basin during March 2006 we used AMS measure-ments of submicron aerosols collected at two supersites at the Instituto Mexicano del Petroleo (designed as T0) and Universidad Tecnologica de Tecamac (T1). The T0 monitor-ing station was located to the northwestern part of the basin of Mexico City. It is an urban background site influenced by road traffic emissions (300 m from four major roads sur-rounding it), domestic and residential emissions, but also po-tentially influenced by local industrial emissions and from
Fig. 2. Predicted average ground level concentrations of PM1 or-ganic mass (µg m−3)during 4–30 March 2006.
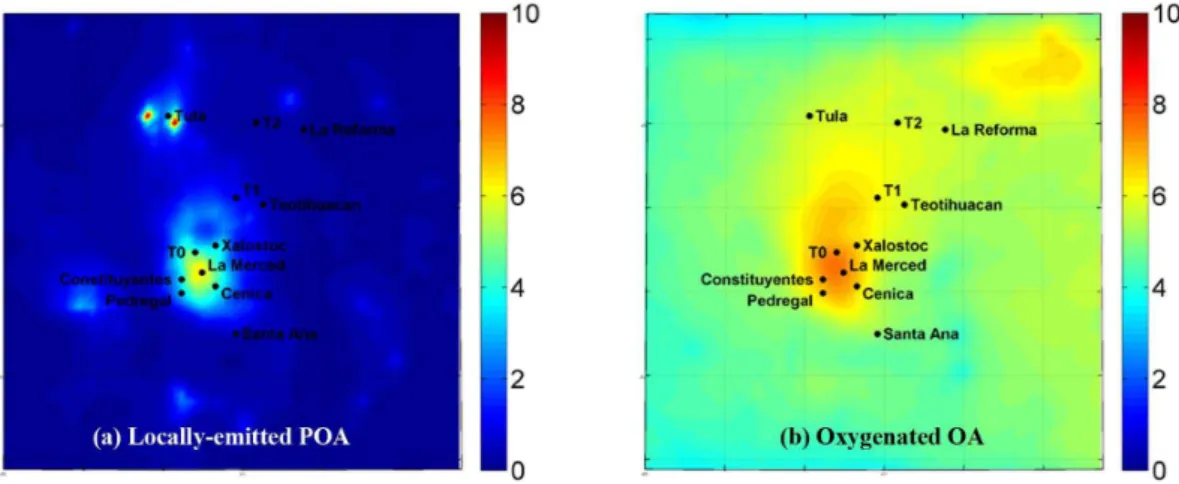
Fig. 3.Average predicted PM1(a)primary and(b)oxygenated organic aerosol concentrations (µg m−3)at the ground level.
4 Overview of model predictions
The predicted average ground-level concentration of PM1 or-ganic mass over the period of March 2006 is shown in Fig. 2. The organic mass peak values (approximately 20 µg m−3) are in the center of Mexico City and in the Tula industrial area. The predicted organic mass concentration is the sum of the predicted concentration of primary organic aerosols which have been emitted in the atmosphere as particles (locally-emitted POA) (Fig. 3a) and the predicted concen-trations of the oxygenated organic aerosol (Fig. 3b) that has been created in the atmosphere through chemical reactions and corresponds to the sum of PMCAMx-2008 S-SOA, I-SOA, V-I-SOA, and LT-OOA. The primary organic aerosol concentration is high in the center of Mexico City and in Tula, while it decreases rapidly from its sources mainly due to dilution and evaporation. As an example in the T0 urban site the predicted average locally-emitted primary organic concentration is 4.4 µg m−3 while in the T1 suburban site it decreases to 1.2 µg m−3 and in the T2 rural site is lower than 1 µg m−3. These results are consistent with the find-ings of Querol et al. (2008) where carbonaceous compounds accounted for a significant proportion of fine PM at the ur-ban and industrial sites (around 50 %) and were markedly decreased at the suburban and rural sites (30 %). On the con-trary, the predicted oxygenated organic aerosol concentration has a relatively more uniform spatial distribution with high values in the entire domain (Fig. 3b). The highest values are predicted in the center of Mexico City (up to 7.5 µg m−3), coming mainly from anthropogenic sources, and in the north-east corner of the domain, mainly from biogenic sources. In the suburban and rural areas, such as T1 and T2, the predicted oxygenated OA is also high, with concentrations around 6 µg m−3. Anthropogenic V-SOA, I-SOA, and S-SOA, are predicted to be more photochemically processed and less volatile downwind of the Mexico City center. In particular at T0 locally-produced OA consists of 60 % POA and 40 %
OOA. At T1 and T2, OOA corresponds to 60 % and 85 % of locally-produced OA respectively. The domain-average con-tribution of OOA to locally-produced OA is 68 %. Obser-vational studies during the MILAGRO campaign also sup-port the predicted spatial distribution of OOA. DeCarlo et al. (2008) calculated the O/C atomic ratio for OA and found a clear increase with photochemical age. Yu et al. (2009) found that the majority of organic carbon particles at T1 and T2 were secondary (an average of 63±17 % and 67±12 % respectively). The geographic distribution of photochemical age and CO was also examined by Kleinman et al. (2008), confirming that Mexico City is a major source region for the area and that pollutants become more dilute and aged as they are advected towards T1 and T2. Finally, V-SOA is predicted to be the dominant component of OOA (accounting for 84 % of the locally produced OOA) as the emission rate of its pre-cursors (anthropogenic and biogenic VOCs) is more than ten times higher than the I-VOC and S-VOC emission rate (Ta-ble 1). I-SOA concentration (3 % of OOA) is lower than the S-SOA (13 % of OOA) as the saturation concentration of its precursors is between 103and 106µg m−3and requires a few generations of aging before its volatility is reduced enough to allow its partitioning into the particulate phase.
5 Model performance evaluation
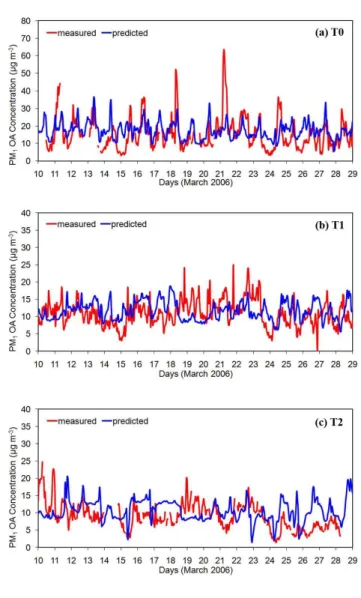
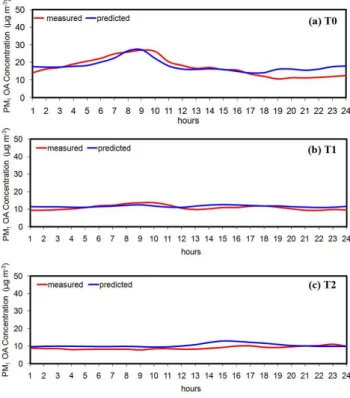
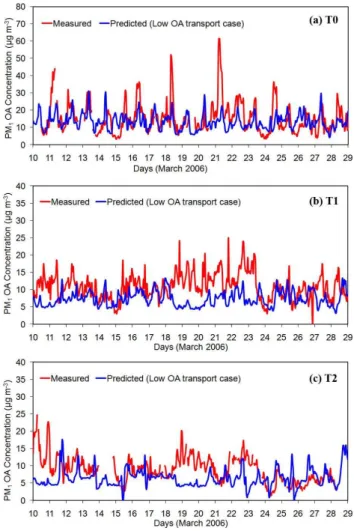
Fig. 4.Comparison of model predictions with hourly measurements for total PM1organic mass concentration taken during the MILA-GRO campaign in March 2006 at(a)T0 (urban site),(b)T1 (sub-urban site), and(c)T2 (rural site).
biomass burning emissions. These emissions are provided to the model through the boundary conditions which are time-independent. Both measurements and predictions though, suggest that organic mass has a high variation during the day. Organic mass concentrations are almost always higher than 10 µg m−3, while during morning hours often exceed 25 µg m−3. Furthermore, the average predicted PM
1OA con-centration in PTP, which is located 10 km northeast of T0, is 13.6 µg m−3 while the corresponding measured value is 10 µg m−3. Overall, the OA predictions at T0 are within 50 % of the measurements for 57 % of the data points and within 30 % for 41 % of the time (Fig. 5).
In T1, which is a suburban site, the variation of organic mass concentrations is smaller than and not as regular as in T0 (Fig. 4b). Most of this mass is coming from other areas and therefore depends mostly on the weather conditions. The
Fig. 5.Comparison of predicted hourly average OA concentrations against observational data from T0, T1, and T2 measurement sites. Also shown are the 1:1,±30 %, and±50 % lines.
model is able to reproduce the measured values within a few µg m−3 most of the time with concentrations ranging from 7 to 20 µg m−3. Nevertheless PMCAMx-2008 underpredicts the organic mass during the period from the 18th to the 20th of the month. These are the days with the most favorable wind directions for T0-T1-T2 transport (Fast et al., 2007). The analysis of the measurements suggests that the organic mass produced in Mexico City center during the morning of 18th was transported to the north and appeared in T1 dur-ing the afternoon of the same day. On the other hand, the predictions in T1 show a reduction in organic mass during that day indicating inaccuracies by the meteorological simu-lations during this period. Errors in these inputs to PMCAMx result in corresponding problems in its predictions. Overall, the OA predictions at T1 are within 50 % of the measure-ments for 82 % of the data points and within 30 % for 51 % of the time (Fig. 5).
Fig. 6. Fractional contribution of locally-produced biogenic SOA to total OA at the ground level.
conditions are time-independent, the model cannot predict the hourly variations caused from sources north of the T2 site. Overall, the OA predictions at T2 are within 50 % of the measurements for 64 % of the data points and within 30 % for 37 % of the time (Fig. 5).
The biogenic V-SOA PMCAMx predictions tend to be a little lower than the Stone et al. (2010) measurement-based estimates of biogenic SOA at T0 and T1. The simulated bio-genic V-SOA concentrations range from 0.1 to 1.1 µg m−3 at T0 and from 0.1 to 1.4 µg m−3at T1. The measurement-based estimates range from 0.4 to 1.8 µg m−3at T0 and from 0.4 to 2.2 µg m−3 at T1. Some of the difference could be explained by biogenic SOA transported into the domain by elsewhere and not resolved by the model. These results suggest that biogenic SOA levels in the Mexico City region are far from negligible. In particular, the relative contribu-tion of locally-produced biogenic V-SOA to total OA is pre-dicted to be up to 15 % north of Mexico City (Fig. 6). The PMCAMx-predicted contribution of locally-produced bio-genic V-SOA to locally-produced total SOA (sum of V-SOA, I-SOA, and S-SOA) is 20–30 % within the city and up to 70 % at the surrounding areas. Hodzic et al. (2009) estimated the relative contribution of biogenic SOA to the predicted monthly levels of SOA, to be more than 30 % at the city cen-ter and up to 65 % at the regional scale.
5.1 Diurnal average profiles
The predicted and measured diurnal average OA concentra-tion profiles at T0, T1, and T2 sites during MILAGRO are de-picted in Fig. 7. These averages depend less on the day to day variability of the meteorology and the emissions and more on the major processes affecting the OA concentrations. In all cases, the model predictions are in agreement within exper-imental error with the measurements. The diurnal profile at the urban site T0 (Fig. 7a) has two peaks; the major one
dur-Fig. 7.Comparison of model diurnal predictions with hourly mea-surements for total PM1 organic aerosols against measurements taken during the MILAGRO campaign in March 2006 at(a)T0 (ur-ban site),(b)T1 (suburban site), and(c)T2 (rural site).
ing morning, related to the primary emissions, and a second less pronounced peak in the afternoon, mainly due to pho-tochemical processes. The same peaks appear in the diurnal profile of OA at the suburban site T1 (Fig. 7b), the levels of which are smaller compared to those in the T0 site. The first peak is related to the local sources while the peak in the after-noon is caused by the OA which was transported there from the urban center and the local photochemistry. Finally, both the measured and the predicted organic mass at the rural site T2 (Fig. 7c), increase slightly late in the afternoon mainly due to transport of emissions and also photochemistry. As expected, there is no morning peak, given the absence of lo-cal sources in the area around and immediately upwind of T2.
5.2 Comparison with PMF analysis
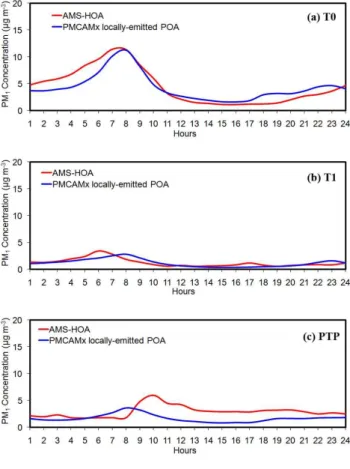
HOA appears to have the AMS mass spectral fingerprint for primary combustion particles from urban sources, and also includes particles from other relatively reduced sources such as meat cooking and trash (plastic) burning (Mohr et al., 2009). Therefore the AMS locally-emitted HOA can be compared with the PMCAMx-2008 POA which is the fraction of the emissions that is in the aerosol phase with-out having undergone any chemical reactions (Fig. 8). At T0, PMCAMx-2008 successfully reproduces the observed HOA variation characterized by an early morning peak as-sociated with traffic (Fig. 8a). These results are in accor-dance with the findings of De Gouw et al. (2009) who in-vestigated the diurnal variation of hydrocarbons, elemental carbon (EC) and hydrocarbon-like organic aerosol (HOA) which were also dominated by a high peak in the early morn-ing. Both, the average predicted POA concentration and the AMS-HOA concentration during March 2006 at T0 are close to 4.5 µg m−3. The agreement is still reasonable at T1 where the average POA and AMS-HOA concentrations are approx-imately 1.3 µg m−3. However the predicted morning POA peaks 2 h later than observed (Fig. 8b). At PTP, larger dis-crepancies between observed and modeled POA values are found. The average predicted POA concentration during March 2006 is 1.7 µg m−3while the PMF analysis resulted in 2.9 µg m−3 HOA during the same period. The predicted morning POA peaks 2 h earlier than observed (Fig. 7c). The late arrival of the measured pollutants over the elevated PTP site is associated with the growth of the PBL above 900 m (station’s altitude). Therefore, this discrepancy suggests po-tential problems in describing the vertical mixing in the com-plex terrain around PTP in the early morning hours.
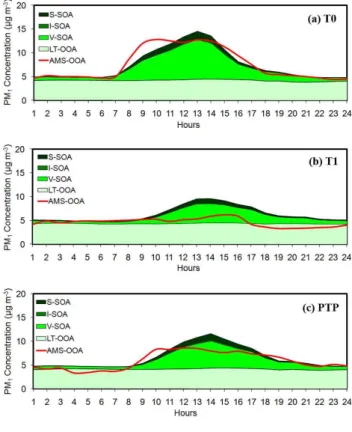
OOA often contains a more volatile and less processed oxygenated OA fraction which shows high correlation with photochemical products such as O3, Ox, glyoxal, and am-monium nitrate (Volkamer et al., 2006, 2007; Aiken et al., 2008; Lanz et al., 2007; Ulbrich et al., 2009; Dzepina et al., 2009). However, a significant fraction of the OOA con-sists of more oxygenated organics (Aiken et al., 2008) which are assumed here to have initially formed far from Mexico City. Therefore, the AMS OOA is compared with the sum of the PMCAMx-2008 S-SOA, I-SOA, V-SOA, and LT-OOA. Figure 9 presents the comparison of average diurnal pro-files of predicted oxygenated organic components and the PMF-estimated OOA at the 3 locations, T0, T1 and PTP. The shape of the OOA diurnal profile features a strong en-hancement in concentrations during the morning, associated with an active photochemical production of oxygenated or-ganic aerosols close to the emissions (i.e. T0, PTP), and high concentrations until afternoon. In comparison, De Gouw et al. (2009) also found that species with secondary sources such as OOA and WSOC stayed relatively high in the af-ternoon indicating strong photochemical formation. The di-urnal variability is less pronounced at the peripheral T1 sta-tion and displays a more gradual increase of concentrasta-tions during the day. Figure 9 confirms that the predicted
oxy-Fig. 8. Comparison of model episode average diurnal predictions for PM1 locally-emitted primary organic aerosols against AMS-HOA taken during the MILAGRO campaign in 4–30 of March 2006 at(a)T0,(b)T1 and(c)PTP.
Fig. 9. Comparison of model episode average diurnal predictions for PM1oxygenated organic aerosols (sum of LT-OOA, V-SOA, I-SOA, and S-SOA) against AMS-OOA taken during the MILAGRO campaign in 4–30 March 2006 at(a)T0,(b)T1 and(c)PTP.
Overall, the predicted chemical composition of OA is gen-erally consistent with the PMF analysis results. However, PMCAMx-2008 tends to predict higher oxygenated OA than the PMF analysis. Given that the AMS PMF results are also subject to error this comparison of the predictions of these two methods is quite encouraging. Future simulations though, should use a larger domain along with an accurate biomass burning emission inventory in order to increase the precision not only of the estimated BBOA but also of the SOA produced from fire emitted VOCs, I-VOCs, and S-VOCs. Moreover, this study does not estimate explicitly the formation of SOA from very volatile precursors such as gly-oxal (Volkamer et al., 2007; Ng et al., 2008). Finally, aque-ous phase reactions in clouds (Warneck, 2003; Lim et al., 2005; Liu et al., 2009) and the oligomerization processes of particle-phase semivolatile material (Jang et al., 2002; Kalberer et al., 2004; Iinuma et al., 2004) that can lead to continued SOA growth are also not taken into account. There are several potential explanations for this result. The first is that these formation pathways were not major OA sources during the study period. The second is that their effects are indirectly included in our parameterization of the pro-duction of SOA and its subsequent aging. The third one is that other sources are overestimated in the model (especially
Fig. 10.Predicted increase in ground-level concentrations (µg m−3) of the PM1POA after using a lower volatility distribution of OA primary emissions.
the boundary conditions). There is a good chance that all of them are at least partially true. Cloud processes proba-bly had a small effect on locally produced OA because both of the low cloud cover during the study and the spatial and temporal scales involved in this process for an urban area. Clouds could have been involved of course in the formation of OA transported into the city from outside the modeling domain. The role of glyoxal and methylglyoxal in OA pro-duction in this episode has been recently investigated by Li et al. (2011). They reported a relatively small contribution (10 % of the SOA inside the city and 4 % outside) which would not affect our results significantly. We believe that the oligomerization effects are probably indirectly included in our aging mechanism.
6 Sensitivity analysis
Fig. 11. Predicted increase in ground-level concentrations (µg m−3)of the PM1 OOA after using a rate constant equal to k(298 K) = 10×10−11cm3molec−1s−1for S-SOA, I-SOA and V-SOA aging reactions.
These discrepancies between the two simulations indicate that the assumed volatility distribution of the emissions has a significant impact on the predicted POA concentrations. Using the low volatility distribution, the model significantly overpredicts the HOA concentrations at T0 and T1, indicat-ing that the base case distribution is more appropriate for the description of the primary organic aerosols in the Mexico City Basin.
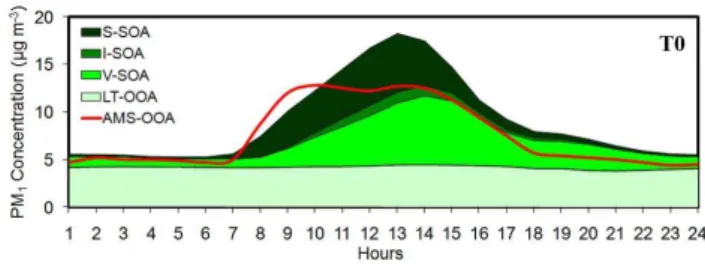
The sensitivity of the predicted OOA to the aging reaction constant was investigated by using a rate constant equal to k(298 K) = 10×10−11cm3molec−1s−1 for S-SOA, I-SOA and V-SOA. The higher oxidation constant used resulted in higher OOA concentrations by 20 % in Mexico City and Tula vicinity (Fig. 11). At T0, OOA increased from 7.5 µg m−3to 9.1 µg m−3resulting in an overprediction of OOA, compared to PMF analysis results, during the afternoon (Fig. 12). This increase is due more to increased S-SOA and I-SOA levels (three times higher concentrations than the base case) and less at V-SOA (increased by 10 %). At T0, the fraction of bio-genic to total locally-produced V-SOA is approximately 20– 30 %. Therefore this small increase on V-SOA concentration is attributed more to the low sensitivity of V-SOA to the aging rate than to the levels of the biogenic V-SOA in the domain. Moreover, this result suggests that the potential of the I-VOC and S-VOC to form SOA is high and the rate constant of their photochemical aging is quite important. Nevertheless, the S-SOA and I-S-SOA are only a small portion of the predicted locally-produced OA (5–10 %) in MCMA. Therefore, even if their concentration tripled after using the higher oxidation constant, the locally-produced OA increased by 15 % at T0.
To examine the effect of the HONO emissions used in this application (as discussed in Sect. 3) on the predicted OOA, a simulation excluding these emissions was conducted. The results of this sensitivity analyses indicate that the inclusion of HONO to the emissions inventory is indirectly
responsi-Fig. 12. Comparison of model episode average diurnal predictions in high aging reaction case for PM1 oxygenated organic aerosols (sum of LT-OOA, V-SOA, I-SOA, and S-SOA) against AMS-OOA taken during the MILAGRO campaign in 4–30 March 2006 at T0.
Fig. 13. Comparison of model episode average diurnal predictions for PM1oxygenated organic aerosols at T0 using an emission inven-tory with HONO emissions (red line) and without HONO emissions (blue line).
ble for 3 % and 10 % of the predicted OOA in the Mexico City center and the Tula area respectively. Nevertheless, the HONO emissions and formation appeared to be relatively important for the early morning production of the OOA in the center of Mexico City as it photodissociates upon sunrise to inject a pulse of OH into the early morning atmosphere. At T0, the model, taking into account the HONO emissions, predicts that the formation of OOA starts to be significant at 7 a.m., while excluding these emissions, the formation of OOA is delayed for one hour and starts at 8 a.m. (Fig. 13). The increase of the predicted OOA during 7 a.m. to 12 p.m. after the inclusion of HONO to the emission inventory is 25 % on average at T0.
Fig. 14.Comparison of model predictions in the low boundary con-ditions case with hourly measurements for total PM1organic mass concentration taken during the MILAGRO campaign in March 2006 at(a)T0 (urban site),(b)T1 (suburban site), and(c)T2 (rural site) on ground level.
underpredict the observed OA on 18–21 March in all three sites, while the agreement improves for 24–29 March. Dur-ing the first period, high biomass activities were observed, while during the latter, the fire emissions were the lowest of the month. Therefore, each set of boundary conditions performs better in different time periods, and an accurate biomass burning emission inventory is necessary, or at least, the boundary conditions should be variable in time. Over-all, the model using the base case boundary conditions set has a better performance in all three measurement sites than using the lower boundary conditions set. In particular, the base case set results in an overprediction of OM with mean bias 1.9 µg m−3, 0.8 µg m−3, and 1.5 µg m−3at T0, T1, and T2 sites respectively. On the other hand, the lower bound-ary conditions set underpredicts the OM with mean bias −2.3 µg m−3,−3.5 µg m−3, and−2.7 µg m−3at T0, T1, and T2 sites respectively.
7 Conclusions
In this work PMCAMx-2008, which accounts for volatil-ity partitioning and aging of primary and secondary organic aerosols, was applied in the Mexico City Metropolitan Area during the MILAGRO-2006 campaign. The model perfor-mance was evaluated against measurements from four differ-ent types of sites, an urban site (T0), a suburban site (T1), a rural site (T2), and an elevated site (PTP). The model predic-tions are compared with PMF analysis of AMS observapredic-tions taken at T0, T1, and PTP sites and with hourly measurements taken at T0, T1, and T2 sites during the MILAGRO 2006 campaign.
The highest concentration of OM is predicted to be in Mexico City urban center and in the Tula area (approxi-mately 20 µg m−3). The OA concentration decreases with distance from its source areas due to dilution and evapo-ration. At T0, total OA consists of 4.4 µg m−3 POA and 7.5 µg m−3 OOA while at T1 the contribution of POA and OOA to total OA is 1.2 µg m−3and 6.3 µg m−3respectively. The rest of the OA mass (6.1 µg m−3and 4.2 µg m−3in T0 and T1 respectively) is assumed to originate from biomass burning activities. High oxygenated OA concentrations are predicted for a significant part of the domain. In partic-ular at T0 produced OA consists of 60 % locally-emitted POA and 40 % locally-produced OOA. At T1 and T2, OOA corresponds to 60 % and 85 % of locally-produced OA respectively. The domain-average contribution of OOA to locally-produced OA is 68 %. The highest OOA val-ues are predicted in and around Mexico City center (anthro-pogenic sources) and in the northeast of the domain (biogenic sources). V-SOA is predicted to be the dominant compo-nent of OOA (accounting for 84 % of the locally-produced OOA) following by S-SOA (13 % of OOA) and I-SOA (3 % of OOA).
can also introduce errors on the predicted organic mass at the urban center and at areas close to the boundaries respec-tively. Despite that, the predicted chemical composition of OA is generally consistent with the PMF analysis results sug-gesting that the depiction in the model of the corresponding processes is not inconsistent with the observations.
Overall, 65 % of the emitted POA is coming from mo-bile diesel sources with the rest coming from momo-bile gaso-line (15 %), area (10 %), and point (10 %) sources, indicat-ing that the modeled primary organic mass is dominated by mobile sources. Anthropogenic SOA is dominated by area and mobile gasoline sources. Aromatic VOC emissions con-sist of 48 % vehicle exhaust (35 % gasoline and 13 % diesel), 40 % area, and 12 % point emission sources. Nevertheless, PMCAMx-2008 predicts that the background concentration of OA is a significant fraction of the total OA in Mexico City center. In particular, only approximately half of the average OA consists of locally-emitted POA and locally-produced SOA, while the rest is coming mainly from the forest fires in the surrounding area either in the form of SOA or in the form of biomass burning OA. These results are also in agreement with the findings of Crounse et al. (2009) who estimated that biomass burning contributes 66 % of the organic aerosol to the study area in March 2006. However, in this study the in-fluence of biomass burning was only introduced by boundary conditions rather than by an explicitly treatment of biomass burning emissions. Given that these contributions are highly time-dependent on a day-by-day basis, this issue should be further investigated with more detail in future applications. Moreover, biogenic emissions also have a significant con-tribution to locally-produced total SOA (up to 70 %) and to total OA (up to 15 %). Even in the center of Mexico City, the predicted contribution of locally-produced biogenic SOA to locally-produced total SOA is approximately 20–30 %. The predictions of PMCAMx-2008 for biogenic SOA are lower than the results of Hodzic et al. (2009) who predicted that the relative contribution of biogenic SOA to total SOA in the city center is up to 40 %. This could be due to the lower pre-dicted anthropogenic SOA concentrations in that modeling study.
The distribution of OA emissions to the low volatility bins appears to be important for the predicted POA as it has great impact to the initial partitioning between the aerosol and the gas phase. Increasing the aging reaction constant by one or-der of magnitude resulted in 20 % higher OOA concentra-tions. Finally, including HONO emissions to the inventory used by the model, appear to be important for the produc-tion of OOA during the early morning hours, resulting in an increase of 25 % during morning.
Acknowledgements. The authors thank Jihee Song for assistance
with the MEGAN biogenic emissions estimates and Guohui Li for valuable comments. This research was supported by the European Union and the 7th Framework Programme under the project MEGAPOLI (Grant agreement no.: 212520) and NSF ATM 0732598. A. P. Tsimpidi, V. A. Karydis, and M. Zavala were
supported by scholarships from the Molina Center for Energy and the Environment. L. T. Molina acknowledges support from NSF ATM 0528227 and ATM 0810931.
Edited by: U. P¨oschl
References
Aiken, A. C. , Decarlo, P. F., Kroll, J. H., Worsnop, D. R., Huff-man, J. A., Docherty, K. S., Ulbrich, I. M., Mohr, C., Kimmel, J. R., Sueper, D., Sun, Y., Zhang, Q., Trimborn, A., Northway, M., Ziemann, P. J., Canagaratna, M. R., Onasch, T. B., Alfarra, M. R., Prevot, A. S. H., Dommen, J., Duplissy, J., Metzger, A., Baltensperger, U., and Jimenez, J. L.: O/C and OM/OC Ratios of primary, secondary, and ambient organic aerosols with high res-olution time-of-flight aerosol mass spectrometry, Environ. Sci. Technol., 42, 4478–4485, 2008.
Aiken, A. C., Salcedo, D., Cubison, M. J., Huffman, J. A., DeCarlo, P. F., Ulbrich, I. M., Docherty, K. S., Sueper, D., Kimmel, J. R., Worsnop, D. R., Trimborn, A., Northway, M., Stone, E. A., Schauer, J. J., Volkamer, R. M., Fortner, E., de Foy, B., Wang, J., Laskin, A., Shutthanandan, V., Zheng, J., Zhang, R., Gaffney, J., Marley, N. A., Paredes-Miranda, G., Arnott, W. P., Molina, L. T., Sosa, G., and Jimenez, J. L.: Mexico City aerosol analysis during MILAGRO using high resolution aerosol mass spectrometry at the urban supersite (T0) – Part 1: Fine particle composition and organic source apportionment, Atmos. Chem. Phys., 9, 6633– 6653, doi:10.5194/acp-9-6633-2009, 2009.
Aiken, A. C., de Foy, B., Wiedinmyer, C., DeCarlo, P. F., Ul-brich, I. M., Wehrli, M. N., Szidat, S., Prevot, A. S. H., Noda, J., Wacker, L., Volkamer, R., Fortner, E., Wang, J., Laskin, A., Shutthanandan, V., Zheng, J., Zhang, R., Paredes-Miranda, G., Arnott, W. P., Molina, L. T., Sosa, G., Querol, X., and Jimenez, J. L.: Mexico city aerosol analysis during MILAGRO using high resolution aerosol mass spectrometry at the urban supersite (T0) – Part 2: Analysis of the biomass burning contribution and the non-fossil carbon fraction, Atmos. Chem. Phys., 10, 5315–5341, doi:10.5194/acp-10-5315-2010, 2010.
Aumont, B., Chervier, F., and Laval, S,: Contribution of HONO sources to the NOx/HOx/O3chemistry in the polluted boundary layer, Atmos. Environ., 37, 487–498, 2003.
Bytnerowicz, A. and Fenn, M. E.: Nitrogen deposition in California forests: A review, Environ. Pol., 92, 127–146, 1996.
Carter, W. P. L.: Programs and Files Implementing the SAPRC-99 Mechanism and its Associates Emissions Processing Proce-dures for Models-3 and Other Regional Models: http://pah.cert. ucr.edu/ carter/SAPRC99.htm, last access: 31 January 2000. Crounse, J. D., DeCarlo, P. F., Blake, D. R., Emmons, L. K.,
Cam-pos, T. L., Apel, E. C., Clarke, A. D., Weinheimer, A. J., Mc-Cabe, D. C., Yokelson, R. J., Jimenez, J. L., and Wennberg, P. O.: Biomass burning and urban air pollution over the Cen-tral Mexican Plateau, Atmos. Chem. Phys., 9, 4929–4944, doi:10.5194/acp-9-4929-2009, 2009.
campaign, Atmos. Chem. Phys., 8, 4027–4048, doi:10.5194/acp-8-4027-2008, 2008.
DeCarlo, P. F., Ulbrich, I. M., Crounse, J., de Foy, B., Dunlea, E. J., Aiken, A. C., Knapp, D., Weinheimer, A. J., Campos, T., Wennberg, P. O., and Jimenez, J. L.: Investigation of the sources and processing of organic aerosol over the Central Mex-ican Plateau from aircraft measurements during MILAGRO, At-mos. Chem. Phys., 10, 5257–5280, doi:10.5194/acp-10-5257-2010, 2010.
de Gouw, J. A., Middlebrook, A. M., Warneke, C., Goldan, P. D., Kuster, W. C., Roberts, J. M., Fehsenfeld, F. C., Worsnop, D. R., Canagaratna, M. R., Pszenny, A. A. P., Keene, W. C., Marchewka, M., Bertman, S. B., and Bates, T. S.: Budget of or-ganic carbon in a polluted atmosphere: Results from the New England Air Quality Study in 2002, J. Geophys. Res., 110, D16305, doi:10.1029/2004JD004662, 2005.
de Gouw, J. A., Welsh-Bon, D., Warneke, C., Kuster, W. C., Alexan-der, L., Baker, A. K., Beyersdorf, A. J., Blake, D. R., Cana-garatna, M., Celada, A. T., Huey, L. G., Junkermann, W., Onasch, T. B., Salcido, A., Sjostedt, S. J., Sullivan, A. P., Tanner, D. J., Vargas, O., Weber, R. J., Worsnop, D. R., Yu, X. Y., and Zaveri, R.: Emission and chemistry of organic carbon in the gas and aerosol phase at a sub-urban site near Mexico City in March 2006 during the MILAGRO study, Atmos. Chem. Phys., 9, 3425–3442, doi:10.5194/acp-9-3425-2009, 2009.
Dzepina, K., Volkamer, R. M., Madronich, S., Tulet, P., Ulbrich, I. M., Zhang, Q., Cappa, C. D., Ziemann, P. J., and Jimenez, J. L.: Evaluation of recently-proposed secondary organic aerosol models for a case study in Mexico City, Atmos. Chem. Phys., 9, 5681–5709, doi:10.5194/acp-9-5681-2009, 2009.
Doran, J. C., Barnard, J. C., Arnott, W. P., Cary, R., Coulter, R., Fast, J. D., Kassianov, E. I., Kleinman, L., Laulainen, N. S., Martin, T., Paredes-Miranda, G., Pekour, M. S., Shaw, W. J., Smith, D. F., Springston, S. R., and Yu, X.-Y.: The T1-T2 study: evolution of aerosol properties downwind of Mexico City, At-mos. Chem. Phys., 7, 1585–1598, doi:10.5194/acp-7-1585-2007, 2007.
Drewnick, F., Hings, S. S., DeCarlo, P., Jayne, J. T., Gonin, M., Fuhrer, K., Weimer, S., Jimenez, J. L., Demerjian, K. L., Borrmann, S., and Worsnop, D. R.: A new time-of-flight aerosol mass spectrometer (TOF-AMS) – Instrument description and first field deployment, Aerosol Sci. Technol., 39, 637–658, 10.1080/02786820500182040, 2005.
Farina, S. C., Adams, P. J., and Pandis, S. N.: Modeling global secondary organic aerosol formation and processing with the volatility basis set: Implications for anthropogenic sec-ondary organic aerosol, J. Geophys. Res.-Atmos., 115, D09202, doi:10.1029/2009JD013046, 2010.
Fast, J., Aiken, A. C., Allan, J., Alexander, L., Campos, T., Cana-garatna, M. R., Chapman, E., DeCarlo, P. F., de Foy, B., Gaffney, J., de Gouw, J., Doran, J. C., Emmons, L., Hodzic, A., Hern-don, S. C., Huey, G., Jayne, J. T., Jimenez, J. L., Kleinman, L., Kuster, W., Marley, N., Russell, L., Ochoa, C., Onasch, T. B., Pekour, M., Song, C., Ulbrich, I. M., Warneke, C., Welsh-Bon, D., Wiedinmyer, C., Worsnop, D. R., Yu, X.-Y., and Zaveri, R.: Evaluating simulated primary anthropogenic and biomass burning organic aerosols during MILAGRO: implications for as-sessing treatments of secondary organic aerosols, Atmos. Chem. Phys., 9, 6191–6215, doi:10.5194/acp-9-6191-2009, 2009.
Gaydos, T. M., Pinder, R. W., Koo, B., Fahey, K. M., and Pan-dis, S. N.: Development and application of a three-dimensional aerosol chemical transport model, PMCAMx, Atmos. Environ., 41, 2594–2611, 2007.
Heald, C. L., Jacob, D. J., Park, R. J., Russell, L. M., Hue-bert, B. J., Seinfeld, J. H., Liao, H., and Weber, R. J.: A large organic aerosol source in the free troposphere miss-ing from current models, Geophys. Res. Lett, 32, L18809, doi:10.1029/2005GL023831, 2005.
Herndon, S. C., Onasch, T. B., Wood, E. C., Kroll, J. H., Cana-garatna, M. R., Jayne, J. T., Zavala, M. A., Knighton, W. B., Mazzoleni, C., Dubey, M. K., Ulbrich, I. M., Jimenez, J. L., Seila, R., de Gouw, J. A., de Foy, B., Fast, J., Molina, L. T., Kolb, C. E., and Worsnop, D. R.: Correlation of secondary or-ganic aerosol with odd oxygen in Mexico City, Geophys. Res. Lett., 35, L15804, doi:10.1029/2008GL034058, 2008.
Hildebrandt, L., Donahue, N. M., and Pandis, S. N.: High forma-tion of secondary organic aerosol from the photo-oxidaforma-tion of toluene, Atmos. Chem. Phys., 9, 2973–2986, doi:10.5194/acp-9-2973-2009, 2009.
Hodzic, A., Jimenez, J. L., Madronich, S., Aiken, A. C., Bessag-net, B., Curci, G., Fast, J., Lamarque, J.-F., Onasch, T. B., Roux, G., Schauer, J. J., Stone, E. A., and Ulbrich, I. M.: Modeling organic aerosols during MILAGRO: importance of biogenic sec-ondary organic aerosols, Atmos. Chem. Phys., 9, 6949–6981, doi:10.5194/acp-9-6949-2009, 2009.
Hodzic, A., Jimenez, J. L., Madronich, S., Canagaratna, M. R., DeCarlo, P. F., Kleinman, L., and Fast, J.: Modeling organic aerosols in a megacity: potential contribution of semi-volatile and intermediate volatility primary organic compounds to sec-ondary organic aerosol formation, Atmos. Chem. Phys., 10, 5491–5514, doi:10.5194/acp-10-5491-2010, 2010.
linuma, Y., B¨oge, O., Gnauk, T., and Hemnann, H.: Aerosol cham-ber study of the a-pinene/O3 reaction: Influence of particle acid-ity on aerosol yields and products, Atmos. Environ., 38, 761– 773, 2004.
Jang, M., Czoschke, N. M., Lee, S., and Kameris, R. M.: Heteroge-neous atmospheric aerosol production by acid-catalyzed particle phase reactions, Nature, 298, 814-817, 2002.
Johnson, K. S., de Foy, B., Zuberi, B., Molina, L. T., Molina, M. J., Xie, Y., Laskin, A., and Shutthanandan, V.: Aerosol compo-sition and source apportionment in the Mexico City Metropoli-tan Area with PIXE/PESA/STIM and multivariate analysis, At-mos. Chem. Phys., 6, 4591–4600, doi:10.5194/acp-6-4591-2006, 2006.
Kalberer, M., Paulsen, D., Sax, M., Steinbacher., M., Dommen, J., Prevot, A. S. H., Fisseha, R., Weingartner, E., Frankevich, V., Zenobi, R., and Baltensperger U.: Identification of polymers as major components of atmospheric organic aerosols, Science, 303(5664), 1659–1662, 2004.
Karydis, V. A., Tsimpidi, A. P., and Pandis, S. N.: Evaluation of a three-dimensional chemical transport model (PMCAMx) in the eastern United States for all four seasons, J. Geoph. Res., 112, D14211, doi:10.1029/2006JD007890, 2007.
Karydis, V. A., Tsimpidi, A. P., Fountoukis, C., Nenes, A., Zavala, M., Molina, L. T., and Pandis, S. N.: Simulating the fine and coarse inorganic particulate matter concentrations in a polluted megacity, Atmos. Environ., 44, 608–620, 2010.
Nun-nermacker, L. J., Senum, G. I., Wang, J., Weinstein-Lloyd, J., Alexander, M. L., Hubbe, J., Ortega, J., Canagaratna, M. R., and Jayne, J.: The time evolution of aerosol composition over the Mexico City plateau, Atmos. Chem. Phys., 8, 1559–1575, doi:10.5194/acp-8-1559-2008, 2008.
Kostenidou, E., Pathak, R. K., and Pandis, S. N.: An algorithm for the calculation of secondary organic aerosol density combining AMS and SMPS data, Aerosol Sci. Technol., 41, 1002–1010, doi:10.1080/02786820701666270, 2007.
Lane, T. E., Donahue, N. M., and Pandis, S. N.: Simulating sec-ondary organic aerosol formation using the Volatility Basis-Set approach in a chemical transport model, Atmos. Environ., 42, 7439–7451, 2008a.
Lane, T. E., Donahue, N. M., and Pandis, S. N.: Effect of NOx on secondary organic aerosol concentrations, Environ. Sci. Tech-nol., 42, 6022–6027, 2008b.
Lanz, V. A., Alfarra, M. R., Baltensperger, U., Buchmann, B., Hueglin, C., and Prvt, A. S. H.: Source apportionment of submi-cron organic aerosols at an urban site by factor analytical mod-elling of aerosol mass spectra, Atmos. Chem. Phys., 7, 1503– 1522, doi:10.5194/acp-7-1503-2007, 2007.
Li, G., Lei, W., Zavala, M., Volkamer, R., Dusanter, S., Stevens, P., and Molina, L. T.: Impacts of HONO sources on the photochem-istry in Mexico City during the MCMA-2006/MILAGO Cam-paign, Atmos. Chem. Phys., 10, 6551–6567, doi:10.5194/acp-10-6551-2010, 2010.
Li, G., Zavala, M., Lei, W., Tsimpidi, A. P., Karydis, V. A., Pan-dis, S. N., Canagaratna, M. R., and Molina, L. T.: Simulations of organic aerosol concentrations in Mexico City using the WRF-CHEM model during the MCMA-2006/MILAGRO campaign, Atmos. Chem. Phys., 11, 3789–3809, doi:10.5194/acp-11-3789-2011, 2011.
Lim, H. J, Carlton, A. C., and Turpin, B. J.: Isoprene forms sec-ondary organic aerosol through cloud processing: model simula-tions, Environ. Sci. Technol., 39, 4441–4446, 2005.
Liu, Y., El Haddad, I., Scarfogliero, M., Nieto-Gligorovski, L., Temime-Roussel, B., Quivet, E., Marchand, N., Picquet-Varrault, B., and Monod, A.: In-cloud processes of methacrolein under simulated conditions – Part 1: Aqueous phase photooxi-dation, Atmos. Chem. Phys., 9, 5093–5105, doi:10.5194/acp-9-5093-2009, 2009.
Mohr, C., Huffman, J. A., Cubison, M. J., Aiken, A. C., Docherty, K. S., Kimmel, J. R., Ulbrich, I. M., Hannigan, M., and Jimenez, J. L.: Characterization of primary organic aerosol emissions from meat cooking, trash burning, and motor vehicles with High-Resolution Aerosol Mass Spectrometry and comparison with ambient and chamber observations, Environ. Sci. Technol., 43, 2443–2449, doi:10.1021/es8011518, 2009.
Molina, L. T. and Molina, M. J.: Air Quality in the Mexico Megac-ity: An Integrated Assessment, Kluwer Academic Publishers: Dordrecht, The Netherlands, 384 pp., 2002.
Molina, L. T., Kolb, C. E., de Foy, B., Lamb, B. K., Brune, W. H., Jimenez, J. L., Ramos-Villegas, R., Sarmiento, J., Paramo-Figueroa, V. H., Cardenas, B., Gutierrez-Avedoy, V., and Molina, M. J.: Air quality in North America’s most populous city – overview of the MCMA-2003 campaign, Atmos. Chem. Phys., 7, 2447–2473, doi:10.5194/acp-7-2447-2007, 2007.
Molina, L. T., Madronich, S., Gaffney, J. S., Apel, E., de Foy, B., Fast, J., Ferrare, R., Herndon, S., Jimenez, J. L., Lamb, B.,
Osornio-Vargas, A. R., Russell, P., Schauer, J. J., Stevens, P. S., Volkamer, R., and Zavala, M.: An overview of the MILA-GRO 2006 Campaign: Mexico City emissions and their trans-port and transformation, Atmos. Chem. Phys., 10, 8697–8760, doi:10.5194/acp-10-8697-2010, 2010.
Murphy, B. N. and Pandis, S. N.: Simulating the formation of semivolatile primary and secondary organic aerosol in a regional Chemical Transport Model, Environ. Sci. Technol., 43, 4722– 4728, doi:10.1021/es803168a, 2009.
Ng, N. L., Kroll, J. H., Keywood, M. D., Bahreini, R., Varut-bangkul, V., Flagan, R. C., Seinfeld, J. H., Lee, A., and Gold-stein, A. H.: Contribution of first- versus second-generation products to secondary organic aerosols formed in the oxidation of biogenic hydrocarbons, Environ. Sci. Technol., 40, 2283–2297, doi:10.1021/es052269u, 2006.
Ng, N. L., Kwan, A. J., Surratt, J. D., Chan, A. W. H., Chhabra, P. S., Sorooshian, A., Pye, H. O. T., Crounse, J. D., Wennberg, P. O., Flagan, R. C., and Seinfeld, J. H.: Secondary organic aerosol (SOA) formation from reaction of isoprene with nitrate radicals (NO3), Atmos. Chem. Phys., 8, 4117–4140, doi:10.5194/acp-8-4117-2008, 2008.
Paatero, P. and Tapper, U.: Positive matrix factorization – a nonneg-ative factor model with optimal utilization of error-estimates of data values, Environmetrics, 5, 111–126, 1994
Pope, C. A., Burnett, R. T., Thun, M. J., Calle, E. E., Krewski, D., Ito, K., and Thurston, G. D.: Lung cancer, cardiopulmonary mor-tality, and long-term exposure to fine particulate air pollution, J. Am. Med. Assoc., 287, 1132–1141, 2002.
Querol, X., Pey, J., Minguill´on, M. C., P´erez, N., Alastuey, A., Viana, M., Moreno, T., Bernab´e, R. M., Blanco, S., C´ardenas, B., Vega, E., Sosa, G., Escalona, S., Ruiz, H., and Art´ı˜nano, B.: PM speciation and sources in Mexico during the MILAGRO-2006 Campaign, Atmos. Chem. Phys., 8, 111–128, doi:10.5194/acp-8-111-2008, 2008.
Racherla, P. N. and Adams, P. J.: Sensitivity of global tropospheric ozone and fine particulate matter concentra-tions to climate change, J. Geophys. Res., 111, D24103, doi:10.1029/2005JD006939, 2006.
Robinson, A. L., Donahue, N. M., Shrivastava, M. K., Weitkamp, E. A., Sage, A. M., Grieshop, A. P., Lane, T. E., Pandis, S. N., and Pierce, J. R.: Rethinking organic aerosols: semivolatile emis-sions and photochemical aging, Science, 315, 1259–1262, 2007. Shrivastava, M. K., Lane, T. E., Donahue, N. M., Pandis, S. N., and Robinson, A. L.: Effects of gas-particle partition-ing and agpartition-ing of primary emissions on urban and regional or-ganic aerosol concentrations, J. Geophys. Res., 113, D18301, doi:10.1029/2007JD009735, 2008.
Shrivastava, M., Fast, J., Easter, R., Gustafson Jr., W. I., Zaveri, R. A., Jimenez, J. L., Saide, P., and Hodzic, A.: Modeling organic aerosols in a megacity: comparison of simple and complex rep-resentations of the volatility basis set approach, Atmos. Chem. Phys. Discuss., 10, 30205–30277, doi:10.5194/acpd-10-30205-2010, 2010.
Song, J., Lei, W., Bei, N., Zavala, M., de Foy, B., Volkamer, R., Cardenas, B., Zheng, J., Zhang, R., and Molina, L. T.: Ozone response to emission changes: a modeling study during the MCMA-2006/MILAGRO Campaign, Atmos. Chem. Phys., 10, 3827–3846, doi:10.5194/acp-10-3827-2010, 2010.
We-ber, R. J., and Schauer, J. J.: Source apportionment of fine or-ganic aerosol in Mexico City during the MILAGRO experiment 2006, Atmos. Chem. Phys., 8, 1249–1259, doi:10.5194/acp-8-1249-2008, 2008.
Stone, E. A., Hedman, C. J., Zhou, J., Mieritz, A., and Schauer, J. J: Insights into the nature of secondary organic aerosol in Mexico City during the MILAGRO experiment 2006, Atmos. Environ., 44, 312–319, 2010.
Tsimpidi, A. P., Karydis, V. A., Zavala, M., Lei, W., Molina, L., Ulbrich, I. M., Jimenez, J. L., and Pandis, S. N.: Evaluation of the volatility basis-set approach for the simulation of organic aerosol formation in the Mexico City metropolitan area, Atmos. Chem. Phys., 10, 525–546, doi:10.5194/acp-10-525-2010, 2010. Ulbrich, I. M., Canagaratna, M. R., Zhang, Q., Worsnop, D. R., and
Jimenez, J. L.: Interpretation of organic components from Posi-tive Matrix Factorization of aerosol mass spectrometric data, At-mos. Chem. Phys., 9, 2891–2918, doi:10.5194/acp-9-2891-2009, 2009.
Volkamer, R., Jimenez, J. L., San Martini, F., Dzepina, K., Zhang, Q., Salcedo, D., Molina, L. T., Worsnop, D. R., and Molina, M. J.: Secondary organic aerosol formation from anthropogenic air pollution: Rapid and higher than expected, Geophys. Res. Lett., 33, L17811, doi:10.1029/2006GL026899, 2006.
Volkamer, R., Martini, F. S., Molina, L. T., Salcedo, D., Jimenez, J. L., and Molina, M. J.: A missing sink for gas-phase glyoxal in Mexico City: formation of secondary organic aerosol, Geophys. Res. Lett., 34, L19807, doi:10.1029/2007GL030752, 2007. Wameck, P.: In-cloud chemistry opens pathway to the formation
of oxalic acid in the marine atmospbere, Atmos. Environ., 37, 2423–2427, 2003.
Watson, J. G.: Visibility: Science and regulation, J. Air Waste Man-age., 52, 628–713, 2002.
Whrnschimmel, H., Maga˜na, M., Stahel, W. A., Blanco, S., Acu˜na, S., Prez, J. M., Gonz´alez, S., Guti´errez, V., Wakamatsu, S., and C´ardenas, B.: Measurements and receptor modeling of volatile organic compounds in Southeastern Mexico City, 2000–2007, Atmos. Chem. Phys., 10, 9027–9037, doi:10.5194/acp-10-9027-2010, 2010.
Wood, E. C., Canagaratna, M. R., Herndon, S. C., Onasch, T. B., Kolb, C. E., Worsnop, D. R., Kroll, J. H., Knighton, W. B., Seila, R., Zavala, M., Molina, L. T., DeCarlo, P. F., Jimenez, J. L., Weinheimer, A. J., Knapp, D. J., Jobson, B. T., Stutz, J., Kuster, W. C., and Williams, E. J.: Investigation of the cor-relation between odd oxygen and secondary organic aerosol in Mexico City and Houston, Atmos. Chem. Phys., 10, 8947–8968, doi:10.5194/acp-10-8947-2010, 2010.
Yokelson, R. J., Urbanski, S. P., Atlas, E. L., Toohey, D. W., Al-varado, E. C., Crounse, J. D., Wennberg, P. O., Fisher, M. E., Wold, C. E., Campos, T. L., Adachi, K., Buseck, P. R., and Hao, W. M.: Emissions from forest fires near Mexico City, At-mos. Chem. Phys., 7, 5569–5584, doi:10.5194/acp-7-5569-2007, 2007.
Yu, X.-Y., Cary, R. A., and Laulainen, N. S.: Primary and secondary organic carbon downwind of Mexico City, Atmos. Chem. Phys., 9, 6793–6814, doi:10.5194/acp-9-6793-2009, 2009.