www.atmos-chem-phys.net/10/4065/2010/ doi:10.5194/acp-10-4065-2010
© Author(s) 2010. CC Attribution 3.0 License.
Chemistry
and Physics
Airborne measurements of the spatial distribution of aerosol
chemical composition across Europe and evolution of the organic
fraction
W. T. Morgan1, J. D. Allan1,2, K. N. Bower1, E. J. Highwood3, D. Liu1, G. R. McMeeking1, M. J. Northway3, P. I. Williams1,2, R. Krejci4, and H. Coe1
1Centre for Atmospheric Science, University of Manchester, Manchester, UK
2National Centre for Atmospheric Science, University of Manchester, Manchester, UK 3Department of Meteorology, University of Reading, Reading, UK
4Department of Applied Environmental Science, Atmospheric Science Unit, Stockholm University, Stockholm, Sweden
Received: 27 November 2009 – Published in Atmos. Chem. Phys. Discuss.: 16 December 2009 Revised: 1 April 2010 – Accepted: 27 April 2010 – Published: 29 April 2010
Abstract. The spatial distribution of aerosol chemical com-position and the evolution of the Organic Aerosol (OA) fraction is investigated based upon airborne measurements of aerosol chemical composition in the planetary boundary layer across Europe. Sub-micron aerosol chemical composi-tion was measured using a compact Time-of-Flight Aerosol Mass Spectrometer (cToF-AMS). A range of sampling con-ditions were evaluated, including relatively clean back-ground conditions, polluted conditions in North-Western Eu-rope and the near-field to far-field outflow from such condi-tions. Ammonium nitrate and OA were found to be the domi-nant chemical components of the sub-micron aerosol burden, with mass fractions ranging from 20–50% each. Ammonium nitrate was found to dominate in North-Western Europe dur-ing episodes of high pollution, reflectdur-ing the enhanced NOx
and ammonia sources in this region. OA was ubiquitous across Europe and concentrations generally exceeded sul-phate by 30–160%. A factor analysis of the OA burden was performed in order to probe the evolution across this large range of spatial and temporal scales. Two separate Oxy-genated Organic Aerosol (OOA) components were identi-fied; one representing an aged-OOA, termed Low Volatility-OOA and another representing fresher-Volatility-OOA, termed Semi Volatile-OOA on the basis of their mass spectral similarity to previous studies. The factors derived from different flights were not chemically the same but rather reflect the range of
Correspondence to:W. T. Morgan
OA composition sampled during a particular flight. Signifi-cant chemical processing of the OA was observed downwind of major sources in North-Western Europe, with the LV-OOA component becoming increasingly dominant as the distance from source and photochemical processing increased. The measurements suggest that the aging of OA can be viewed as a continuum, with a progression from a less oxidised, semi-volatile component to a highly oxidised, less-semi-volatile com-ponent. Substantial amounts of pollution were observed far downwind of continental Europe, with OA and ammonium nitrate being the major constituents of the sub-micron aerosol burden. Such anthropogenically perturbed air masses can significantly perturb regional climate far downwind of ma-jor source regions.
1 Introduction
substantially reducing the impact of greenhouse gas radiative forcing, due to their competing cooling and warming effects respectively (Charlson et al., 1992). This is particularly evi-dent over industrialized and heavily populated regions of the Northern Hemisphere such as North America, Europe and South-East Asia. Additionally, aerosols can alter the micro-physical properties of clouds (e.g. Haywood and Boucher, 2000), leading to changes in the radiation balance of the cli-mate system and also regional meteorology (Denman et al., 2007).
Several recent intensive field studies have sought to eluci-date aerosol chemical composition and the processes which change it, with a focus upon their regional impacts. These include studies in Asia such as the Indian Ocean Experi-ment (INDOEX, Ramanathan et al., 2001) and North Amer-ica such as the New England Air Quality Study (NEAQS, Bates et al., 2005; Kleinman et al., 2007; Wang et al., 2007), the International Consortium for Atmospheric Re-search on Transport and Transformation (ICARTT, Quinn et al., 2006; Williams et al., 2007; Brock et al., 2008; de Gouw et al., 2008) and the Megacity Initiative: Local and Global Research Observations (MILAGRO, DeCarlo et al., 2006; Kleinman et al., 2008; Baumgardner et al., 2009; Fast et al., 2009). Recent airborne studies in Europe have fo-cused upon polluted environments in the Adriatic and Black Seas (Crosier et al., 2007) and the UK region (Morgan et al., 2009). A major conclusion of these European studies was the significant contribution of ammonium nitrate to the sub-micron particulate burden, particularly during highly pol-luted conditions. Zhang et al. (2007) presented a summary of numerous field studies in the Northern Hemisphere from the Aerodyne Aerosol Mass Spectrometer (AMS, Jayne et al., 2000; Canagaratna et al., 2007). A major theme of such analyses was the high proportion of Organic Matter (OM) contributing to the sub-micron particulate burden. The study by Zhang et al. (2007) indicated that the OM component was dominated by oxygenated species relative to Primary Or-ganic Aerosol (POA) and that the mass fraction of the more oxidised component compared to the total organic mass in-creases away from urban environments. Comparison of such ambient measurements of Secondary Organic Aerosol (SOA) with atmospheric chemistry models reveals significant dis-crepancies between them (Volkamer et al., 2006, and refer-ences therein). Furthermore, such discrepancies increase as a function of photochemical age.
Coupling of a thermodenuder system with an AMS indi-cated that the SOA component could be separated in terms of their volatility, with more aged-SOA being less volatile than fresher-SOA (Huffman et al., 2009). Furthermore, the POA component was shown to be semi-volatile. Such results are consistent with recent frameworks which have treated the en-tire OM component as semi-volatile (Donahue et al., 2006; Robinson et al., 2007). This is in contrast to traditional mod-elling approaches that prescribe the POA to be non-volatile and inert (Donahue et al., 2009). Recently, such a framework
has been implemented to explain OM volatility and compo-sition variations both downwind of a megacity source and across a global ground-based dataset (Jimenez et al., 2009).
The present study seeks to elucidate the spatial distribution and chemical evolution of the sub-micron particulate mass across a broad range of scales, with particular emphasis upon the OM component and its contrasting behaviour compared to inorganic species. We do so using measurements drawn from two related aircraft campaigns across Northern Europe, a region that plays an important role in the global aerosol budget.
The major part of the analysis consists of measurements made during May 2008 as part of the European Integrated Project on Aerosol Cloud Climate and Air Quality Interac-tions (EUCAARI, Kulmala et al., 2009) airborne intensive study, known as the EUCAARI-LONG Range EXperiment (EUCAARI-LONGREX, henceforth referred to as LON-GREX). These measurements are complemented by flight operations based out of the UK, which took place during April and September 2008 as part of the Appraising the Di-rect Impacts of Aerosol on Climate (ADIENT) project. A key aim of these projects is an evaluation of the relative con-tribution of particular chemical components to the aerosol burden. This includes characterisation of the multiple com-ponents which make up the OM burden, along with their sub-sequent evolution in the atmosphere. The present dataset is well placed to investigate processes governing the formation and transformation of atmospheric aerosol due to the broad range of spatial scales investigated.
2 Method
8 6 4 2 0
Mass
concentration (µg sm
-3 )
1 2 3 4 5 6 7
Zone
Organics Nitrate Sulphate Ammonium
65
60
55
50
45
Latitude (ºN)
30 20
10 0
-10 -20
Longitude (ºE)
Lp
Ob
Cr Ca
(Pa)
(Pb)
(Pc)
7
6
5 4
3 2
1 Period Date(s) ADIENT-1 16 April LONGREX-1 06-08 May LONGREX-2 10-14 May LONGREX-3 19-20 May ADIENT-2 18-25 September
B357
B362 B406
B374
B369 a.
b.
Fig. 1. (a)Flight tracks of the BAe-146 considered by this analysis for segments below 3000 m. The periods identified in the figure are
described in the main text and Table 1. Overlapping flight tracks are offset slightly in order to clearly discern them. The flight numbers and arrows refer to the example flights discussed in the main text. Locations relevant to this study are marked, including Liverpool (Lp), Cranfield (Cr), Cabauw (Ca) and Oberpfaffenhofen (Ob). The locations of the vertical profiles displayed in Fig. 3 are indicated by the Pa (Profile-a), Pb (Profile-b) and Pc (Profile-c) markers. (b)Summary of the AMS median mass concentrations for each zone identified in
(a). The vertical bars represent the 25th and 75th percentiles.The percentile concentrations are included in the Supplementary materials in Table S3 (http://www.atmos-chem-phys.net/10/4065/2010/acp-10-4065-2010-supplement.pdf).
which was characterised by predominantly easterley condi-tions. Flights from LONGREX are considered along with the ADIENT flights from April and September 2008. The ADIENT flights were conducted in differing meteorolog-ical conditions, with the April flight conducted in south-easterley conditions, while the September flights took place during easterley conditions with similar transport patterns to the LONGREX period. The flight tracks are shown on Fig. 1 and are coloured according to the different flying pe-riods and conditions. The meteorological conditions for the different periods are relatively consistent in terms of their transport patterns, with air masses advecting pollution from continental Europe downwind to either the UK region or the Eastern Atlantic Ocean (see Supplementary Materials Sect. 2, Figs. S1 and S2; http://www.atmos-chem-phys.net/ 10/4065/2010/acp-10-4065-2010-supplement.pdf). Some flights concentrated on instrument testing/calibration and are not included in the analysis. During some flights instrument performance was not optimal; data from these 3 flights have not been included. The flights included in this analysis are summarised in Table 1.
2.1 Instrumentation
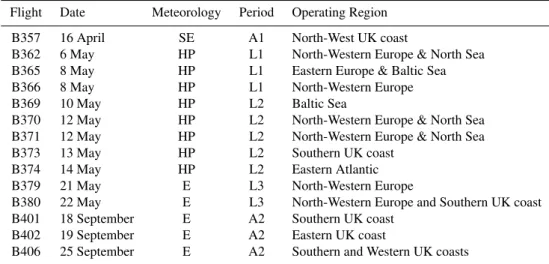
Table 1.Flight summary for ADIENT (B357, B401-B406) and LONGREX (B362-B380) operations included in this study. All flights were conducted during 2008. The predominant meteorological conditions present are summarised, where SE refers to south-easterley, E refers to easterley and HP refers to the high pressure system during the initial LONGREX flights described in the main text. Also included is an indication of which period each flight took place during, which are abbreviated as A1 (ADIENT-1) and A2 (ADIENT-2). The LONGREX flights refer to the 3 periods in the main text, which are referred to as LONGREX-1 (L1), LONGREX-2 (L2) and LONGREX-3 (L3).
Flight Date Meteorology Period Operating Region B357 16 April SE A1 North-West UK coast
B362 6 May HP L1 North-Western Europe & North Sea B365 8 May HP L1 Eastern Europe & Baltic Sea B366 8 May HP L1 North-Western Europe B369 10 May HP L2 Baltic Sea
B370 12 May HP L2 North-Western Europe & North Sea B371 12 May HP L2 North-Western Europe & North Sea B373 13 May HP L2 Southern UK coast
B374 14 May HP L2 Eastern Atlantic B379 21 May E L3 North-Western Europe
B380 22 May E L3 North-Western Europe and Southern UK coast B401 18 September E A2 Southern UK coast
B402 19 September E A2 Eastern UK coast
B406 25 September E A2 Southern and Western UK coasts
particles (Gao et al., 2007). Additionally, gas phase concen-trations of CO (Carbon Monoxide), O3 (Ozone) and NOx
(defined as the sum of NO (Nitric Oxide) and NO2
(Nitro-gen Dioxide)) were measured. The facility also provides aircraft position information and measurements of standard atmospheric variables, such as temperature and relative hu-midity.
Measurements made by an Aerodyne compact Time-of-Flight Aerosol Mass Spectrometer (cToF-AMS, Drewnick et al., 2005; Canagaratna et al., 2007) form the major part of this study. The instrument provides the capability to quanti-tatively measure the size-resolved chemical composition of non-refractory particulate matter, including OM, sulphate, nitrate, ammonium and chloride. A major advantage of the cToF-AMS is the ability to provide high time resolution mea-surements with enhanced precision and sensitivity. Thus it is ideal for airborne deployments. Previous studies (Crosier et al., 2007; Capes et al., 2008; Morgan et al., 2009) have detailed the AMS sampling strategy onboard the BAe-146. The sampling losses for the cToF-AMS inlet system were es-timated experimentally to be approximately 10% by number across the size range of the AMS. This was accomplished by comparing a Condensation Particle Counter (CPC) upstream of the inlet system with one situated immediately prior to the sampling orifice of the AMS while sampling monodisperse aerosol. Details specific to the cToF-AMS data analysis will be discussed in the following subsection.
2.2 AMS data quantification
The AMS data analysis was performed using the stan-dard SQUIRREL (SeQUential Igor data RetRiEvaL) ToF-AMS software package. Mass spectrum deconvolution is accomplished using the fragmentation table approach de-scribed by Allan et al. (2004). Error estimates are generated according to the model documented by Allan et al. (2003). Mass concentrations derived from the AMS are reported as micrograms per standard cubic metre (µg sm−3) i.e. at a
tem-perature of 273.15 K and pressure of 1013.25 hPa. Power was unavailable to the AMS between flights due to opera-tional constraints. Through the use of plug valves to isolate the AMS chamber, a vacuum of typically less than 0.5 Torr is maintained while the turbo-pumps are powered down. Ion-isation efficiency (IE) calibrations were performed regularly before and after each flight during the flying periods. Values determined from both pre-flight and post-flight calibrations (i.e. taking place on the same day) exhibited little variabil-ity. Post-flight values were used as these were considered to be more reliable compared with pre-flight values due to the reduced instrument background post-flight. A faulty ground power unit during LONGREX caused a loss of power to the aircraft prior to flight B365 while the AMS was pumping down. This led to slightly enhanced background concentra-tions in the AMS vacuum chamber due to a filament failure associated with the power loss during flights B365–B369.
has used a CE correction following the principle developed by Crosier et al. (2007). This was developed using a sim-ple empirical treatment of the CE as a linear function of the nitrate content of the aerosol based upon comparison of AMS sulphate with filter measurements. Matthew et al. (2008) conducted a detailed laboratory study of the AMS CE across a range of compositions. Their study included a comparison of their laboratory derived correction with the Crosier et al. (2007) parameterisation. This indicated that the simpler linear treatment overestimated the CE at inter-mediate ammonium nitrate mass fractions. A comparison between the two techniques as part of this work revealed that the two approaches showed a maximum discrepancy at intermediate ammonium nitrate mass fractions that did not typically exceed 25% and was considerably less at high and low mass fractions. Consequently, we use the correc-tion developed by Matthew et al. (2008) to estimate the CE of the AMS in this study. The AMS total mass con-centrations were converted to total volume concon-centrations using the densities reported by Cross et al. (2007), which correspond to 1.27 g cm−3 for organics and 1.77 g cm−3
for inorganics. Comparison of the estimated AMS total volume with the PCASP indicates that campaign average agreement was within 30% (see Supplementary Materials Sect. 3, Fig. S4; http://www.atmos-chem-phys.net/10/4065/ 2010/acp-10-4065-2010-supplement.pdf). This is within the 30–50% uncertainty previously reported for PCASP volume concentration estimates (e.g. Moore et al., 2004; Hallar et al., 2006). All flights fall within the 50% agreement range except for B357. The uncertainties in the estimate are large due to the high sensitivity of the volume calculations to diameter (proportional to diameter3) and the uncertainties in density required to convert the AMS mass to volume.
3 Spatial distribution of aerosol chemical composition across Europe
The differing spatial scales and meteorological contexts con-sidered by this analysis provide a thorough examination of the aerosol chemical composition in Europe during anticy-clonic conditions. The distribution of the chemical compo-nents measured by the AMS will be discussed here in order to set the context for the subsequent analysis and discussion. Both the broader scale and flight period/condition specific details will be summarised. The flight periods were split according to the period in which they were conducted and their general meteorological conditions. Their designations are summarised in Table 1 and Fig. 1.
The spatial distribution of the total OM for Straight and Level Runs (SLRs) below 3000 m is shown for the entire dataset in Fig. 2. The boundary layer height was predomi-nantly below 2000 m but during some conditions, an elevated planetary boundary layer was observed so 3000 m was used as a threshold altitude. The distribution indicates that OM is
65
60
55
50
45
Latitude (ºN)
30 20
10 0
-10 -20
Longitude (ºE)
0.7
0.6
0.5
0.4
0.3
0.2
0.1
0.0
Organics mass fraction
AMS Total Mass (µg sm-3)
1.0 25.0
Fig. 2. AMS total mass concentrations (symbol size) and organic
mass fraction (symbol colour) for low-level Straight and Level Runs (SLRs<3000 m). Median values are reported for both symbol size
and symbol colour.
a major contributor to the sub-micron aerosol burden, with typical mass fractions from 20–50%. Importantly, OM is a significant component during both background and highly polluted conditions. This is illustrated in Fig. 2, as the OM mass fraction almost always accounts for more than 20% of the total mass measured by the AMS.
The absolute and relative contributions of the chemical components measured by the AMS can be discerned from Fig. 1b. The flight data have been separated into different zones representing the main areas and emission fields sam-pled across Northern Europe and average composition data has been determined for each area. The OM concentration is typically 1.4–2.6 times greater than that of sulphate further east (zones 4–5) and is the dominant component mass in sub-micron aerosol in central and eastern Europe (zones 5 and 6), while in zones further west, the OM and sulphate mass concentrations are comparable. Sulphate contributes approx-imately 1.0–4.0 µg sm−3to the regional aerosol burden, with
typical mass fractions of 10–30%. The spatial distribution of nitrate indicates large gradients in the concentration and relative contribution of this component. In particular, the ni-trate mass concentration is enhanced in North-Western Eu-rope compared to locations further east. In terms of its rela-tive contribution, nitrate accounts for approximately 20–50% of the sub-micron mass across a wide range of locations and conditions. Furthermore, increases in the nitrate concentra-tion are associated with enhanced total mass loadings, indi-cating that nitrate is a significant contributor under highly polluted conditions. Examination of the sulphate, nitrate and ammonium concentrations indicate that the aerosol was neu-tralised, thus sulphate is present in the form of ammonium sulphate and nitrate is in the form of ammonium nitrate.
6000
5000
4000
3000
2000
1000
0
Altitude (m)
20 15 10 5 0
Mass concentration (µg sm-3)
6000
5000
4000
3000
2000
1000
0
Altitude (m)
20 15 10 5 0
Mass concentration (µg sm-3)
6000
5000
4000
3000
2000
1000
0
Altitude (m)
20 15 10 5 0
Mass concentration (µg sm-3) Organics Nitrate Sulphate Ammonium
a. b. c.
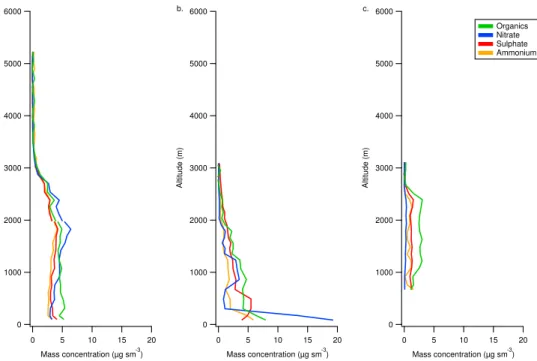
Fig. 3.Vertical profiles of aerosol chemcial composition from(a)B374 in the Eastern Atlantic (zone 1),(b)B362 in the North Sea off the
UK east coast and(c)B369 over Latvia in North-Eastern Europe. The profile locations are marked on Fig. 1a.
from continental Europe and the southern UK along the UK’s western edge. The flight included close to source sampling downwind of Manchester and Liverpool, in the north-west of England (identified on Fig. 1). During this flight, the sec-ondary aerosol species’ mass concentrations were reduced when compared to the other periods. This is potentially a consequence of reduced photochemistry as the flight took place earlier in the year than the LONGREX and ADIENT-2 flying.
Analysis of the high pressure phase of LONGREX in-dicated significant differences in gas-phase and particulate loadings, which could be categorised into two distinct me-teorological periods. During the initial phase of LONGREX from the 6–8 May (referred to as LONGREX-1), the air mass trajectories displayed a more zonal flow from east-to-west. The second phase from the 10–14 May (henceforth referred to as LONGREX-2) is characterised by the then well estab-lished high pressure system centred over northern Germany and Denmark, yielding more rotational anticyclonic flow. The LONGREX-1 period was characterised by enhanced CO and NOxlevels compared to the second period. These strong
signatures of urban pollution on the regional scale corre-lated with significant amounts of secondary material, with total mass concentrations reported by the AMS exceeding 25 µg sm−3. Such instances were dominated by ammonium
nitrate and OM. Such conditions were also prevalent dur-ing the LONGREX-3 and ADIENT-2 flydur-ing periods. These aforementioned periods concentrated upon sampling close to major anthropogenic sources and the immediate near-field downwind evolution of such sources.
The major distinction between LONGREX-2 and the op-erations conducted in each of the other identified periods was the large spatial scale sampled, where the measure-ments extended from the Baltic Sea region in Northern Eu-rope, to the Eastern Atlantic Ocean, off the southern Irish coast. The operations represented approximately 3000 km and approximately 4–5 days of air mass transit based on air mass back trajectories. These were derived from European Centre for Medium-Range Weather Forecasts (ECMWF) wind fields, initialised from the SLRs in the east-Atlantic (51 N, 12 W). During the LONGREX-2 period, when NOx
and background CO levels were reduced, the mass con-centration of ammonium nitrate was diminished in North-Western Europe. In terms of the median AMS aerosol con-centrations, LONGREX-2 was similar to LONGREX-1 in terms of sulphate and OM, while nitrate was reduced. The main difference between the periods was the absence of the more intense ammonium nitrate concentrations, which con-tributed to the significant pollution episodes encountered dur-ing LONGREX-1. The operations in the Eastern Atlantic probed total sub-micron mass loadings from the AMS ex-ceeding 15 µg sm−3with OM and ammonium nitrate being
the dominant chemical components. The Falcon’s HSRL measured aerosol optical depth values from 0.3–0.5 in these conditions far downwind of the major source regions in Western Europe.
with the cleaner conditions in the Baltic region (panel C, zone 7), the immediate outflow from North-Western Eu-rope into the North Sea (panel B, zone 4) and the outflow from continental Europe far downwind in the Eastern At-lantic (panel A, zone 1). The profiles show that the bound-ary layer typically extended to between 2000–3000 m, the actual height of which as determined by the location of the measurements in relation to the centre of the high pressure system. Also evident in panel B is the strong increase in con-centrations close to the sea surface, which was coincident with a shallow moist layer where concentrations of both am-monium nitrate and OM increased significantly. Also dis-cernible is the increase in sulphate at lower levels (below 1000 m) which is likely attributable to shipping activities. This was also observed in zone 3, which covers the English Channel region, where sulphate concentrations increased and the largest sulphate mass fractions were observed. Further details and observations regarding the vertical distribution of aerosol chemical composition are discussed in Morgan et al. (2010) in the EUCAARI special issue.
The following analysis and discussion will focus upon the evolution of the ubiquitous OM component across the full range of spatial scales investigated. This is accomplished us-ing a factor analysis technique which will be presented and discussed in the following section. The results of this analy-sis will then be used to probe the evolution of the OM compo-nent and contrast it with the observed gradients in the ammo-nium nitrate and ammoammo-nium sulphate fields across Europe.
4 Factor analysis of organic aerosol: technique and discussion
Several recent studies have employed various factor analysis techniques in order to deconvolve the organic mass spectra derived from ambient AMS measurements (e.g. Zhang et al., 2005a,b; Lanz et al., 2007, 2008; Ulbrich et al., 2009). With the exception of biomass burning, wood combustion or urban environments with a prevalent cooking signature, such stud-ies have attributed the OM component to be a combination of Hydrocarbon-like Organic Aerosol (HOA) and Oxygenated Organic Aerosol (OOA). These two factors commonly ex-plain more than 90% of the variance in the ambient organic mass spectra (McFiggans et al., 2005; Zhang et al., 2005a; Rudich et al., 2007). Furthermore, such factors remain rela-tively constant across differing environments. Several stud-ies (e.g. Lanz et al., 2007; Zhang et al., 2007; Ulbrich et al., 2009) have identified multiple OOA factors, which have been classified according to their level of oxidation.
Jimenez et al. (2009) characterised the evolution and volatility of these multiple OOA components using the terms Low-Volatility OOA (LV-OOA) and Semi-Volatile OOA (SV-OOA). These terms represent the OOA-1 and OOA-2 components identified in previous studies (e.g. Lanz et al., 2007; Ulbrich et al., 2009), though Jimenez et al. (2009)
demonstrated that these factors were systematically corre-lated with lower and higher volatile fractions of the OM. LV-OOA is distinguished by the predominance of signal at
m/z44 (corresponding to the CO+2 ion arising from decar-boxylation on the vaporiser surface). SV-OOA components typically exhibit enhanced signal at m/z 43 (C2OH+3 and
C3H+7) and reduced signal atm/z44, when compared to
LV-OOA mass spectra. Examination of high-resolution AMS data has demonstrated the dominance of the C2OH+3 ion at m/z43 in ambient spectra when the contribution of OOA is high (Mohr et al., 2009). Thus this SV-OOA component rep-resents a less oxidised OM fraction. Jimenez et al. (2009) argue that the atmospheric OOA evolves through a dynamic aging process of continual repartitioning between the particle and gas phases, which leads to a more oxidised, less volatile and more hygroscopic aerosol. Thus the initial OOA, which resembles SV-OOA, undergoes transformation processes that ultimately result in an OOA that exhibits LV-OOA like char-acteristics. Following this framework, the present analysis strives to simplify the OM burden into a limited number of key factors in order to probe their relative magnitudes, rela-tions and evolution across Europe for the first time.
4.1 Positive Matrix Factorisation (PMF)
Positive Matrix Factorisation (PMF, Paatero and Tapper, 1994; Paatero, 1997) was utilised in order to accomplish some simplification of the OM burden. Several recent stud-ies have detailed its application to AMS data (Lanz et al., 2007; Docherty et al., 2008; Ulbrich et al., 2009; Aiken et al., 2009). PMF employs a receptor-only factorisation model, which is based on mass conservation. The model assumes that a dataset matrix is comprised of a linear combination of factors with constant profiles, which have varying contribu-tions across the dataset. The model employs the constraint of positive values upon the profiles and contributions. This work will follow the procedures identified by Ulbrich et al. (2009) in order to apply the PMF technique to AMS data. Version 4.2 of the PMF2 algorithm (provided by the Univer-sity of Helsinki) is employed in robust mode to perform the factorisation.
pollution transport was restricted to the boundary layer. Also, we do not wish to include data from above the boundary layer as purely free tropospheric factors would be virtually impos-sible to discern due to signal-to-noise constraints.
The analysis was limited tom/zchannels less than 200 due to low signals at higher masses and thus minor contributions to the OM. Four flights during LONGREX suffered from en-hanced background concentrations and the analysis was per-formed onm/zchannels smaller than 100 in these cases due to enhanced residuals at largerm/zvalues. Intense organic mass concentrations, which were predominantly present for single data points, led to short pulses in the value of the scaled residual. These events were often associated with lo-cal sources close to airfields upon landing or takeoff. Such instances are not well constrained by a single factor although their occurrence is relatively infrequent and are not repre-sentative of the regional scale composition of interest to this study. Consequently, such points are omitted from the anal-ysis.
The ability to rigourously compare the factor solutions from both individual and different flights was the primary objective of the analysis. Thus, the identification of the most appropriate factor solution is determined based upon consis-tency and objectivity across the range of conditions encoun-tered by the dataset. A detailed discussion of the methodol-ogy used in the PMF analysis and examples of the solutions for individual flights and a summary of the retrieved solu-tions for all of the flights considered are included in the Sup-plementary Materials Sect. 5 (http://www.atmos-chem-phys. net/10/4065/2010/acp-10-4065-2010-supplement.pdf). 4.2 Results of the factor analysis
For the purposes of the subsequent discussions, the retrieved factor components are classified according to their level of oxidation, which is signified by their relative organic inten-sity atm/z44. Thus, factors with the greatestm/z44 signal are designated OOA-1 with subsequent factors designated as OOA-2, OOA-3 etc. This is conceptually similar to the nomenclature introduced by Lanz et al. (2007) and is used to initially compare the retrieved factors with reference mass spectra and external tracers. These will then be discussed in terms of their resemblance to LV-OOA, SV-OOA and HOA factors derived by Jimenez et al. (2009).
For all of the flights considered, two factor solutions were found to be the most appropriate; one that is highly oxidised (OOA-1) and a second that is less oxidised (OOA-2), which often represented a combination of HOA with fresher OOA components. The factors were chosen based upon compari-son with reference mass spectra, external tracers and their nu-merical stability. Case study examples of a range of flights in differing conditions are presented in the Supplementary Ma-terials (Sect. 5) (http://www.atmos-chem-phys.net/10/4065/ 2010/acp-10-4065-2010-supplement.pdf). When more than two factors were chosen, the solutions were found to be
nu-merically unstable based upon a bootstrapping analysis (Ul-brich et al., 2009, and references therein), where random re-sampling of the data matrix is performed in the time dimen-sion.
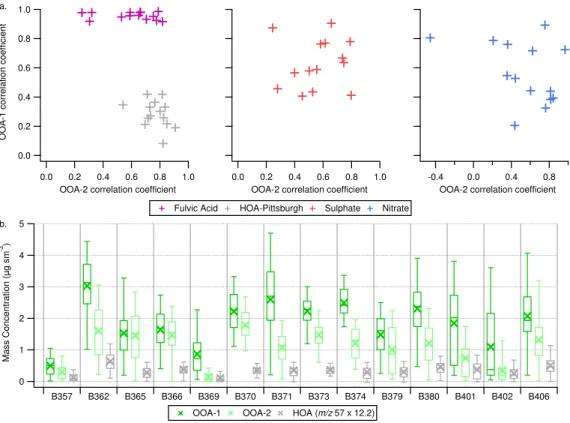
The retrieved factors for the 2-factor solutions were com-pared with reference mass spectra in Fig. 4a. OOA-1 type mass spectra were highly correlated (r >0.9) with fulvic acid
across the dataset and variability in the retrieved mass spec-trum was low. Furthermore, the OOA-1 profiles had low cor-relation with the reference HOA mass spectrum from Pitts-burgh (r <0.45 for all cases). The OOA-2 component
typ-ically exhibits enhanced signal atm/z 43 relative to signal atm/z44, when compared to the OOA-1 mass spectra. The OOA-2 components had lower correlations with fulvic acid. The OOA-2 also exhibited greater correlation with the refer-ence HOA spectrum with coefficients ranging from 0.5–0.9. This is unsurprising given that we have not separated the HOA contribution from the fresher-OOA component. The correlations of OOA-2 with fulvic acid and reference HOA reflect the chemical variation in the OOA component as they are anti-correlated with each other. Thus, as the OOA-2 be-comes more oxidised it resembles HOA less and approaches a more LV-OOA or fulvic acid-like mass spectrum.
0.8 0.4 0.0 -0.4
OOA-2 correlation coefficient 1.0
0.8 0.6 0.4 0.2 0.0
OOA-2 correlation coefficient
5
4
3
2
1
0
Mass Concentration (µg sm
-3 )
B357 B362 B365 B366 B369 B370 B371 B373 B374 B379 B380 B401 B402 B406 1.0
0.8
0.6
0.4
0.2
0.0
OOA-1 correlation coefficient
1.0 0.8 0.6 0.4 0.2 0.0
OOA-2 correlation coefficient a.
b.
Fulvic Acid HOA-Pittsburgh Sulphate Nitrate
OOA-1 OOA-2 HOA (m/z 57 x 12.2)
Fig. 4. (a)Summary of correlations for OOA-1 and OOA-2 with both reference mass spectra and external time series. Uncentered correlation
coefficients are used for the mass spectra, while Pearson’s R are used for the external time series. The fulvic acid mass spectrum is from Alfarra et al. (2004) and the HOA-Pittsburgh refers to to the deconvolved HOA solution from Zhang et al. (2005a). (b)Boxplot summary statistics of OOA-1, OOA-2 and estimated HOA mass concentrations for each flight considered in the analysis. Crosses represent the mean value, while horizontal lines represent the 25th, 50th and 75th percentiles. The whiskers represent the 5th and 95th percentiles.
Sulphate is often well correlated with 2 and OOA-1, which is likely due to the regional nature of these mea-surements and the covariance between the different chemi-cal species. Thus factor interpretations where multiple OOA components are identified need to consider the meteorolog-ical, photochemical and geographical context at individual sampling locations when making suppositions based upon comparison with other secondary particulate species.
Given that the OOA-2 component generally contains a HOA contribution, it is desirable to estimate the relative im-portance of the primary versus secondary components. Some previous studies have included first order estimates of OM components based upon absolute intensities at specific mass spectral markers by comparing such markers with factor component solutions (e.g. Zhang et al., 2005a; Aiken et al., 2009). Zhang et al. (2005a) reported that the HOA mass con-centration can be approximated based upon a linear scaling of the signal intensity atm/z57. Aiken et al. (2009) reported a similar relationship but with an additional correction for oxidised fragments associated with m/z57 based upon the organic signal intensity atm/z44. In order to derive an ap-proximate estimate of the contribution of HOA to the OM burden in this dataset, these first order estimates are used.
While such estimations are not fully quantitative, they do at least represent an approximate reference point which pro-vides a level of justification for the decision to limit the anal-ysis to the 2-factor solution sets. Furthermore, the estimated HOA is typically less than the OOA-2 concentration reported from the factor analysis. An important observation is that the enhanced HOA mass fractions are predominantly driven by the reduced contribution from secondary species, rather than a major increase in the absolute HOA mass loading.
The Aiken et al. (2009) estimate was found to be inap-propriate for this dataset as the m/z 57 contribution was often close to zero, while the organic intensity at m/z 44 was typically an order of magnitude greater. This led to negative HOA concentrations frequently being estimated us-ing this approximation. The solutions for the entire dataset are summarised in Fig. 4b by comparing the absolute mass concentrations for the OOA-1, OOA-2 and estimated HOA. The HOA contribution is calculated using the estimation from Zhang et al. (2005a) and indicates that the median con-centration is typically less than 0.5 µg sm−3, with
concen-trations rarely exceeding 1 µg sm−3. Such a result indicates
0.25 0.20 0.15 0.10 0.05 0.00
Normalised signal
100 80 60 40 20
m/z
Spectrum A
0.30
0.25
0.20
0.15
0.10
0.05
0.00
m/z
44:OM
0.20 0.15
0.10 0.05
0.00
m/z 43:OM
0.08 0.06 0.04 0.02 0.00
Normalised Signal
100 80 60 40 20
m/z
Spectrum C 0.10
0.08 0.06 0.04 0.02 0.00
Normalised Signal
100 80 60 40 20
m/z
Spectrum B
Individual data points OOA-1 OOA-2 Uncentred correlation with fulvic acid mass spectrum
2
0.0 1.0 1.0 0.8 0.6 0.4 0.2 0.0
Uncentred correlation with HOA Pittsburgh mass spectrum
a. b.
Spectrum B Spectrum A
Spectrum C LV-OOA
SV-OOA
HOA
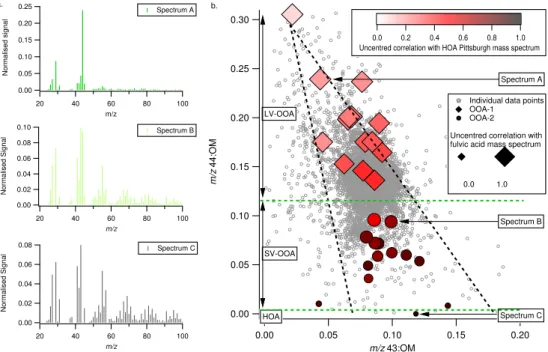
Fig. 5. (a)Examples of mass spectra derived from the PMF analysis. (b)Relationship between the fractional signal atm/z44 normalised
to the total organic loading andm/z43 normalised to the total organic loading. Grey markers refer to individual data points from all of the flights. Diamond and circle markers denote the same measures from the high and low oxygenated factors (OOA-1 and OOA-2) identified from the PMF analysis, coloured and sized according to their correlation with Pittsburgh HOA and laboratory derived fulvic acid respectively. The mass spectra shown in (a) are identified on (b) by the arrow and text box. The thick dashed black lines refer to guidelines from Ng et al. (2009) discussed in the main text. The dashed green lines refer to guideline bounds for the different PMF clusters identified as LV-OOA, SV-OOA and HOA.
2007). Consequently, the dataset indicates that the OOA component dominates the OM burden across Europe on the regional scale, thus this will be the focus of the subsequent discussion.
4.3 Interpretation of the factor analysis
Typical example mass spectra from different flights from the 2 factor solutions are presented in Fig. 5a. Spectrum A is highly consistent with LV-OOA, with the spectrum being dominated by normalised organic signal intensity atm/z44 and with a correlation coefficient of 0.99 with fulvic acid. This spectrum is taken from flight B366, as is spectrum B which is distinguished by the normalisedm/z43 and 44 peaks being almost equal. This is consistent with SV-OOA spectra (e.g. Ulbrich et al., 2009; Jimenez et al., 2009) and the rel-ative concentration of this component versus the HOA esti-mated suggests it is dominated by OOA. Spectrum C is the B357 HOA-type factor which had a correlation coefficient of 0.91 with the reference HOA spectrum. This factor is likely dominated by HOA-like components rather than OOA. A key feature of these example spectra is the changing nor-malised signal intensities atm/z43 and 44, with HOA being dominated bym/z43, SV-OOA being closer to a 1:1 ratio and LV-OOA being dominated bym/z44.
This is illustrated in Fig. 5b by the relationship between the organic signal intensity atm/z43 and 44, which are both normalised to the total OM loading. Both individual data points from all of the flights and the normalised signal inten-sities from the resolved factor components for each flight are shown. This shows that as them/z43:OM ratio decreases, the
m/z44:OM ratio increases. This is suggestive of the OM bur-den aging as a continuum in terms of its oxygen content from freshly formed OOA, through to highly aged OOA which exhibits a high resemblance to fulvic acid-like mass spec-tra. The flight operations, given their transient nature, tend to probe this continuum which is a consequence of the constant evolution of the OM component on the regional scale. This is consistent with the difficulty in separating the OOA from the HOA in the factor analysis. The relative contribution of
of theirm/z44:OM ratio, with OOA-2 being less than 0.10 and OOA-1 being greater than 0.14. This is reflected by the green dashed horizontal line on Fig. 5b between these two clusters. B357 is the only flight where the second factor is in-terpreted as being dominated by HOA rather than SV-OOA due to its high resemblance to reference spectra and good agreement with literature values for POA to primary emis-sion tracers. The two factors (from B365 and B371) which also exhibit reduced signal atm/z44 do not agree as well with such literature values. Furthermore, they are partially oxidised (m/z44=0.01) and as shown in Fig. 4b, their ab-solute concentrations are significantly greater than the esti-mated HOA. Thus the second green dashed horizontal line is used to separate the B357 factor from the other OOA-2 components identified. The identified continuum is consis-tent with a PMF analysis of a worldwide AMS ground-based dataset by Ng et al. (2009). The black dotted lines in Fig. 5b show the general relationship between them/z44:OM ratio and them/z43:OM ratio from this worldwide dataset.
Based upon the framework presented by Jimenez et al. (2009), we classify the OOA-1 components as LV-OOA and the OOA-2 as SV-OOA except for the B357 OOA-2 factor, which is classified as HOA. Aiken et al. (2008) showed that the contribution ofm/z44 to the OM is an excellent proxy for the Oxygen-to-Carbon (O:C) ratio of OM. Such an ob-servation is attributed to SOA formation and photochemical aging. Thus the observed continuum of organic evolution is reflected by progressive aging from a SV-OOA dominated burden to a LV-OOA dominated burden.
The separation of the factor profiles in terms of their nor-malisedm/z44 signal highlights that retrieved PMF profiles tend to be strongly determined by the extremes in the ex-amined dataset as the actual data predominantly fall within a band of relatively oxidised OM between 0.10–0.20. The extremes on either side of this band are representative of very fresh and very aged OM respectively. The key ques-tion regarding this analysis technique is whether static PMF factor profiles are capable of reflecting changes in a con-tinuum i.e. is it possible to simplify the observed evolu-tion using such a limited number of factors? The vari-ability in terms of the mass spectral fingerprints of the LV-OOA and SV-LV-OOA components shown in Fig. 4b highlight this point. Such variations are likely a complex combina-tion of both atmospheric/chemical processes and instrumen-tal variability from flight to flight (and also within a sin-gle flight). Ng et al. (2009) show the same phenomenon in their multiple ground-based dataset. In order to test whether the mass fractions of LV-OOA and SV-OOA can replicate the evolution in the m/z 44:OM ratio, correlation coeffi-cients for each flight are calculated. The LV-OOA organic mass fraction andm/z44:OM have a correlation coefficient ranging from 0.55–0.98 across the dataset (see Supplemen-tary Material Fig. S11; http://www.atmos-chem-phys.net/10/ 4065/2010/acp-10-4065-2010-supplement.pdf). This indi-cates that the dataset can reproduce the evolution in the OM
by comparing the relative concentrations of the LV-OOA and SV-OOA components. Thus the retrieved factors reflect the continuity of processing by increased oxidation in the atmo-sphere, consistent with the processing paradigm proposed by Jimenez et al. (2009).
5 Evolution of the organic aerosol component 5.1 Transformation across Europe during a
anticyclonic case study
The LONGREX-2 period presents an opportunity to probe the evolution of the chemical composition across the re-gional scale due to the consistent meteorological situa-tion and reduced influence of wet deposisitua-tion. Geopo-tential height fields and air mass back trajectories dur-ing the period are included in Supplementary Material Sect. 2, Fig. S3 (http://www.atmos-chem-phys.net/10/4065/ 2010/acp-10-4065-2010-supplement.pdf). The flight opera-tions conducted during the period are summarised in Fig. 6a, where absolute mass concentrations between 250–2500 m are shown as a function of longitude. Points above 2500 m were generally outside of the boundary layer so are not in-cluded. Points lower than 250 m are omitted due to the for-mation of shallow layers over the sea surface decoupled from the atmosphere above. These were frequently encountered in marine regions sampled in this study. Such features, while interesting, are considered unrepresentative of the evolution of the chemical composition on the European scale. The air-craft flew on a roughly east-to-west transect across Northern Europe over the course of 4 days. At longitudes between 20 E and 25 E, concentrations were typically low (≈1 µg sm−3for
sulphate and organics) and constituted background condi-tions relative to the other locacondi-tions sampled. Concentracondi-tions of both organic and inorganic species increased substantially to the west, with concentrations in the range of 3–7 µg sm−3
at the 75–95th percentiles, reflecting the increased density of anthropogenic sources encountered. The longitudinal gra-dients reveal that the median and the Inter Quartile Range (IQR) of the OM concentration is relatively constant west of 15 E, with concentrations typically between 3–5 µg sm−3.
1.0 0.8 0.6 0.4 0.2 0.0
LV-OOA Organic Mass Fraction
-15 to -10 -10 to -5 -5 to 0 0 to 5 5 to 10 10 to 15 15 to 20 20 to 25 Longitude (ºE)
200
160
120
80
40
0
OM:
∆
CO (µg sm
-3
ppm
-1
)
8
6
4
2
0
Mass Concentration (µg sm
-3 )
a.
b.
Nitrate Sulphate Organics
Approximate air mass transport
Fig. 6. Boxplot summary statistics of aerosol chemical composition as a function of longitude during LONGREX-2, where the air mass
transport was approximately east-to-west. (a)Summarises the concentrations for nitrate, sulphate and organics. (b)Presents the LV-OOA organic mass fraction (left) and the OM:1CO ratio (right). Crosses represent the mean value, while horizontal lines represent the 25th, 50th
and 75th percentiles. The whiskers represent the 5th and 95th percentiles. Values are for altitudes between 250–2500 m.
Europe, with peak emissions of these emissions occurring in North-Western Europe (e.g. Reis et al., 2009). This is espe-cially true in terms of ammonia, which is more readily avail-able in Western Europe compared to further east due to in-tensive agricultural activities. The contrast with OM reflects this source distribution. Additionally, their differing forma-tion and processing time scales discussed in Sect. 4.3 likely play a role.
In terms of the chemical evolution of the OM, this period highlights the highly dynamic nature of the OM burden and is shown in Fig. 6b. In the background conditions to the east, the LV-OOA dominates, with a median mass fraction of close to 90%. Between 15 E and 20 E, where OM concentrations sharply increase, the LV-OOA mass fraction is highly vari-able due to the transition from background to more polluted conditions. The enhanced OM concentrations are driven by the SV-OOA component, as more freshly formed material is encountered as the aircraft travels westwards. This input of fresher material continues further to the west as the SV-OOA fraction increases (decreasing LV-OOA fraction), which is consistent with the urban source distribution in continental Europe. The LV-OOA fraction is then relatively constant as far west as 10 W. West of this, over the Eastern Atlantic Ocean, LV-OOA undergoes a marked increase with the me-dian and 75th percentiles being 65% and 80% respectively. This increase in the LV-OOA reflects the lack of fresh pol-lution contributing to new SV-OOA formation and is
coinci-dent with an increase in the median concentration of ozone beyond the zero meridian line, from 60 ppb to 80 ppb, which is suggestive of photochemical processing within the high pressure system. Based upon the aforementioned back tra-jectories, this represents approximately one day of air mass transit. A key observation during the LONGREX-2 period is the relationship between the LV-OOA mass fraction and the OM:1CO ratio shown in Fig. 6b (where 1CO
corre-ponds to CO minus the background value), with the enhance-ment in the OM:1CO ratio from a median value of
approx-imately 20 µg sm−3ppm−1to over 100 µg sm−3ppm−1west
of 15 E occurring upon the addition of SV-OOA mass which enhances the OM concentrations. These values then decrease west of the meridian to 60–100 µg sm−3ppm−1 as the
LV-OOA mass fraction becomes more dominant and OM con-centrations decrease slightly. De Gouw and Jimenez (2009) reported OM:1CO ratio’s for urban emissions containing large amounts of SOA in the range of approximately 50– 90 µg sm−3ppm−1 in North America and Tokyo. Thus the
values reported here tend towards greater values or even ex-ceed those reported previously. The measurements presented here are close to those reported for the highly polluted Po Valley region in Northern Italy described in Crosier et al. (2007).
constituents in the form of ammonium nitrate and ammo-nium sulphate, which evolve on differing time scales during this period.
5.2 Transformation with respect to distance from source and photochemical processing
The broadly similar transport patterns prevalent throughout the dataset (i.e. sampling of European air masses at dis-tances both upwind, over continental Europe itself and at varying scales downwind) provides the potential to link the evolution of the aerosol chemical composition across this large range of spatial scales. The flight operations can be characterised according to the CO:NOxand O3:NOxratios,
which are qualitatively used as proxies for proximity to ma-jor sources and photochemical processing. The O3:NOx
ra-tio is shown versus the CO:NOxratio in Fig. 7c, indicating
good first order agreement between their respective evolu-tions. In urban areas, CO concentrations are typically 5– 15 times NOxconcentrations (e.g. Parrish et al., 2009) due to
enhanced NOx emissions associated with primary
combus-tion sources. Furthermore, on urban-to-near-urban scales, NOx levels are enhanced relative to O3 due to titration by
NO. This yields an O3:NOxratio less than 1, thus this range
in O3:NOxand CO:NOxis classified as near-urban.
Subse-quent dilution and photochemistry downwind of urban emis-sions will lead to an enhancement in the ratios, as NOx is
oxidised to form HNO3 and PAN on a time scale of a few
hours (e.g. Neuman et al., 2009). This evolution is charac-terised by ratio values between 1 and 100, where O3
con-centrations steadily increase (see Supplementary Material Sect. 4, Fig. S5; http://www.atmos-chem-phys.net/10/4065/ 2010/acp-10-4065-2010-supplement.pdf). This increase in O3 and decrease in NOx is characteristic of
photochemi-cal activity. Furthermore, across this range of O3:NOx, CO
tends to steadily decrease, indicative of dilution downwind of its major sources. The 1–10 O3:NOx is chosen as the
near-source range as the CO concentrations are similar to those at less than 1, while O3 levels are steadily
increas-ing from their minimum value close to urban sources. The 10–100 O3:NOx range is then split between near-outflow
and far-outflow regimes, principally based upon its gradi-ent across the LONGREX-2 period (not shown) where it in-creased above 50 at longitudes to the west of 10W. Values greater than 100 are characteristic of background conditions, with reduced O3, CO and NOxconcentrations indicative of
dilution.
The O3:NOxratio is used to characterise the flights as both
measurements were available on all flights, whereas CO was absent during ADIENT-2. The results of this grouping are shown in Fig. 7 by contrasting the evolution from near-source conditions, predominantly over polluted regions of continen-tal Europe and the associated near-field and far-field outflow from it. Also shown are the background conditions encoun-tered, which were predominantly encountered in the Baltic
Sea region, for a contrast with the more polluted regimes. The near-urban points are not included as too few were sam-pled to yield a statistically robust summary.
The analysis indicates that under polluted and highly pho-tochemically active conditions at near-source locations, am-monium nitrate and OM are the dominant chemical com-ponents. Concentrations range from 4.5–10.0 µg sm−3 and
4.0–6.5 µg sm−3at the 50–95th percentile levels respectively.
The upper percentile dominance of nitrate diminishes with increasing distance from source but it still maintains a sig-nificant fraction of the sub-micron mass, with concentrations comparable to sulphate. OM is the dominant component at all scales outside of the most polluted conditions, where ni-trate is dominant. The estimated HOA mass fraction is typi-cally between 5–15% at the 25–75th percentile levels across the range of conditions sampled. The composition of the OOA evolves strongly as a function of the O3:NOx ratio,
with the LV-OOA fraction making up 50–65% of the OM at the 25–75th percentile levels close to source, through to 60–80% of the OM in the far-field outflow. In background conditions, LV-OOA makes up close to 90% of the OM at the 75th percentile and is at 100% at the 95th percentile. These features are reflected in the colouring of the Fig. 7c, with the LV-OOA increasing as a function of CO:NOx and
O3:NOx. The two apparent lines in the relationship are
prin-cipally a consequence of the enhanced pollutant concentra-tions in LONGREX-1 (the lower line), during which NOx
and CO were enhanced thus the O3:NOx is shifted
down-wards relative to the other periods shown. The LV-OOA or-ganic mass fraction captures this change as the LONGREX-1 OM is more dominated by SV-OOA (reduced LV-OOA frac-tion).
The results show that significant OM concentrations are rapidly formed under polluted conditions in continental Eu-rope and that these concentrations are maintained upon ad-vection downwind of the major sources in Europe. Much of the enhanced mass in Europe is associated with an increase in the SV-OOA fraction but a significant fraction is associ-ated with LV-OOA, which is indicative of rapid photochemi-cal processing of the OM on the regional sphotochemi-cale. The median LV-OOA fraction is always greater than the SV-OOA frac-tion and the LV-OOA mass fracfrac-tion steadily increases upon advection downwind.
OOA across Europe was frequently well correlated with ammonium nitrate and ammonium sulphate, both of which likely originate from anthropogenic sources. Furthermore, OOA is correlated with O3:NOx, again suggestive of an
10
8
6
4
2
0
Mass Concentration (µg sm
-3)
Near-source Near-outflow Far-outflow Background
1.0
0.8
0.6
0.4
0.2
0.0
Organic mass fraction
Near-source Near-outflow Far-outflow Background
0.1 1 10 100 1000
O3
:NO
x
100 101 102 103 104
CO:NOx
1.0 0.8 0.6 0.4
LV-OOA organic mass fraction Nitrate Sulphate Organics
LV-OOA HOA a.
b.
c.
Near-urban Near-source Near-outflow Far-outflow Background
Fig. 7.Boxplot summary statistics of aerosol chemical composition as a function of proximity to source and photochemical processing.(a)
Summarises the concentrations for nitrate, sulphate and organics, while(b)presents the organic mass fractions of LV-OOA and estimated HOA. Crosses represent the mean value, while horizontal lines represent the 25th, 50th and 75th percentiles. The whiskers represent the 5th and 95th percentiles. Values in (a) and (b) are for altitudes between 250–2500 m.(c)Summary of the relationship between the O3:NOxratio
and the CO:NOxratio for the dataset except for ADIENT-2 where no CO measurement was available. The grey horizontal lines designate
the boundaries of the source proximities based upon the O3:NOxratio which are used in (a) and (b). The points are coloured according to
the LV-OOA organic mass fraction.
carbon dominated in rural areas, which suggests a biogenic source. However, measurements in urban plumes and closer to major anthropogenic sources have indicated that anthro-pogenic Volatile Organic Compounds (VOCs) are the main source of OM (e.g. de Gouw et al., 2005, 2008; Bahreini et al., 2009). Furthermore, the presence of both signifi-cant anthropogenic and biogenic sources in Northern Europe could mean that the OOA results from a mixture of both an-thropogenic and biogenic sources and/or that enhanced bio-genic SOA is formed in the presence of anthropobio-genic pol-lution, which has previously been identified in the south-eastern United States (Weber et al., 2007; Goldstein et al., 2009). However, the current study lacks suitable informa-tion regarding gas-phase organic precursors and/or addiinforma-tional OM chemical information to separate the different contribu-tions of biogenic and anthropogenic to the total observed OM from the observations alone.
Enhanced SV-OOA concentrations in North-Western Eu-rope are strongly coupled to ammonium nitrate concentra-tions, which are regularly observed to peak at the top of the boundary layer. This is prescribed to partitioning of semi-volatile gas phase precursors to the particle phase at reduced temperature and enhanced relative humidity (e.g. Morino
et al., 2006; Morgan et al., 2009). These observations are discussed in Morgan et al. (2010) in the EUCAARI special issue.
6 Conclusions
The spatial distribution of sub-micron aerosol chemical com-position has been characterised based upon airborne mea-surements in the planetary boundary layer across Europe, north of the Alpine regions. Organic Matter (OM) and am-monium nitrate are the largest components, typically con-tributing 20–50% each to the non-refractory mass. Am-monium nitrate dominates in North-Western Europe where the emissions of NOx and ammonia reach their maximum.
Ammonium nitrate dominates the infreqeunt but highly pol-luted periods sampled with concentrations ranging from 4– 8 µg sm−3at the 75–95th percentile levels. This is
regional non-refractory particulate mass burden. Considera-tion of OM and ammonium nitrate in modelling assessments of the impact of atmospheric aerosol in Europe is evidently required. The measurements presented here provide a useful test for regional and global aerosol models, due to the con-trasting distributions of the OM components and inorganic components across the significant spatial and temporal scales sampled.
A positive matrix factorisation analysis of the OM com-ponent was conducted, revealing the dominance of Oxi-dised Organic Aerosol (OOA) over Hydrocarbon-like Or-ganic Aerosol (HOA), which is consistent with previous lit-erature (Zhang et al., 2007). This dominance meant that the HOA component was difficult to separate from the OOA in a robust manner across the dataset. An empirical esti-mate based upon previous research indicated that HOA con-tributes less than 15% to the OM burden. Two factor so-lutions were found to be the most robust characterisation of the OM burden. Two separate OOA components were identified; one representing an aged-more oxidised organic aerosol and another representing fresher-less oxidised or-ganic aerosol. These factors closely resemble those derived in ground-based global AMS datasets (Jimenez et al., 2009; Ng et al., 2009) where the less oxidised factor is associated with Semi-Volatile OOA (SV-OOA) and the more oxidised factor is found in the Low-Volatility OOA (LV-OOA) frac-tion. The OM chemical composition and the associated OOA factors derived for each flight were highly variable in terms of their oxygen content, based upon normalised organic sig-nal intensities atm/z44 and 43. When combined, the OM data and factors can be viewed as a continuum with a pro-gression from a less oxidised, more-volatile component to a highly oxidised, less-volatile component. This progression was observed to occur as a function of the distance from source, with more oxidised components dominating further downwind. During highly polluted conditions in North-Western Europe, the SV-OOA displayed strong coupling to ammonium nitrate, indicative of gas-to-particle partitioning of semi-volatile components. Highly active photochemical conditions encountered during the study meant that LV-OOA was the largest OM component at all locations and this dom-inance increased with distance from source. In background conditions, LV-OOA made up more than 80% of the OM bur-den. This evolution is consistent with the recent paradigm proposed by Jimenez et al. (2009).
The processes identified in this work result in the build up of significant amounts of anthropogenically influenced aerosol downwind of major source regions with total sub-micron mass loadings from the AMS exceeding 15 µg sm−3
with OM and ammonium nitrate being the dominant chem-ical components. Such concentrations have the capacity to significantly perturb regional weather and climate.
Acknowledgements. This work is supported by NERC
ADI-ENT project NE/E011101/1 and EUCAARI project 036833-2. W. T. Morgan was supported by a Natural Environment Research Council (NERC) studentship NER/S/A/2006/14040 and a CASE sponsorship from Aerodyne Research Inc. The NERC National Centre for Atmospheric Science (NCAS) Facility for Ground based Atmospheric Measurements (FGAM) supported the maintenance of the cToF-AMS. NCAS also supported the development of the data interpretation methods employed here through its Composition Directorate. Many thanks to Ingrid Ulbrich (University of Colorado at Boulder, USA) for providing and supporting the PMF toolkit. Thanks to the British Atmospheric Data Centre (BADC) for the calculation of trajectories and access to European Centre for Medium-Range Weather Forecasts (ECMWF) Operational Anal-ysis data, available from http://badc.nerc.ac.uk/data/ecmwf-op/. We thank A. M. Middlebrook for the AMS collection efficiency algorithm. We also thank F. Abicht, C. L. McConnell, A. Minikin, T. Hamburger and A. Stohl for their major contributions to the project. We thank the FAAM, the Met Office, Avalon, DLR-Falcon and DirectFlight personnel for their contributions to the campaign. In memory of Keith Drummond, without whom the flying circus would never have got off the ground.
Edited by: O. Hov
References
Aiken, A. C., Decarlo, P. F., Kroll, J. H., Worsnop, D. R., Huff-man, J. A., Docherty, K. S., Ulbrich, I. M., Mohr, C., Kimmel, J. R., Sueper, D., Sun, Y., Zhang, Q., Trimborn, A., Northway, M., Ziemann, P. J., Canagaratna, M. R., Onasch, T. B., Alfarra, M. R., Prevot, A. S. H., Dommen, J., Duplissy, J., Metzger, A., Baltensperger, U., and Jimenez, J. L.: O/C and OM/OC ra-tios of primary, secondary, and ambient organic aerosols with high-resolution time-of-flight aerosol mass spectrometry, Envi-ron. Sci. Technol., 42, 4478–4485, 2008.
Aiken, A. C., Salcedo, D., Cubison, M. J., Huffman, J. A., DeCarlo, P. F., Ulbrich, I. M., Docherty, K. S., Sueper, D., Kimmel, J. R., Worsnop, D. R., Trimborn, A., Northway, M., Stone, E. A., Schauer, J. J., Volkamer, R. M., Fortner, E., de Foy, B., Wang, J., Laskin, A., Shutthanandan, V., Zheng, J., Zhang, R., Gaffney, J., Marley, N. A., Paredes-Miranda, G., Arnott, W. P., Molina, L. T., Sosa, G., and Jimenez, J. L.: Mexico City aerosol analysis during MILAGRO using high resolution aerosol mass spectrometry at the urban supersite (T0) – Part 1: Fine particle composition and organic source apportionment, Atmos. Chem. Phys., 9, 6633– 6653, 2009,
http://www.atmos-chem-phys.net/9/6633/2009/.
Alfarra, M. R., Coe, H., Allan, J. D., Bower, K. N., Boudries, H., Canagaratna, M. R., Jimenez, J. L., Jayne, J. T., Garforth, A. A., Li, S. M., and Worsnop, D. R.: Characterization of urban and ru-ral organic particulate in the lower Fraser valley using two aero-dyne aerosol mass spectrometers, Atmos. Environ., 38, 5745– 5758, 2004.
Allan, J. D., Delia, A. E., Coe, H., Bower, K. N., Alfarra, M. R., Jimenez, J. L., Middlebrook, A. M., Drewnick, F., Onasch, T. B., Canagaratna, M. R., Jayne, J. T., and Worsnop, D. R.: A gen-eralised method for the extraction of chemically resolved mass spectra from aerodyne aerosol mass spectrometer data, J. Aerosol Sci., 35, 909–922, 2004.
Andreae, M. and Crutzen, P.: Atmospheric aerosols: Biogeochem-ical sources and role in atmospheric chemistry, Science, 276, 1052–1058, 1997.
Bahreini, R., Ervens, B., Middlebrook, A. M., Warneke, C., de Gouw, J. A., DeCarlo, P. F., Jimenez, J. L., Brock, C. A., Neuman, J. A., Ryerson, T. B., Stark, H., Atlas, E., Brioude, J., Fried, A., Holloway, J. S., Peischl, J., Richter, D., Walega, J., Weibring, P., Wollny, A. G., and Fehsenfeld, F. C.: Organic aerosol formation in urban and industrial plumes near Hous-ton and Dallas, Texas, J. Geophys. Res., 114, D00F16, doi: 10.1029/2008JD011493, 2009.
Bates, T. S., Quinn, P. K., Coffman, D. J., Johnson, J. E., and Mid-dlebrook, A. M.: Dominance of organic aerosols in the marine boundary layer over the Gulf of Maine during NEAQS 2002 and their role in aerosol light scattering, J. Geophys. Res.-Atmos., 110, doi:10.1029/2005JD005797, d18202, 2005.
Baumgardner, D., Kok, G., and Raga, G.: Warming of the Arctic lower stratosphere by light absorbing particles, Geophys. Res. Lett., 31, l06117, doi:10.1029/2003GL018883, 2004.
Baumgardner, D., Grutter, M., Allan, J., Ochoa, C., Rappenglueck, B., Russell, L. M., and Arnott, P.: Physical and chemical proper-ties of the regional mixed layer of Mexico’s Megapolis, Atmos. Chem. Phys., 9, 5711–5727, 2009,
http://www.atmos-chem-phys.net/9/5711/2009/.
Bench, G., Fallon, S., Schichtel, B., Malm, W., and McDade, C.: Relative contributions of fossil and contemporary carbon sources to PM2.5aerosols at nine Interagency Monitoring for Protection
of Visual Environments (IMPROVE) network sites, J. Geophys. Res., 112, D10205, doi:10.1029/2006JD007708, 2007.
Brock, C. A., Sullivan, A. P., Peltier, R. E., Weber, R. J., Wollny, A., Gouw, J. A., Middlebrook, A. M., Atlas, E. L., Stohl, A., Trainer, M. K., Cooper, O. R., Fehsenfeld, F. C., Frost, G. J., Holloway, J. S., Hubler, G., Neuman, J. A., Ryerson, T. B., Warneke, C., and Wilson, J. C.: Sources of particulate matter in the northeast-ern United States in summer: 2. Evolution of chemical and mi-crophysical properties, J. Geophys. Res.-Atmos., 113, d08302, doi:10.1029/2007JD009241, 2008.
Canagaratna, M. R., Jayne, J. T., Jimenez, J. L., Allan, J. D., Al-farra, M. R., Zhang, Q., Onasch, T. B., Drewnick, F., Coe, H., Middlebrook, A., Delia, A., Williams, L. R., Trimborn, A. M., Northway, M. J., DeCarlo, P. F., Kolb, C. E., Davidovits, P., and Worsnop, D. R.: Chemical and microphysical characterization of ambient aerosols with the aerodyne aerosol mass spectrome-ter, Mass Spectrometry Reviews, 26, 185–222, 2007.
Capes, G., Johnson, B., McFiggans, G., Williams, P. I., Haywood, J., and Coe, H.: Aging of biomass burning aerosols over West Africa: Aircraft measurements of chemical composition, mi-crophysical properties, and emission ratios, J. Geophys. Res.-Atmos., 113, D00C15cro, doi:10.1029/2008JD009845, 2008. Charlson, R. J., Schwartz, S. E., Hales, J. M., Cess, R. D., Coakley,
J. A., Hansen, J. E., and Hofmann, D. J.: Climate Forcing by Anthropogenic Aerosols, Science, 255, 423–430, 1992. Crosier, J., Allan, J. D., Coe, H., Bower, K. N., Formenti, P., and
Williams, P. I.: Chemical composition of summertime aerosol in the Po Valley (Italy), northern Adriatic and Black Sea, Q. J. Roy. Meteorol. Soc., 133, 61–75, 2007.
Cross, E. S., Slowik, J. G., Davidovits, P., Allan, J. D., Worsnop, D. R., Jayne, J. T., Lewis, D. K., Canagaratna, M., and Onasch, T. B.: Laboratory and Ambient Particle Density Determinations using Light Scattering in Conjunction with Aerosol Mass Spec-trometry, Aerosol Sci. Technol., 41, 343–359, 2007.
De Gouw, J. and Jimenez, J. L.: Organic Aerosols in the Earth’s At-mosphere, Environ. Sci. Technol., 43, 7614–7618, doi:10.1021/ es9006004, 2009.
de Gouw, J., Middlebrook, A., Warneke, C., Goldan, P., Kuster, W., Roberts, J., Fehsenfeld, F., Worsnop, D., Canagaratna, M., Pszenny, A., Keene, W., Marchewka, M., Bertman, S., and Bates, T.: Budget of organic carbon in a polluted atmosphere: Results from the New England Air Quality Study in 2002, J. Geophys. Res.-Atmos., 110, D16305, doi:10.1029/2004JD005623, 2005. de Gouw, J. A., Brock, C. A., Atlas, E. L., Bates, T. S., Fehsenfeld,
F. C., Goldan, P. D., Holloway, J. S., Kuster, W. C., Lerner, B. M., Matthew, B. M., Middlebrook, A. M., Onasch, T. B., Peltier, R. E., Quinn, P. K., Senff, C. J., Stohl, A., Sullivan, A. P., Trainer, M., Warneke, C., Weber, R. J., and Williams, E. J.: Sources of particulate matter in the northeastern United States in summer: 1. Direct emissions and secondary formation of organic matter in urban plumes, J. Geophys. Res.-Atmos., 113, D08301, doi: 10.1029/2007JD009243, 2008.
DeCarlo, P. F., Kimmel, J. R., Trimborn, A., Northway, M. J., Jayne, J. T., Aiken, A. C., Gonin, M., Fuhrer, K., Horvath, T., Docherty, K. S., Worsnop, D. R., and Jimenez, J. L.: Field-deployable, high-resolution, time-of-flight aerosol mass spectrometer, Anal. Chem., 78, 8281–8289, 2006.
Denman, K., Brasseur, G., Chidthaisong, A., Ciais, P., Cox, P., Dickinson, R., Hauglustaine, D., Heinze, C., Holland, E., Jacob, D., Lohmann, U., Ramachandran, S., Dias, P. d. S., Wofsy, S., and Zhang, X.: Couplings Between Changes in the Climate Sys-tem and Biogeochemistry, Climate Change 2007: The Physical Science Basis. Contribution of Working Group I to the Fourth Assessment Report of the Intergovernmental Panel on Climate Change, Cambridge University Press, Cambridge, United King-dom and New York, NY, USA, 2007.
Docherty, K. S., Stone, E. A., Ulbrich, I. M., DeCarlo, P. F., Snyder, D. C., Schauer, J. J., Peltier, R. E., Weber, R. J., Murphy, S. N., Seinfeld, J. H., Grover, B. D., Eatough, D. J., and Jiimenez, J. L.: Apportionment of Primary and Secondary Organic Aerosols in Southern California during the 2005 Study of Organic Aerosols in Riverside (SOAR-1), Environ. Sci. Technol., 42, 7655–7662, 2008.
Donahue, N. M., Robinson, A. L., Stanier, C. O., and Pandis, S. N.: Coupled partitioning, dilution, and chemical aging of semivolatile organics, Environ. Sci. Technol., 40, 2635–2643, 2006.
Donahue, N. M., Robinson, A. L., and Pandis, S. N.: Atmospheric organic particulate matter: From smoke to secondary organic aerosol, Atmos. Environ., 43, 94–106, 2009.