Influence of the
PNPLA3
rs738409
Polymorphism on Non-Alcoholic Fatty Liver
Disease and Renal Function among Normal
Weight Subjects
Kentaro Oniki1, Junji Saruwatari1*, Tomoko Izuka1, Ayami Kajiwara1, Kazunori Morita1, Misaki Sakata1, Koji Otake2, Yasuhiro Ogata2, Kazuko Nakagawa1,3
1Division of Pharmacology and Therapeutics, Graduate School of Pharmaceutical Sciences, Kumamoto University, Kumamoto, Japan,2Japanese Red Cross Kumamoto Health Care Center, Kumamoto, Japan,
3Center for Clinical Pharmaceutical Sciences, Kumamoto University, Kumamoto, Japan
Abstract
In normal weight subjects (body mass index<25 kg/m2), non-alcoholic fatty liver disease (NAFLD) is likely to coexist with metabolic diseases. Thepatatin-like phospholipase 3 (PNPLA3)polymorphism rs738409 (c.444C>G) is associated with the risk of NAFLD and/or renal dysfunction; however, the influence of the weight status on the associations remains unknown. We aimed to clarify the associations of thePNPLA3polymorphism with the risk of NAFLD and/or renal dysfunction, while also paying careful attention to the weight status of the subjects. Cross-sectional and retrospective longitudinal studies with 5.5±1.1 years of follow-up were conducted in 740 and 393 Japanese participants (61.2±10.5 and 67.5±6.0 years), respectively, during a health screening program. Among 591 subjects who did not have a habitual alcohol intake and/or hepatitis B or C virus infections, thePNPLA3G/G genotype was associated with the risk for NAFLD in normal weight subjects [odds ratio (95% CI): 3.06 (1.11–8.43),P<0.05]. Among all subjects, carriers of thePNPLA3G/G genotype with a nor-mal weight had a lower eGFR than those of the C/C genotype [partial regression coefficient (SE): -3.26 (1.48),P<0.05]. These associations were replicated in the longitudinal analyses. Among the overweight subjects, none of the genotypes were significantly associated in the cross-sectional and longitudinal analyses; however, the power of the analyses was small, especially in the analyses among overweight subjects. The findings of this study suggest that carriers of thePNPLA3G/G genotype with a normal weight status should nevertheless be carefully monitored for the presence of NAFLD and/or renal dysfunction.
Introduction
Non-alcoholic fatty liver disease (NAFLD) is a major health problem because the prevalence is increasing worldwide and the presence is an early predictor of future type 2 diabetes, OPEN ACCESS
Citation:Oniki K, Saruwatari J, Izuka T, Kajiwara A, Morita K, Sakata M, et al. (2015) Influence of the
PNPLA3rs738409 Polymorphism on Non-Alcoholic Fatty Liver Disease and Renal Function among Normal Weight Subjects. PLoS ONE 10(7): e0132640. doi:10.1371/journal.pone.0132640
Editor:Silvia C. Sookoian, Institute of Medical Research A Lanari-IDIM, University of Buenos Aires-National Council of Scientific and Technological Research (CONICET), ARGENTINA
Received:April 16, 2015
Accepted:June 16, 2015
Published:July 22, 2015
Copyright:© 2015 Oniki et al. This is an open access article distributed under the terms of the
Creative Commons Attribution License, which permits unrestricted use, distribution, and reproduction in any medium, provided the original author and source are credited.
Data Availability Statement:All relevant data are within the paper and its Supporting Information files.
cardiovascular disease (CVD) and chronic kidney disease (CKD) [1–3]. Obesity is strongly associated with the development and progression of NAFLD [1–4], however, NAFLD can also be observed in subjects with a normal weight status [body mass index (BMI)<25 kg/m2] [5, 6]. Particularly in Asians, a high percentage of the patients with NAFLD have been found to have a normal weight status (15%–21%) and they appear to have different characteristics com-pared to overweight or obese patients (i.e., the differential distribution of visceral adipose tis-sue, recent increase in body weight and intake of high cholesterol diet and peculiar genetic background) [5]. A WHO expert consultation also suggested that Asians generally have a higher percentage of body fat than white people of the same age, sex, and BMI, and the propor-tion of Asian people with risk factors for type 2 diabetes and cardiovascular disease is substan-tial even below the existing WHO BMI cut-off point of 25 kg/m2[7]. Feng et al. reported that normal weight subjects are more likely to have diabetes, hypertension and metabolic syndrome if they have NAFLD, thus suggesting that the normal weight individuals with NAFLD should be monitored more carefully than overweight or obese individuals with NAFLD [6].
The rs738409 polymorphism (encoding I148M) in thepatatin-like phospholipase 3 (PNPLA3) gene has been consistently recognized to be a major genetic factor for the develop-ment of NAFLD and advanced liver diseases, including steatohepatitis, cirrhosis and hepatocel-lular carcinoma [8–13]. PNPLA3 is expressed in the liver and adipose tissue and has acyl hydrolase activity [14]. The rs738409 polymorphism has been associated with the loss of the protein’s hydrolyzing function and with the hepatic triglyceride accumulation [14]. However, the effect of the subject weight status on the relationship between thePNPLA3polymorphism and the susceptibility to NAFLD remains unknown.
A recent meta-analysis demonstrated that both the presence and severity of NAFLD were associated with an increased development and severity of CKD [15]. Furthermore, experimen-tal and epidemiological studies have suggested that NAFLD and CKD share common patho-genic mechanisms [16,17]. Musso et al. recently suggested that the presence of thePNPLA3 rs738409 polymorphism was associated with a lower estimated glomerular filtration rate (eGFR) and a higher prevalence of microalbuminuria and chronic kidney disease through a cross-sectional study [18], however, there is presently no data available regarding the longitudi-nal influence ofPNPLA3polymorphism on the renal function, including the relationship to weight status.
The primary objective of this exploratory cross-sectional and longitudinal study is to inves-tigate the relationships of thePNPLA3genotype with the risk for NAFLD and decline in the renal function among Japanese subjects, while also paying careful attention to the weight status of the subjects.
Materials and Methods
Subjects and study protocol
A cross-sectional case-control analysis was conducted among 740 subjects (478 males and 262 females, mean age: 61.2 ± 10.5 years) who were Japanese participants of the health screening program in the Japanese Red Cross Kumamoto Health Care Center between May 2003 and April 2012. Among these patients, a retrospective longitudinal analysis with 5.5 ± 1.1 [5.0 (1.0– 6.0)] (mean ± SD [median (range)]) years of follow-up was performed in 393 subjects (238 males and 156 females, mean age at baseline: 67.5 ± 6.0 years) for whom longitudinal medical information could be collected between January 2006 and April 2012. The subjects with a habitual alcohol intake (consuming more than 30 g/day of alcohol in males and 20 g/day in females) and/or with positive serological tests for hepatitis B and C viruses were excluded according to the practical guidelines previously reported [19] on the analysis regarding the risk Competing Interests:The authors have declared
for NAFLD. This study protocol was approved by the ethics committees of the Faculty of Life Sciences, Kumamoto University and the Japanese Red Cross Kumamoto Health Care Center. All of the subjects provided their written informed consent prior to enrollment in the study.
Measurements
The clinical information was recorded at each follow-up visit, i.e., at yearly intervals, although not all participants visited the center annually. The laboratory tests were performed using the standard methods of the Japan Society of Clinical Chemistry. The information regarding the alcohol intake and smoking habits was obtained via face-to-face interviews with health care providers. The BMI cut-off point (overweight) for health risk in different Asian populations varies from 22 kg/m2to 25 kg/m2[7]. Lowering of the cutoff values was indicated in Hong Kong Chinese, Indonesians, and Singaporeans, but not in northern Chinese and Japanese patients [7]. Therefore, a normal weight and overweight status were defined as BMI<25 kg/m2
and BMI25 kg/m2, respectively, in the present study. Hepatic ultrasonography scanning was used to diagnose fatty liver disease (FLD). FLD was diagnosed according to the following four criteria: a diffuse hyperechoic echotexture (bright liver), an increased echotexture in com-parison to the kidneys, vascular blurring and deep attenuation [20]. The diagnosis of FLD was performed by the radiographer. A medical doctor then reviewed the images to evaluate the accuracy and reproducibility of the diagnosis. The FIB4 index is expected to be useful for evalu-ating hepatic fibrosis in NAFLD patients [21]. The values of the FIB4 index of the NAFLD subjects were calculated from the patients’age, platelet counts, values of aspartate aminotrans-ferase (AST) and alanine aminotransaminotrans-ferase (ALT) using the following equation: [age × AST (IU/L)] / [(platelet count (109) ×pALT (IU/L)], and the cut-off point of2.67 for hepatic fibrosis was used [21]. The eGFR of each patient was calculated from the serum creatinine (SCr) level, age and gender using the following Japanese eGFR equation determined by the Japanese Society of Nephrology: eGFR (ml min-11.73m-2) = 194×SCr (mg/dl)−1.094× age−0.287(×0.739 if female) [22]. Diabetes was diagnosed based on the patients’past history and the criteria recom-mended by the Expert Committee of the American Diabetes Association. Dyslipidemia was defined as a value of triglycerides (TG)150 mg/dL, high-density lipoprotein cholesterol (HDL-C)<40 mg/dL or low-density lipoprotein cholesterol (LDL-C)140 mg/dL.
Hyperten-sion was defined as a systolic blood pressure (BP)140 mmHg, a diastolic BP90 mmHg or a history of hypertension.
Genotyping
Genomic DNA was extracted from the whole blood using a DNA purification kit (FlexiGene DNA kit, QIAGEN, Hilden, Germany). ThePNPLA3rs738409 polymorphism (c.444C>G,
encoding I148M) was genotyped by a real-time TaqMan allelic discrimination assay (Applied Biosystems, CA, USA) according to the protocols provided by the manufacturers (assay no. C_7241_10). To ensure the genotyping quality, we included DNA samples as internal controls, hidden samples of a known genotype, and negative controls (water).
Statistical analysis
logistic and linear regression models, respectively, according to the cross-sectional and longitudi-nal alongitudi-nalyses. These associations were measured as the odds ratio (OR) and 95% confidence in-tervals (95% CI) for the risk of NAFLD, and the partial regression coefficient (Β) and standard error (SE) for the degree of fluctuation in the eGFR values. The ORs and B values of multivariable models were adjusted for potentially confounding factors, i.e., gender, diabetes, hypertension, dyslipidemia and fatty liver (only for the analysis of the eGFR values) as nominal variables, and age and BMI as continuous variables. In order to assess the effects of the weight status on the rela-tionships of thePNPLA3genotype with the risk of NAFLD and decline in the eGFR, the study subjects were stratified by the presence of an overweight status at baseline. The interactive effects between thePNPLA3genotype and the presence of an overweight status on the risk of NAFLD and the eGFR values were additionally analyzed. On the longitudinal analyses, the generalized estimating equations approach was used to create the logistic and linear regression models. A value ofP<0.05 was considered to be statistically significant. The statistical power of the
associa-tions between thePNPLA3genotypes and the risk of NAFLD or the value of the eGFR were cal-culated at a significance (alpha) level of 0.05 (two-tailed) according to the sample size of this study using the SPSS Sample Power software program (version 2.0). All other statistical analyses were performed using the SPSS software package (version 17.0, IBM Japan Inc., Tokyo, Japan).
Results
Subjects characteristics
Among all 740 subjects, the frequencies of thePNPLA3C/C, C/G and G/G genotypes were 27.3%, 53.9% and 18.8%, respectively, and the frequencies of the genotype in the study subjects was consistent with previous reports in the Japanese population [23–25]. The observed geno-type frequency distributions were consistent with the Hardy-Weinberg equilibrium (P>0.05).
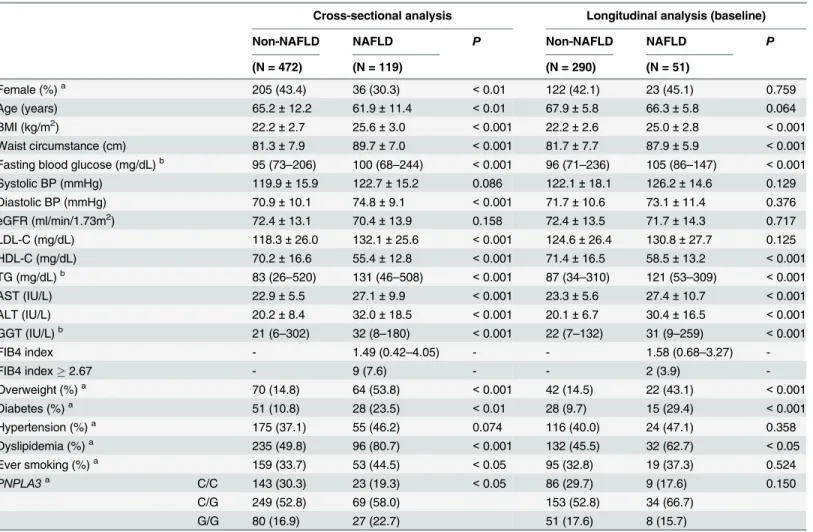
The demographic characteristics of the subjects for the analyses regarding the risk for NAFLD are shown inTable 1. Among the subjects included in the cross-sectional analyses, the mean values of the BMI, waist circumstance, fasting blood glucose, diastolic BP, LDL-C, TG, AST, ALT, gamma-glutamyl transferase (GGT), the prevalence of being overweight, diabetes, dysli-pidemia, ever-smoking status and the frequencies ofPNPLA3C/G or G/G genotypes were sig-nificantly higher in the NAFLD subjects than in the non-NAFLD subjects, whereas the age, HDL-C and the frequency of females were significantly lower (Table 1). Among the subjects included in the longitudinal analyses, the mean values of the BMI, waist circumstance, fasting blood glucose, TG, AST, ALT, GGT, the prevalence of being overweight, diabetes and dyslipi-demia were significantly higher in the NAFLD subjects than in the non-NAFLD subjects at baseline, whereas the value of HDL-C was significantly lower (Table 1). Among the NAFLD subjects in the cross-sectional and longitudinal analyses, the values of the FIB4 index were 1.49 (0.42–4.05), 1.58 (0.68–3.27), respectively, and the frequencies of an FIB4 index2.67 were 7.6% and 3.9%, respectively (Table 1). In addition, the mean values of ALT in the NAFLD subjects were 32.0 ± 18.5 IU/L and 30.4 ± 16.5 IU/L, respectively (Table 1). The clinical charac-teristics of the subjects stratified by weight status are shown inS1 Table. The demographic characteristics did not differ between all 740 subjects and the 393 subjects, except for age (S1
Table). The mean age was greater in the 393 subjects (67.5 ± 6.0 years) than in all 740 subjects
GGT and the prevalence of NAFLD were significantly higher in the subjects with thePNPLA3 C/G and/or G/G genotypes than in those with the C/C genotype (S3 Table). Since 149 subjects in the cross-sectional analysis and 52 subjects in the longitudinal analysis had habitual alcohol intake and/or were hepatitis B or C virus-positive, these subjects were excluded from the analy-ses regarding the risk of NAFLD. The demographic characteristics did not differ among the study subjects before and after excluding those exhibiting habitual alcohol intakes and/or a hepatitis B or C virus-positive status (data not shown).
The effects of the
PNPLA3
genotype and weight status on the risk for
NAFLD
Among the 591 subjects included in the cross-sectional multivariable logistic regression analy-ses of NAFLD, the risk of NAFLD was significantly higher in the subjects with thePNPLA3C/ Table 1. Clinical characteristics of the subjects for the analyses regarding the risk of NAFLD.
Cross-sectional analysis Longitudinal analysis (baseline)
Non-NAFLD NAFLD P Non-NAFLD NAFLD P
(N = 472) (N = 119) (N = 290) (N = 51)
Female (%)a 205 (43.4) 36 (30.3) <0.01 122 (42.1) 23 (45.1) 0.759
Age (years) 65.2±12.2 61.9±11.4 <0.01 67.9±5.8 66.3±5.8 0.064
BMI (kg/m2) 22.2±2.7 25.6±3.0 <0.001 22.2±2.6 25.0±2.8 <0.001
Waist circumstance (cm) 81.3±7.9 89.7±7.0 <0.001 81.7±7.7 87.9±5.9 <0.001 Fasting blood glucose (mg/dL)b 95 (73
–206) 100 (68–244) <0.001 96 (71–236) 105 (86–147) <0.001
Systolic BP (mmHg) 119.9±15.9 122.7±15.2 0.086 122.1±18.1 126.2±14.6 0.129
Diastolic BP (mmHg) 70.9±10.1 74.8±9.1 <0.001 71.7±10.6 73.1±11.4 0.376
eGFR (ml/min/1.73m2) 72.4±13.1 70.4±13.9 0.158 72.4±13.5 71.7±14.3 0.717
LDL-C (mg/dL) 118.3±26.0 132.1±25.6 <0.001 124.6±26.4 130.8±27.7 0.125
HDL-C (mg/dL) 70.2±16.6 55.4±12.8 <0.001 71.4±16.5 58.5±13.2 <0.001
TG (mg/dL)b 83 (26–520) 131 (46–508) <0.001 87 (34–310) 121 (53–309) <0.001
AST (IU/L) 22.9±5.5 27.1±9.9 <0.001 23.3±5.6 27.4±10.7 <0.001
ALT (IU/L) 20.2±8.4 32.0±18.5 <0.001 20.1±6.7 30.4±16.5 <0.001
GGT (IU/L)b 21 (6
–302) 32 (8–180) <0.001 22 (7–132) 31 (9–259) <0.001
FIB4 index - 1.49 (0.42–4.05) - - 1.58 (0.68–3.27)
-FIB4 index2.67 - 9 (7.6) - - 2 (3.9)
-Overweight (%)a 70 (14.8) 64 (53.8) <0.001 42 (14.5) 22 (43.1) <0.001
Diabetes (%)a 51 (10.8) 28 (23.5) <0.01 28 (9.7) 15 (29.4) <0.001
Hypertension (%)a 175 (37.1) 55 (46.2) 0.074 116 (40.0) 24 (47.1) 0.358
Dyslipidemia (%)a 235 (49.8) 96 (80.7) <0.001 132 (45.5) 32 (62.7) <0.05
Ever smoking (%)a 159 (33.7) 53 (44.5) <0.05 95 (32.8) 19 (37.3) 0.524
PNPLA3a C/C 143 (30.3) 23 (19.3) <0.05 86 (29.7) 9 (17.6) 0.150
C/G 249 (52.8) 69 (58.0) 153 (52.8) 34 (66.7)
G/G 80 (16.9) 27 (22.7) 51 (17.6) 8 (15.7)
The data are the means±standard deviation, median (range) for skewed variables, or the numbers of subjects (%) for categorical variables.
aFisher
’s exact test.
bMann
–Whitney U test (otherwise, Student’s t-test was used).
NAFLD, non-alcoholic fatty liver disease; BMI, body mass index; BP, blood pressure; eGFR, estimated glomerularfiltration rate; LDL-C, low-density lipoprotein cholesterol; HDL-C, high-density lipoprotein cholesterol; TG, triglyceride; AST, aspartate aminotransferase; ALT, alanine aminotransferase; GGT, gamma-glutamyl transferase; PNPLA3, patatin-like phospholipase 3.
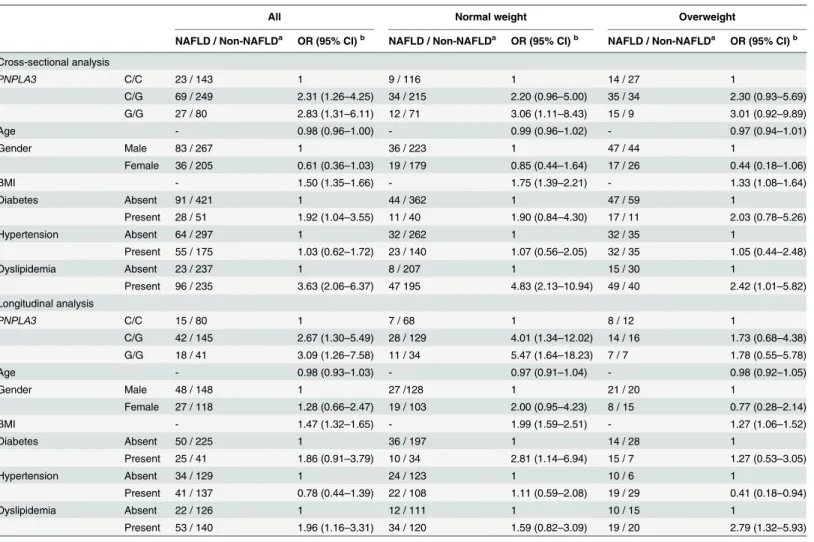
G or G/G genotypes than in those with the C/C genotype [adjusted OR (95% CI): 2.31 (1.26– 4.25) or 2.83 (1.31–6.11), respectively] as well as in the normal weight subjects with thePNPLA3 G/G genotype [adjusted OR (95% CI): 3.06 (1.11–8.43)], whereas the genotypes were not found to show significant associations in the overweight subjects (Table 2). There were no statistically significant interactions between thePNPLA3genotype and the weight status on the risk of NAFLD (P= 0.58).
To verify the results observed in the cross-sectional analyses, we also performed longitudinal multivariable logistic regression analyses among the 341 subjects. The prevalence of NAFLD at baseline and at the endpoint was 15.0% and 22.0%, respectively.Table 2shows the longitudinal association between thePNPLA3genotype and the risk for NAFLD among the 341 subjects, both 277 normal weight and 64 overweight subjects, respectively. Among the 341 subjects, the longitudinal risk for NAFLD was significantly higher in the subjects with thePNPLA3C/G or G/G genotypes than in those with the C/C genotype [adjusted OR (95% CI): 2.67 (1.30–5.49) or 3.09 (1.26–7.58), respectively], and further increased the risk among the normal weight Table 2. The effect of thePNPLA3genotype on the risk of NAFLD identified in the cross-sectional and longitudinal multivariable logistic regres-sion analyses.
All Normal weight Overweight
NAFLD / Non-NAFLDa OR (95% CI)b NAFLD / Non-NAFLDa OR (95% CI)b NAFLD / Non-NAFLDa OR (95% CI)b
Cross-sectional analysis
PNPLA3 C/C 23 / 143 1 9 / 116 1 14 / 27 1
C/G 69 / 249 2.31 (1.26–4.25) 34 / 215 2.20 (0.96–5.00) 35 / 34 2.30 (0.93–5.69)
G/G 27 / 80 2.83 (1.31–6.11) 12 / 71 3.06 (1.11–8.43) 15 / 9 3.01 (0.92–9.89)
Age - 0.98 (0.96–1.00) - 0.99 (0.96–1.02) - 0.97 (0.94–1.01)
Gender Male 83 / 267 1 36 / 223 1 47 / 44 1
Female 36 / 205 0.61 (0.36–1.03) 19 / 179 0.85 (0.44–1.64) 17 / 26 0.44 (0.18–1.06)
BMI - 1.50 (1.35–1.66) - 1.75 (1.39–2.21) - 1.33 (1.08–1.64)
Diabetes Absent 91 / 421 1 44 / 362 1 47 / 59 1
Present 28 / 51 1.92 (1.04–3.55) 11 / 40 1.90 (0.84–4.30) 17 / 11 2.03 (0.78–5.26)
Hypertension Absent 64 / 297 1 32 / 262 1 32 / 35 1
Present 55 / 175 1.03 (0.62–1.72) 23 / 140 1.07 (0.56–2.05) 32 / 35 1.05 (0.44–2.48)
Dyslipidemia Absent 23 / 237 1 8 / 207 1 15 / 30 1
Present 96 / 235 3.63 (2.06–6.37) 47 195 4.83 (2.13–10.94) 49 / 40 2.42 (1.01–5.82)
Longitudinal analysis
PNPLA3 C/C 15 / 80 1 7 / 68 1 8 / 12 1
C/G 42 / 145 2.67 (1.30–5.49) 28 / 129 4.01 (1.34–12.02) 14 / 16 1.73 (0.68–4.38)
G/G 18 / 41 3.09 (1.26–7.58) 11 / 34 5.47 (1.64–18.23) 7 / 7 1.78 (0.55–5.78)
Age - 0.98 (0.93–1.03) - 0.97 (0.91–1.04) - 0.98 (0.92–1.05)
Gender Male 48 / 148 1 27 /128 1 21 / 20 1
Female 27 / 118 1.28 (0.66–2.47) 19 / 103 2.00 (0.95–4.23) 8 / 15 0.77 (0.28–2.14)
BMI - 1.47 (1.32–1.65) - 1.99 (1.59–2.51) - 1.27 (1.06–1.52)
Diabetes Absent 50 / 225 1 36 / 197 1 14 / 28 1
Present 25 / 41 1.86 (0.91–3.79) 10 / 34 2.81 (1.14–6.94) 15 / 7 1.27 (0.53–3.05)
Hypertension Absent 34 / 129 1 24 / 123 1 10 / 6 1
Present 41 / 137 0.78 (0.44–1.39) 22 / 108 1.11 (0.59–2.08) 19 / 29 0.41 (0.18–0.94)
Dyslipidemia Absent 22 / 126 1 12 / 111 1 10 / 15 1
Present 53 / 140 1.96 (1.16–3.31) 34 / 120 1.59 (0.82–3.09) 19 / 20 2.79 (1.32–5.93)
a
In the longitudinal analysis, the numbers of NAFLD subjects and non-NAFLD subjects at the endpoint are shown.
b
Adjusted by all covariates.
PNPLA3, patatin-like phospholipase 3; NAFLD, non-alcoholic fatty liver disease; OR, odds ratio; CI, confidence interval; BMI, body mass index
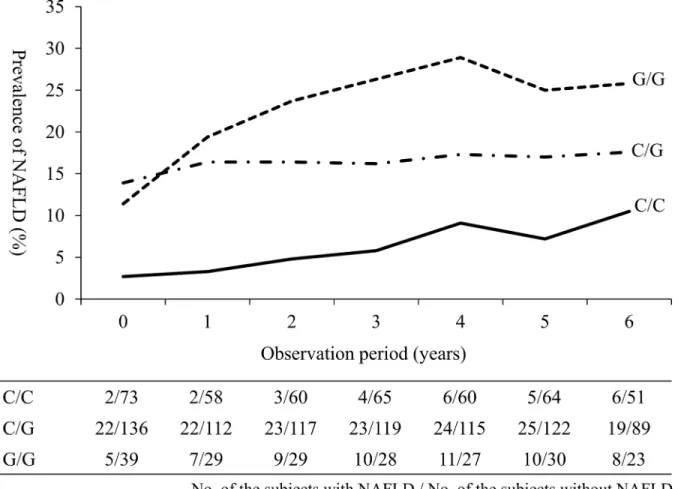
subjects with thePNPLA3C/G or G/G genotypes [adjusted OR (95% CI): 4.01 (1.34–12.02) or 5.47 (1.64–18.23), respectively] (Table 2). In addition, the prevalence of NAFLD was higher in thePNPLA3G/G carriers with normal weight during the observation period (Fig 1). Con-versely, thePNPLA3genotype was not significantly associated with the longitudinal risk for NAFLD among the overweight subjects (Table 2). The cross-sectional and longitudinal bi-vari-able logistic regression models are shown in theS4 Table.
The effects of weight status on the association between the
PNPLA3
genotype and the eGFR
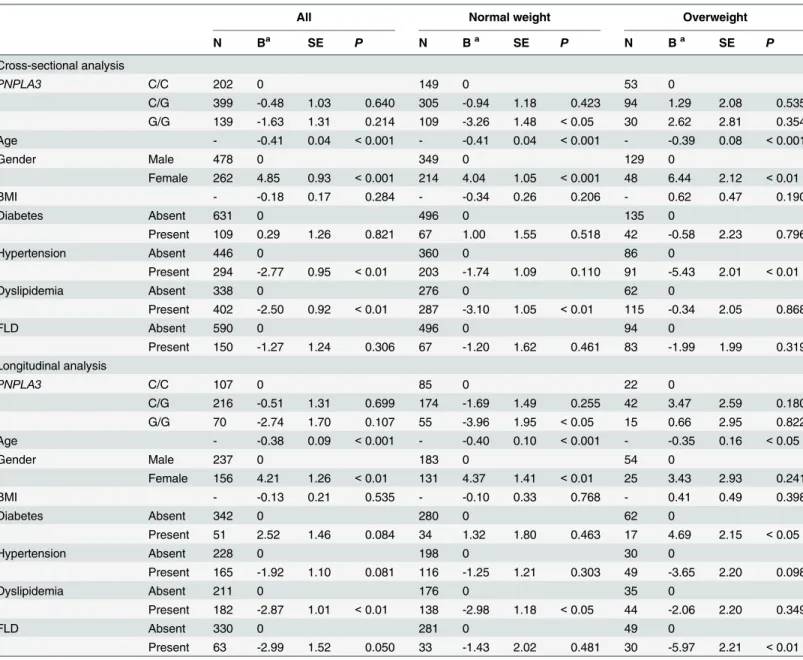
In cross-sectional multiple linear regression analyses, no association was observed between the PNPLA3genotype and the eGFR values among all 740 subjects (Table 3). Conversely, the eGFR values were significantly lower in the subjects with thePNPLA3G/G genotype than in those with the C/C genotype among the 563 normal weight subjects [adjusted B (SE): -3.26 (1.48),P<0.05], but the association was not observed among the 177 overweight subjects
(Table 3). A significant interactive effect was observed between thePNPLA3genotype and the
weight status on the eGFR values among all 740 subjects (P= 0.007).
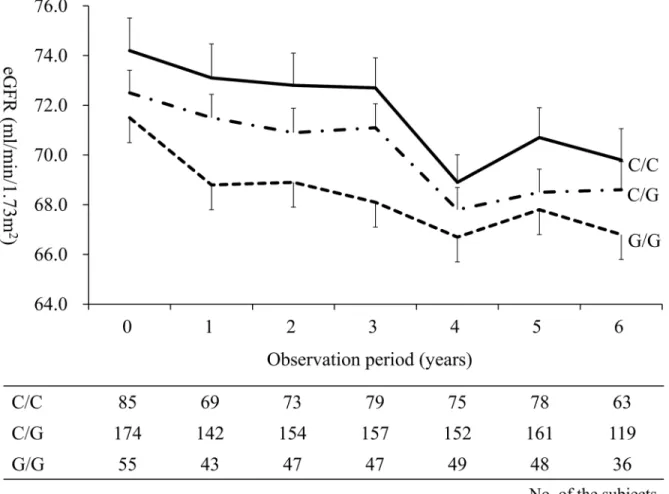
We also performed longitudinal multiple linear regression analyses among the 393 subjects in order to verify the results observed in the cross-sectional analyses. The longitudinal effects Fig 1. The longitudinal changes in the prevalence of NAFLD stratified by thePNPLA3genotype among normal weight subjects.The prevalence of NAFLD is shown as solid, dashed-dotted and dotted lines in the subjects with thePNPLA3C/C, C/G and G/G genotypes, respectively. NAFLD, non-alcoholic fatty liver disease; PNPLA3, patatin-like phospholipase 3.
of thePNPLA3genotype on the eGFR values are shown inTable 3. The eGFR values tended to be lower in the subjects with thePNPLA3G/G genotype than in those with the C/C genotype, however, this association was not statistically significant (Table 3). Conversely, the eGFR values were significantly lower in the subjects with thePNPLA3G/G genotype than in those with the C/C genotype among the 314 normal weight subjects [adjusted B (SE): -3.96 (1.95),P<0.05]
(Table 3). ThePNPLA3G/G carriers with normal weight status had lower eGFR values
throughout the observation period (Fig 2). No association was observed between thePNPLA3 genotype and the eGFR value among the 79 overweight subjects (Table 3). In order to assess Table 3. The effect of thePNPLA3genotype on the values of eGFR identified in the cross-sectional and longitudinal multiple linear regression analyses.
All Normal weight Overweight
N Ba SE P N Ba SE P N Ba SE P
Cross-sectional analysis
PNPLA3 C/C 202 0 149 0 53 0
C/G 399 -0.48 1.03 0.640 305 -0.94 1.18 0.423 94 1.29 2.08 0.535
G/G 139 -1.63 1.31 0.214 109 -3.26 1.48 <0.05 30 2.62 2.81 0.354
Age - -0.41 0.04 <0.001 - -0.41 0.04 <0.001 - -0.39 0.08 <0.001
Gender Male 478 0 349 0 129 0
Female 262 4.85 0.93 <0.001 214 4.04 1.05 <0.001 48 6.44 2.12 <0.01
BMI - -0.18 0.17 0.284 - -0.34 0.26 0.206 - 0.62 0.47 0.190
Diabetes Absent 631 0 496 0 135 0
Present 109 0.29 1.26 0.821 67 1.00 1.55 0.518 42 -0.58 2.23 0.796
Hypertension Absent 446 0 360 0 86 0
Present 294 -2.77 0.95 <0.01 203 -1.74 1.09 0.110 91 -5.43 2.01 <0.01
Dyslipidemia Absent 338 0 276 0 62 0
Present 402 -2.50 0.92 <0.01 287 -3.10 1.05 <0.01 115 -0.34 2.05 0.868
FLD Absent 590 0 496 0 94 0
Present 150 -1.27 1.24 0.306 67 -1.20 1.62 0.461 83 -1.99 1.99 0.319
Longitudinal analysis
PNPLA3 C/C 107 0 85 0 22 0
C/G 216 -0.51 1.31 0.699 174 -1.69 1.49 0.255 42 3.47 2.59 0.180
G/G 70 -2.74 1.70 0.107 55 -3.96 1.95 <0.05 15 0.66 2.95 0.822
Age - -0.38 0.09 <0.001 - -0.40 0.10 <0.001 - -0.35 0.16 <0.05
Gender Male 237 0 183 0 54 0
Female 156 4.21 1.26 <0.01 131 4.37 1.41 <0.01 25 3.43 2.93 0.241
BMI - -0.13 0.21 0.535 - -0.10 0.33 0.768 - 0.41 0.49 0.398
Diabetes Absent 342 0 280 0 62 0
Present 51 2.52 1.46 0.084 34 1.32 1.80 0.463 17 4.69 2.15 <0.05
Hypertension Absent 228 0 198 0 30 0
Present 165 -1.92 1.10 0.081 116 -1.25 1.21 0.303 49 -3.65 2.20 0.098
Dyslipidemia Absent 211 0 176 0 35 0
Present 182 -2.87 1.01 <0.01 138 -2.98 1.18 <0.05 44 -2.06 2.20 0.349
FLD Absent 330 0 281 0 49 0
Present 63 -2.99 1.52 0.050 33 -1.43 2.02 0.481 30 -5.97 2.21 <0.01
aAdjusted by all covariates.
PNPLA3, patatin-like phospholipase 3; eGFR, estimated glomerularfiltration rate; B, partial regression coefficient; SE, standard error; BMI, body mass index; FLD, fatty liver disease.
the effects of the presence of NAFLD on the association between thePNPLA3genotype and decline in eGFR, we also analyzed the effect of thePNPLA3genotype on the longitudinal eGFR values among the non-NAFLD and NAFLD subjects. The eGFR values were significantly lower in the subjects with thePNPLA3G/G genotype than in those with the C/C genotype among the non-NAFLD subjects [adjusted B (SE): -5.55 (1.96),P<0.01], although no such association
was observed between thePNPLA3genotype and the eGFR values among the NAFLD subjects [adjusted B (SE): 2.40 (4.23),P= 0.57]. The cross-sectional and longitudinal bi-variable linear regression models are shown inS5 Table.
Statistical power analyses
In the cross-sectional analyses, the statistical power of the association analyses between the PNPLA3genotype and the risk for NAFLD or the value of the eGFR was 87% or 87% for all subjects, 61% or 71% for normal weight subjects and 43% or 26% for overweight subjects, respectively. The statistical power in the longitudinal analyses was 70% or 54% for all sub-jects, 40% or 40% for normal weight subjects and 22% or 13% for overweight subsub-jects, respectively.
Fig 2. The longitudinal changes in eGFR stratified by thePNPLA3genotype among normal weight subjects.The mean values of eGFR are shown as solid, dashed-dotted and dotted lines in the subjects with thePNPLA3C/C, C/G and G/G genotypes, respectively, and the SEs are shown as antennae. eGFR, estimated glomerular filtration rate; PNPLA3, patatin-like phospholipase 3; SE, standard error.
Discussion
To the best of our knowledge, this is the first report to demonstrate that the effects of the PNPLA3rs738409 polymorphism on the risk for NAFLD and decline in eGFR were significant in normal weight subjects through the cross-sectional and longitudinal analyses. In Asians, the prevalence of NAFLD is equivalent to that in Caucasians, despite having lower BMI [4–6]. Asians with NAFLD have been known to exhibit a predominantly impaired insulin secretion [5]. Among the normal weight subjects, the presence of NAFLD was more strongly associated with the prevalence of diabetes, hypertension and metabolic syndrome compared to the obese/ overweight subjects [6]. Therefore, clarifying the risk factors for NAFLD among the normal weight subjects will help to identify susceptible populations for the early prevention and treat-ment of NAFLD and its complications, especially in Asians. The findings of this study suggest that thePNPLA3rs738409 polymorphism may be utilized for the early detection of the high-risk group for NAFLD and decline in the renal function, even though individuals may have a normal weight status.
Although thePNPLA3rs738409 polymorphism is the only gene that has been consistently confirmed to be associated with the risk for NAFLD by genome-wide association studies and candidate gene studies [8–13], the exact mechanism underlying the association between the PNPLA3polymorphism and the incidence for NAFLD is a matter of debate. PNPLA3 is highly expressed in the human liver and adipose tissue [26] and plays a role in the hydrolysis of three major glycerolipids (i.e., triacylglycerol, diacylglycerol, and monoacylglycerol); the rs738409 G allele results in a loss of function impairing glycerolipids hydrolysis [14,27]. In non-obese sub-jects, elevated ALT and TG levels, a higher degree of insulin resistance, increased waist circum-stance, body weight change and an age between 40 and 64 years were identified as the risk factors for NAFLD [5,28]. Hyysalo et al. previously examined the effects of NAFLD on the cir-culating lipid signature in relation to either obesity or thePNPLA3polymorphism [29]. Obe-sity-related NAFLD was associated with multiple changes in triacylglycerols, which may be attributed to obesity and/or insulin resistance rather than increased liver fat content per se [29]. ThePNPLA3-related NAFLD was characterized by absolute and relative deficiencies of circulating triacylglycerols compared to obesity-related NAFLD, thus suggesting that the PNPLA3polymorphism may impair lipolysis rather than stimulate the synthesis of intrahepa-tocellular triacylglycerols [29]. Meanwhile, Shen et al. reported that thePNPLA3rs738409 G allele increased the risk for NAFLD, especially in the subjects without metabolic syndrome [12]. According to the findings of the present study and these previous studies, we speculate that the relationship between thePNPLA3polymorphism and the impaired lipolysis may be more pronounced in the normal weight subjects than in overweight subjects, thus resulting in the increased risk for NAFLD among the normal weight subjects with thePNPLA3rs738409 G/G genotype.
showed a high expression in the retina and sinusoidal pericytes (the hepatic stellate cells) [30]. In addition, PNPLA3 demonstrated a retinyl-esterase activityex vivoandin vitro, which was lost as a result of thePNPLA3rs738409 polymorphism [30]. Romeo et al. speculated that the PNPLA3G allele may be associated with kidney disease due to an unbalanced activation of the kidney pericytes (i.e., glomerular podocytes) which play a pivotal role in the regulation of glo-merular filtration [31]. Therefore, thePNPLA3rs738409 polymorphism may also directly impact the decline in renal function.
ThePNPLA3G/G genotype was associated with not only the risk for NAFLD [8–12], but also a higher severity of carotid atherosclerosis in NAFLD patients [32]. Recently, Shen et al. investigated the effects of thePNPLA3genotype on the response to a lifestyle modification pro-gram based on a strategy for increasing energy expenditure and reducing the caloric intake for 12 months in non-diabetic NAFLD patients by a post-hoc analysis of a randomized controlled trial [33]. Interestingly, thePNPLA3G/G genotype carriers were more sensitive to the benefi-cial effects of lifestyle modification (i.e., the reduction in TG, total cholesterol, LDL-C, body weight and the waist to hip ratio), despite the G/G genotype carriers had a higher risk for NAFLD [33]. Meanwhile, it is well known that NAFLD and/or CKD patients have a strong risk of diabetes, hypertension, dyslipidemia, end-stage renal disease (ESRD) and CVD events [34]. The evidence obtained from the meta-analysis suggested that the early decline in proteinuria induced by the treatment was associated with a lower risk of elevation of the SCr level, ESRD or death [35]. The results of this study suggest that determining thePNPLA3genotype may be useful for preventing and treating NAFLD as well as a decline in the eGFR and associated com-plications, especially in normal weight individuals, by means of implementing targeted preven-tion and treatment programs forPNPLA3G/G genotype carriers.
Among the overweight subjects in this study, we observed no significant associations between the effects of thePNPLA3genotype and the risk of NAFLD and/or a decline in eGFR (Tables2and3). Obesity is strongly associated with the development and progression of NAFLD and CKD due to insulin resistance, diabetes, hypertension, altered adipokine levels and/or glomerular hypertrophy [1–4,36]. In the present study, the overweight subjects also had a high prevalence of NAFLD, lower eGFR values and more metabolic risk factors associ-ated with the risk of NAFLD and a decline in the renal function (i.e., high prevalence of diabe-tes, hypertension, dyslipidemia and FLD) than the normal weight subjects (Table 1andS2
Table). These metabolic risk factors may more strongly affect the development of NAFLD and/
or decline in the renal function than thePNPLA3genotype in overweight subjects. On the other hand, previous reports have shown that obesity is one of the triggers of liver damage in the carriers of thePNPLA3G/G genotype [27]. Among the overweight subjects included in the cross-sectional study, thePNPLA3G/G genotype was significantly associated with an increased ALT value and tended to exhibit a higher prevalence of NAFLD (S2 TableandTable 2). The present study had a small sample size, and particularly in the analyses of the overweight sub-jects, the values of statistical power was below the necessary limit of power (i.e., 80%) to predict the development of NAFLD and the decline of the eGFR. Therefore, this study did not have sufficient power to clarify whether thePNPLA3polymorphism is an independent risk factor for NAFLD and/or a decline in the eGFR in overweight subjects, and a type 2 error cannot be excluded.
underlying mechanism remains unclear. The study subjects were participants of the Japanese health screening program and might have had a high level of health literacy. In addition, the study subjects included in the longitudinal analyses were comparatively old (mean age: 67.5 ± 6.0 years at baseline and 72.9 ± 6.1 at endpoint). Therefore, a selection bias may be asso-ciated with the present study.
Other limitations of the present study should be noted. We included Japanese subjects, how-ever, the ethnicity of the patients was self-reported in face-to-face interviews and not checked (e.g., by determining the birth places of the grandparents). The subjects’alcohol consumption was evaluated through face-to-face interviews, which may have lacked reliability. Hepatic ultra-sonography scanning, which is known to have a sensitivity of 64% and a specificity of 97% in detecting fatty liver [37], was used to diagnose FLD. The diagnosis was not confirmed by liver biopsy. Among the NAFLD subjects, the values of the FIB4 index and ALT were relatively low
(Table 1). Therefore, the severity of the NAFLD subjects was relatively low, and most of the
NAFLD subjects were thought to have simple steatosis. The present study is retrospective design and the study subjects were volunteers in a healthy screening program, which may have created a selection bias (e.g., there is possibility that overweight subjects may have moved from health screening to the treatment of obesity-related diseases and thus the effects ofPNPLA3 genotype might have only been observed among normal weight subjects).
In conclusion, this study provided preliminary findings demonstrating that thePNPLA3 rs738409 genotypes are associated with the risk of NAFLD and decline of the eGFR in normal weight subjects, thus suggesting that even though carriers of thePNPLA3G/G genotype may have a normal weight status, they should nevertheless be carefully monitored for the presence of NAFLD, a decline in the renal function and associated complications. The information regarding thePNPLA3genotype in normal weight subjects may be utilized for health promo-tion, although further investigations with a larger number of subjects are needed to verify and further clarify these findings.
Supporting Information
S1 Table. Clinical characteristics of the subjects stratified by weight status.
(DOCX)
S2 Table. Clinical characteristics of all 740 subjects stratified by weight status and the
PNPLA3genotype.
(DOCX)
S3 Table. Clinical characteristics at baseline of 393 subjects included in the longitudinal analyses stratified by the weight status and thePNPLA3genotype.
(DOCX)
S4 Table. The effect of thePNPLA3genotype on the risk of NAFLD identified in the
cross-sectional and longitudinal bi-variable logistic regression analyses.
(DOCX)
S5 Table. The effect of thePNPLA3genotype on the values of eGFR identified in the
cross-sectional and longitudinal bi-variable linear regression analyses.
(DOCX)
Acknowledgments
Author Contributions
Conceived and designed the experiments: K. Oniki JS K. Otake YO KN. Performed the experi-ments: K. Oniki JS TI MS AK KM. Analyzed the data: K. Oniki JS TI AK KM MS. Contributed reagents/materials/analysis tools: K. Oniki JS TI AK KM MS K. Otake YO KN. Wrote the paper: K. Oniki JS AK KM KN.
References
1. Anstee QM, Targher G, Day CP. Progression of NAFLD to diabetes mellitus, cardiovascular disease or cirrhosis. Nat Rev Gastroenterol Hepatol. 2013; 10: 330–344. doi:10.1038/nrgastro.2013.41PMID: 23507799
2. Armstrong MJ, Adams LA, Canbay A, Syn WK. Extrahepatic complications of nonalcoholic fatty liver disease. Hepatology. 2014; 59: 1174–1197. doi:10.1002/hep.26717PMID:24002776
3. Fung J, Lee CK, Chan M, Seto WK, Lai CL, Yuen MF. High prevalence of non-alcoholic fatty liver dis-ease in the Chinese—results from the Hong Kong liver health census. Liver Int. 2015; 35: 542–549. doi:10.1111/liv.12619PMID:24923704
4. Ruhl CE, Everhart JE. Fatty liver indices in the multiethnic United States National Health and Nutrition Examination Survey. Aliment Pharmacol Ther. 2015; 41: 65–76. doi:10.1111/apt.13012PMID: 25376360
5. Liu CJ. Prevalence and risk factors for non-alcoholic fatty liver disease in Asian people who are not obese. J Gastroenterol Hepatol. 2012; 27: 1555–1560. doi:10.1111/j.1440-1746.2012.07222.xPMID: 22741595
6. Feng RN, Du SS, Wang C, Li YC, Liu LY, Guo FC, et al. Lean-non-alcoholic fatty liver disease increases risk for metabolic disorders in a normal weight Chinese population. World J Gastroenterol. 2014; 20: 17932–17940. doi:10.3748/wjg.v20.i47.17932PMID:25548491
7. Appropriate body-mass index for Asian populations and its implications for policy and intervention strat-egies. Lancet. 2004; 363: 157–163. PMID:14726171
8. Zhang L, You W, Zhang H, Peng R, Yao A, Li X, et al. PNPLA3 Polymorphisms (rs738409) and Non-Alcoholic Fatty Liver Disease Risk and Related Phenotypes: A Meta-Analysis. J Gastroenterol Hepatol. 2015; doi:10.1111/jgh.12889
9. Anstee QM, Day CP. The genetics of NAFLD. Nat Rev Gastroenterol Hepatol. 2013; 10: 645–655. doi: 10.1038/nrgastro.2013.182PMID:24061205
10. Shen JH, Li YL, Li D, Wang NN, Jing L, Huang YH. The rs738409 (I148M) variant of the PNPLA3 gene and cirrhosis: a meta-analysis. J Lipid Res. 2015; 56: 167–175. doi:10.1194/jlr.M048777PMID: 25378656
11. Singal AG, Manjunath H, Yopp AC, Beg MS, Marrero JA, Gopal P, et al. The effect of PNPLA3 on fibro-sis progression and development of hepatocellular carcinoma: a meta-analyfibro-sis. Am J Gastroenterol. 2014; 109: 325–334. doi:10.1038/ajg.2013.476PMID:24445574
12. Shen J, Wong GL, Chan HL, Chan HY, Yeung DK, Chan RS, et al. PNPLA3 gene polymorphism accounts for fatty liver in community subjects without metabolic syndrome. Aliment Pharmacol Ther. 2014; 39: 532–539. doi:10.1111/apt.12609PMID:24417250
13. Zhang Y, Cai W, Song J, Miao L, Zhang B, Xu Q, et al. Association between the PNPLA3 I148M poly-morphism and non-alcoholic fatty liver disease in the Uygur and Han ethnic groups of northwestern China. PLoS One. 2014; 9: e108381. doi:10.1371/journal.pone.0108381PMID:25290313
14. Huang Y, Cohen JC, Hobbs HH. Expression and characterization of a PNPLA3 protein isoform (I148M) associated with nonalcoholic fatty liver disease. J Biol Chem. 2011; 286: 37085–37093. doi:10.1074/ jbc.M111.290114PMID:21878620
15. Musso G, Gambino R, Tabibian JH, Ekstedt M, Kechagias S, Hamaguchi M, et al. Association of non-alcoholic fatty liver disease with chronic kidney disease: a systematic review and meta-analysis. PLoS Med. 2014; 11: e1001680. doi:10.1371/journal.pmed.1001680PMID:25050550
16. Ix JH, Sharma K. Mechanisms linking obesity, chronic kidney disease, and fatty liver disease: the roles of fetuin-A, adiponectin, and AMPK. J Am Soc Nephrol. 2010; 21: 406–412. doi:10.1681/ASN. 2009080820PMID:20150538
17. Machado MV, Goncalves S, Carepa F, Coutinho J, Costa A, Cortez-Pinto H. Impaired renal function in morbid obese patients with nonalcoholic fatty liver disease. Liver Int. 2012; 32: 241–248. doi:10.1111/ j.1478-3231.2011.02623.xPMID:22098270
19. Chalasani N, Younossi Z, Lavine JE, Diehl AM, Brunt EM, Cusi K, et al. The diagnosis and manage-ment of non-alcoholic fatty liver disease: practice guideline by the American Gastroenterological Asso-ciation, American Association for the Study of Liver Diseases, and American College of
Gastroenterology. Gastroenterology. 2012; 142: 1592–1609. doi:10.1053/j.gastro.2012.04.001PMID: 22656328
20. Jimba S, Nakagami T, Takahashi M, Wakamatsu T, Hirota Y, Iwamoto Y, et al. Prevalence of non-alco-holic fatty liver disease and its association with impaired glucose metabolism in Japanese adults. Dia-bet Med. 2005; 22: 1141–1145. PMID:16108839
21. Shah AG, Lydecker A, Murray K, Tetri BN, Contos MJ, Sanyal AJ. Comparison of noninvasive markers of fibrosis in patients with nonalcoholic fatty liver disease. Clin Gastroenterol Hepatol. 2009; 7: 1104–
1112. doi:10.1016/j.cgh.2009.05.033PMID:19523535
22. Matsuo S, Imai E, Horio M, Yasuda Y, Tomita K, Nitta K, et al. Revised equations for estimated GFR from serum creatinine in Japan. Am J Kidney Dis. 2009; 53: 982–992. doi:10.1053/j.ajkd.2008.12.034 PMID:19339088
23. Hotta K, Yoneda M, Hyogo H, Ochi H, Mizusawa S, Ueno T, et al. Association of the rs738409 polymor-phism in PNPLA3 with liver damage and the development of nonalcoholic fatty liver disease. BMC Med Genet. 2010; 11: 172. doi:10.1186/1471-2350-11-172PMID:21176169
24. Kawaguchi T, Sumida Y, Umemura A, Matsuo K, Takahashi M, Takamura T, et al. Genetic polymor-phisms of the human PNPLA3 gene are strongly associated with severity of non-alcoholic fatty liver dis-ease in Japanese. PLoS One. 2012; 7: e38322. doi:10.1371/journal.pone.0038322PMID:22719876
25. Kitamoto T, Kitamoto A, Yoneda M, Hyogo H, Ochi H, Nakamura T, et al. Genome-wide scan revealed that polymorphisms in the PNPLA3, SAMM50, and PARVB genes are associated with development and progression of nonalcoholic fatty liver disease in Japan. Hum Genet. 2013; 132: 783–792. doi:10. 1007/s00439-013-1294-3PMID:23535911
26. Huang Y, He S, Li JZ, Seo YK, Osborne TF, Cohen JC, et al. A feed-forward loop amplifies nutritional regulation of PNPLA3. Proc Natl Acad Sci U S A. 2010; 107: 7892–7897. doi:10.1073/pnas. 1003585107PMID:20385813
27. Dongiovanni P, Donati B, Fares R, Lombardi R, Mancina RM, Romeo S, et al. PNPLA3 I148M polymor-phism and progressive liver disease. World J Gastroenterol. 2013; 19: 6969–6978. doi:10.3748/wjg. v19.i41.6969PMID:24222941
28. Kim NH, Kim JH, Kim YJ, Yoo HJ, Kim HY, Seo JA, et al. Clinical and metabolic factors associated with development and regression of nonalcoholic fatty liver disease in nonobese subjects. Liver Int. 2014; 34: 604–611. doi:10.1111/liv.12454PMID:24382309
29. Hyysalo J, Gopalacharyulu P, Bian H, Hyotylainen T, Leivonen M, Jaser N, et al. Circulating triacylgly-cerol signatures in nonalcoholic fatty liver disease associated with the I148M variant in PNPLA3 and with obesity. Diabetes. 2014; 63: 312–322. doi:10.2337/db13-0774PMID:24009255
30. Pirazzi C, Valenti L, Motta BM, Pingitore P, Hedfalk K, Mancina RM, et al. PNPLA3 has retinyl-palmitate lipase activity in human hepatic stellate cells. Hum Mol Genet. 2014; 23: 4077–4085. doi:10.1093/ hmg/ddu121PMID:24670599
31. Romeo S, Dongiovanni P, Petta S, Pihalajamaki J, Valenti L. PNPLA3 I148M genetic variant and kid-ney disease. Hepatology. 2014; doi:10.1002/hep.27642
32. Petta S, Valenti L, Marchesini G, Di Marco V, Licata A, Camma C, et al. PNPLA3 GG genotype and carotid atherosclerosis in patients with non-alcoholic fatty liver disease. PLoS One. 2013; 8: e74089. doi:10.1371/journal.pone.0074089PMID:24069270
33. Shen J, Wong GL, Chan HL, Chan RS, Chan HY, Chu WC, et al. PNPLA3 gene polymorphism and response to lifestyle modification in patients with nonalcoholic fatty liver disease. J Gastroenterol Hepa-tol. 2015; 30: 139–146. doi:10.1111/jgh.12656PMID:25040896
34. Stevens PE, Levin A. Evaluation and management of chronic kidney disease: synopsis of the kidney disease: improving global outcomes 2012 clinical practice guideline. Ann Intern Med. 2013; 158: 825–
830. doi:10.7326/0003-4819-158-11-201306040-00007PMID:23732715
35. Inker LA, Levey AS, Pandya K, Stoycheff N, Okparavero A, Greene T. Early change in proteinuria as a surrogate end point for kidney disease progression: an individual patient meta-analysis. Am J Kidney Dis. 2014; 64: 74–85. doi:10.1053/j.ajkd.2014.02.020PMID:24787763
36. Garland JS. Elevated body mass index as a risk factor for chronic kidney disease: current perspectives. Diabetes Metab Syndr Obes. 2014; 7: 347–355. doi:10.2147/DMSO.S46674PMID:25114577