Genetic Polymorphisms of the Human PNPLA3 Gene Are
Strongly Associated with Severity of Non-Alcoholic Fatty
Liver Disease in Japanese
Takahisa Kawaguchi1,2, Yoshio Sumida3, Atsushi Umemura4, Keitaro Matsuo5, Meiko Takahashi1, Toshinari Takamura6, Kohichiroh Yasui7, Toshiji Saibara8, Etsuko Hashimoto9, Miwa Kawanaka10, Sumio Watanabe11, Sumio Kawata12, Yasuharu Imai13, Miki Kokubo1, Toshihide Shima4, Hyohun Park4,
Hideo Tanaka5, Kazuo Tajima5, Ryo Yamada1, Fumihiko Matsuda1,2*, Takeshi Okanoue4for the Japan
Study Group of Nonalcoholic Fatty Liver Disease (JSG-NAFLD)
1Center for Genomic Medicine, Kyoto University Graduate School of Medicine, Kyoto, Japan,2Institut National de la Sante et de la Recherche Medicale (INSERM) Unite U852, Kyoto University Graduate School of Medicine, Kyoto, Japan,3Center for Digestive and Liver Diseases, Nara City Hospital, Nara, Japan,4Center of Gastroenterology and Hepatology, Saiseikai Suita Hospital, Suita, Japan,5Division of Epidemiology and Prevention, Aichi Cancer Center, Nagoya, Japan,6Department of Disease Control and Homeostasis, Kanazawa University, Graduate School of Medical Science, Kanazawa, Japan,7Department of Molecular Gastroenterology and Hepatology, Graduate School of Medical Science, Kyoto Prefectural University of Medicine, Kyoto, Japan,8Department of Gastroenterology and Hepatology, Kochi Medical School, Kochi, Japan, 9Department of Internal Medicine and Gastroenterology, Tokyo Women’s Medical University, Tokyo, Japan,10Center of Liver Diseases, Kawasaki Hospital, Kawasaki Medical School, Okayama, Japan,11Department of Gastroenterology, Juntendo University School of Medicine, Tokyo, Japan,12Department of Gastroenterology, Yamagata University School of Medicine, Yamagata, Japan,13Department of Internal Medicine, Ikeda Municipal Hospital, Ikeda, Japan
Abstract
Background:Nonalcoholic fatty liver disease (NAFLD) includes a broad range of liver pathologies from simple steatosis to cirrhosis and fibrosis, in which a subtype accompanying hepatocyte degeneration and fibrosis is classified as nonalcoholic steatohepatitis (NASH). NASH accounts for approximately 10–30% of NAFLD and causes a higher frequency of liver-related death, and its progression of NASH has been considered to be complex involving multiple genetic factors interacting with the environment and lifestyle.
Principal Findings:To identify genetic factors related to NAFLD in the Japanese, we performed a genome-wide association study recruiting 529 histologically diagnosed NAFLD patients and 932 population controls. A significant association was observed for a cluster of SNPs inPNPLA3on chromosome 22q13 with the strongestp-value of 1.4610210(OR = 1.66, 95%CI:
1.43–1.94) for rs738409. Rs738409 also showed the strongest association (p= 3.661026) with the histological classifications
proposed by Matteoni and colleagues based on the degree of inflammation, ballooning degeneration, fibrosis and Mallory-Denk body. In addition, there were marked differences in rs738409 genotype distributions between type4 subgroup corresponding to NASH and the other three subgroups (p= 4.861026, OR = 1.96, 95%CI: 1.47–2.62). Moreover, a subgroup
analysis of NAFLD patients against controls showed a significant association of rs738409 with type4 (p= 1.7610216, OR = 2.18, 95%CI: 1.81–2.63) whereas no association was obtained for type1 to type3 (p= 0.41). Rs738409 also showed strong associations with three clinical traits related to the prognosis of NAFLD, namely, levels of hyaluronic acid (p= 4.661024), HbA1c (p= 0.0011) and iron deposition in the liver (p= 5.661024).
Conclusions:With these results we clearly demonstrated that Matteoni type4 NAFLD is both a genetically and clinically different subset from the other spectrums of the disease and that the PNPLA3 gene is strongly associated with the progression of NASH in Japanese population.
Citation:Kawaguchi T, Sumida Y, Umemura A, Matsuo K, Takahashi M, et al. (2012) Genetic Polymorphisms of the Human PNPLA3 Gene Are Strongly Associated with Severity of Non-Alcoholic Fatty Liver Disease in Japanese. PLoS ONE 7(6): e38322. doi:10.1371/journal.pone.0038322
Editor:Takeshi Okanoue, Wageningen University, The Netherlands ReceivedMarch 8, 2012;AcceptedMay 3, 2012;PublishedJune 14, 2012
Copyright:ß2012 Kawaguchi et al. This is an open-access article distributed under the terms of the Creative Commons Attribution License, which permits unrestricted use, distribution, and reproduction in any medium, provided the original author and source are credited.
Funding:This work was supported by the grant from Ministry of Labor and Welfare Japan [T.O., H20-Hepatitis-general-008], Core Research of Evolutional Science & Technology (CREST). The funders had no role in study design, data collection and analysis, decision to publish, or preparation of the manuscript. Competing Interests:The authors have declared that no competing interests exist.
* E-mail: [email protected]
Introduction
Nonalcoholic fatty liver disease (NAFLD) includes a broad range of pathologies from fatty liver (simple steatosis), steatone-crosis, and steatohepatitis to cirrhosis [1–3]. NAFLD often accompanies other lifestyle-related pathologies of metabolic
shows simple steatosis with a good prognosis, but approximately 10–30% of NAFLD histologically diagnosed as nonalcoholic steatohepatitis (NASH) shows hepatocyte degeneration (ballooning hepatocyte), necrosis, inflammation and fibrosis, with a higher frequency of liver-related death both in Japanese and European populations [6,7]. Insulin resistance and oxidative stress are considered to be key players in the progression of NASH [8,9]. However, the progression of NASH has been considered to be complex involving multiple genetic factors interacting with the environment and lifestyle, because only a portion of NAFLD patients develops NASH.
The first Genome-wide association (GWA) study searching for such genetic factors identified thePNPLA3gene as a major genetic determinant for the predisposition to NAFLD in Hispanic, African American and European American populations according to liver fat contents [10], which was subsequently confirmed in Europeans and Asians according to liver biopsy. Association ofPNPLA3with not only fatty liver and TG content, but also inflammation and fibrosis were shown in the subsequent studies, soPNPLA3may be widely associated with the development of NAFLD [11–13]. More recently, another GWA study reported the association of four additional genes with NAFLD in Europeans [14]. Also, a candidate gene-based approach revealed the association between NAFLD and the apolipoprotein C3 gene in Indians [15]. However, the precise role of such genes in the development of NASH still remains to be elucidated. In addition, no GWA study has been reported for Asian populations to date although the genetic components and their relative contribution may be different between ethnicities.
The Japan NASH Study Group was founded in 2008 aiming at the identification of genetic determinants predisposing to NASH in the Japanese population. Here we report the first GWA study of NAFLD in the Japanese using DNA samples of patients with liver histology-based diagnoses recruited through this multi-institutional research network.
Results
Genome-wide Association Analysis of NAFLD in Japanese We conducted a GWA study using DNA samples of 543 patients with NAFLD and 942 controls. After quality controls of genotyping results (see materials and methods for details), a total of 529 patients consisting of four NAFLD subgroups according to Matteoni’s classification [2] (type1; 100, type2; 73, type3; 29, type4; 327) and 932 controls were subjected to statistical analyses (Table 1). This index pathologically classifies NAFLD according to the degree of inflammation, hepatocyte degener-ation, and the existence of fibrosis and Mallory-Denk body in the liver. Genome scan results of 932 DNA samples collected for other genetic studies were used as general Japanese population controls [16]. After standard quality control proce-dure as described in materials and methods, genotype distribu-tions of 484,751 autosomal SNP markers were compared between the NAFLD cases and control subjects by exact trend test. A slight inflation of p-values was observed by genomic control method (l= 1.04) (Figure S1).
We identified six SNP markers located at chromosome 22q13 showing genome-wide significance (p,1.0461027) (Figure 1). Among them, four SNPs, namely, rs2896019, rs926633, rs2076211 and rs1010023, located in the PNPLA3 gene and in strong linkage disequilibrium (LD) (r2.0.93), returned p-values smaller than 161029(p= 1.5610210, 7.5610210, 1.461029and 1.561029, respectively) (Table 2). Rs738407 and rs3810662 also located in PNPLA3 showed significant but weaker associations
(p= 1.061027 and 1.061027, respectively) than the above four SNP markers. Rs738491, rs2073082, rs3761472, rs2235776, rs2143571 and rs6006473 were in the neighboringSAMM50gene which is outside of the linkage disequilibrium (LD) block where the top SNP markers were distributed (Figure 2). These markers were in moderate LD with each other (r2.0.42) and showedp-values between 3.961026and 6.461027but did not reach genome-wide significance (Table S1). Rs738409, the SNP which showed the strongest association with NAFLD in the first GWA study [10], was not included in the SNP array used in our study. This SNP was therefore genotyped using Taqman technology in the same case and control samples that were used for genome scan. Rs738409 showed the strongest association with the disease (p= 1.4610210, OR = 1.66, 95%CI: 1.43–1.94) among all the SNP markers examined in this study. The association remained after the correction for population stratification with EIGEN-STRAT [17] (p= 2.3610211). Although a peak consisting of a cluster of SNPs was observed at theHLAlocus on chromosome 6 (minimalp-value of 4.1061027for rs9262639 located at the 39of C6orf15gene), the association disappeared when EIGENSTRAT was applied (p.1.661023). We consider this as a result of population stratification between the cases and controls.
Impact ofPNPLA3Polymorphisms to the Pathogenicity of NAFLD
We next examined whether or not the seven SNPs in the PNPLA3 gene were associated with the pathogenic status of NAFLD. The genotype distributions of these SNPs were compared by Jonckheere-Terpstra test among the four subgroups of NAFLD patients categorized by Matteoni’s classification (type1 to type4). There was a significant increase in the frequency of the risk allele from Matteoni type1 to type4 for all of the seven SNPs (p-values ranging from 3.661026 to 0.0017) (Table 2). Among them, rs738409 again showed the strongest association (p= 3.661026) as seen in the simple case/control analysis. On the other hand, there was no significant association between control and Matteoni type1 (p= 0.76).
In order to clarify how rs738409 influences the pathogenicity of NAFLD, we performed pairwise comparisons of genotype distributions in the four subgroups of NAFLD patients. There were marked differences in genotype distributions between type4 subgroup and the other three subgroups by multivariable logistic regression adjusted for age, sex and body mass index (BMI) (p= 2.061025, OR = 2.18, 95%CI: 1.52–3.18 between type1 and type4; p= 1.461023, OR = 1.81, 95%CI: 1.26–2.62 between type2 and type4; p= 0.027, OR = 1.85, 95%CI: 1.07–3.19 between type3 and type4) (Figure 3). On the other hand, no significant associations were obtained for type1 to type3 in any combinations. When we performed the same analysis between type4 and the pooled genotypes of type1 to type3, we again obtained a significant difference (p= 4.861026, OR = 1.96, 95%CI: 1.47–2.62).
Association of rs738409 Genotypes with Clinical Traits The quantitative effects of rs738409 genotypes to clinical traits were examined by multivariable regression adjusted for age, sex and BMI (statistical calculation 1, Table 3). Five categorical ordinals, namely, anti-nuclear antibody (ANA), Brunt grade, Brunt stage, fat deposition and iron deposition, were also tested by an ordinal logistic regression analysis. Potential associations
(p,0.05) were obtained for 11 traits, namely, aspartate transam-inase (AST), alanine aminotransferase (ALT), type IV collagen 7S, hyaluronic acid, hemoglobin A1c (HbA1c), fasting immuno-reactive insulin (IRI), fasting plasma glucose (FPG), platelet count (PLT), Brunt grade, fat deposition and iron deposition (Table 3). When the results were further adjusted for Matteoni type (statistical calculation 2), AST, hyaluronic acid, HbA1c, FPG,
Table 1.Clinical characteristics according to the histological classification.
Phenotype Matteoni classification of NAFLD Control p-value
Type 1 Type 2 Type 3 Type 4
Number of samples 100 73 29 327 932
Sex (Male/Female) 59/41 47/26 13/16 130/197 471/461 0.0023{ Age (year) 49.7615.3 51.5615.3 49.4614.0 57.6614.8 48.8616.3 ,0.001 Physical measurement
BMI 26.264.3 27.764.8 27.663.5 27.765.2 – 0.054
Amount of visceral fat (cm2) 146.8
665.3 154.3647.7 136.8653.8 151.7657.4 – 0.46 Abdominal circumscript (cm) 90.969.9 94.1610.0 88.5610.2 94.1611.8 – 0.10 Biochemical trait
AST (IU/L) 31.1614.6 36.4618.5 52.4635.1 57.7648.4 – ,0.001 ALT (IU/L) 48.6630.8 62.8647.6 81.5646.9 74.9648.4 – ,0.001 GGT (IU/L) 71.0662.5 67.1666.9 96.1691.3 76.6673.9 – 0.25 Albumin (g/dL) 4.560.4 4.460.3 4.560.3 4.360.4 – ,0.001 Total bilirubin (mg/dL) 0.960.5 0.960.5 0.960.6 0.860.4 – 0.063 Cholinesterase (unit) 389.1697.0 354.3697.2 371.16109.9 348.9693.2 – ,0.001 Type IV collagen 7S (ng/dL) 3.860.7 3.960.9 3.960.8 5.161.7 – ,0.001 Hyaluronic acid (ng/dL) 25.6622.5 33.6629.5 31.5624.0 80.9684.3 – ,0.001 Triglycerides (mg/dL) 151.9673.8 154.0692.1 166.1686.5 161.2685.7 – 0.23 Total cholesterol (mg/dL) 209.1632.8 194.0638.0 203.0639.9 200.3639.0 – 0.093 HbA1c (%) 6.161.1 5.961.2 6.561.8 6.261.3 – 0.13 IRI (mg/dL) 9.165.4 11.469.0 10.466.3 14.969.9 – ,0.001 FPG (mg/dL) 112.9633.7 107.3627.4 109.9627.7 114.8633.8 – 0.14
HOMA-IR 2.461.5 2.962.4 3.062.1 4.263.0 – ,0.001
hs-CRP (mg/dL) 1078.961407 1048.361185.0 865.86658.4 1579.262377.9 – 0.027 Adiponectin (mg/mL) 7.464.4 8.566.6 6.662.6 6.964.3 – 0.24 Leptin (ng/mL) 9.967.4 9.166.2 11.369.4 12.467.9 – ,0.001 Ferritin (ng/mL) 145.86101.1 176.56134.0 271.26307.0 208.36180.3 – 0.027 Uric acid (mg/dL) 5.961.5 5.761.2 5.461.9 5.761.6 – 0.77 PLT (6104/mL) 23.0
65.9 22.964.9 21.966.7 20.266.4 – ,0.001 ANA (0/1/2/3/4) 42/17/4/0/0 31/8/4/1/2 15/6/2/0/0 147/76/31/8/12 – 0.015 Clinical history
Diabetes (NGT/IGT/DM) 36/11/34 24/7/27 12/8/7 103/35/119 – 0.45* Hyperlipidemia (+/2) 31/68 31/42 9/20 120/206 – 0.60{ Hypertension (+/2) 64/35 33/40 19/10 155/172 – 0.013{ Liver biopsy feature
Brunt grade (1/2/3) – – 19/3/2 149/133/44 – ,0.001{
Brunt stage (1/2/3/4) – – – 123/74/105/24 – –
Fat droplet (1/2/3/4) 38/32/19/11 14/29/18/7 7/3/10/4 51/99/104/52 – ,0.001 Iron deposition (0/1/2/3/4) 30/14/21/10/1 24/9/12/2/1 10/5/2/2/0 132/56/29/29/11 – 0.16
Measurements are shown as mean6standard deviation. Categorical values are shown by the count number.P-values are calculated by Jonckheere-Terpstra test unless otherwise stated;
{
Chochran-Armitage trend test,
PLT, Brunt grade and iron deposition showed p-values smaller than 0.05. The level of serum triglyceride was not significant in the initial analysis, but became significant after being adjusted for Matteoni’s type (p= 0.013). Among them, only three traits, namely, hyaluronic acid, HbA1c and iron deposition, remained significant (p,0.0021) after Bonferroni’s correction for multiple testing (Table 3).
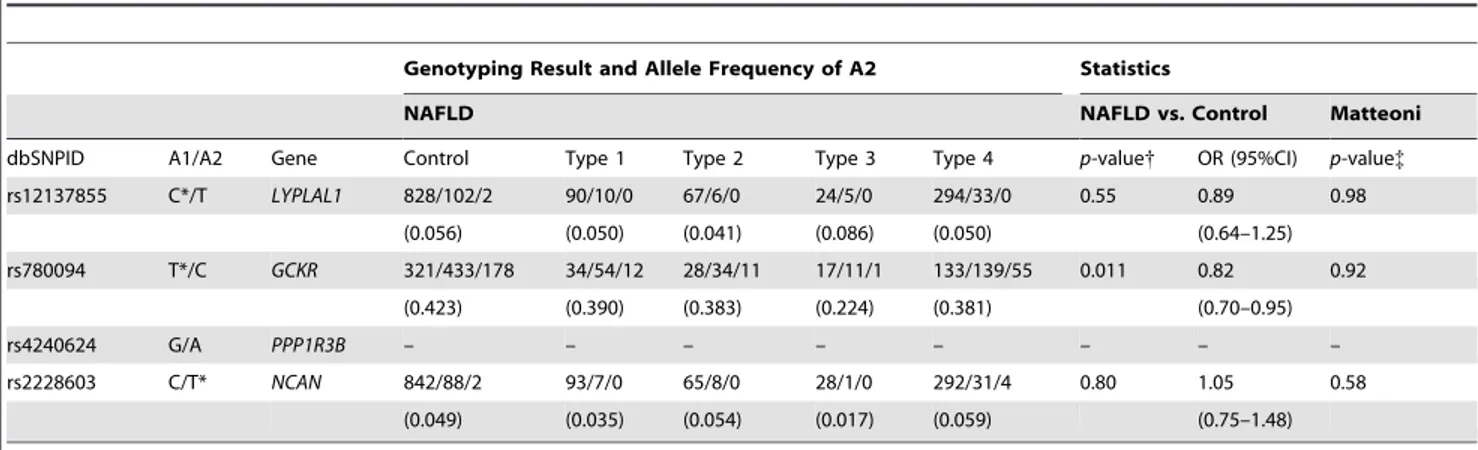
Associations of Previously Reported SNPs with NAFLD Previous genetic studies identified four chromosomal loci, namely,LYPLAL1 at 1q41,GCKRat 2p23,NCAN at 19p12 and PPP1R3B at 8p23.1, associated with NAFLD in populations of
European descent [14]. We examined whether or not the associations were reproduced in the Japanese population by extracting genotype information of SNP markers corresponding to these four loci. As shown in Table 4, the association of rs780094 in GCKRwith NAFLD was at the border of significance (p= 0.011, OR = 0.82, 95%CI: 0.70–0.91) in the case/control analysis. However, the association was lost when examined between rs780094 genotypes and Matteoni types. There were no associ-ations of rs2228603 inNCAN and rs12137855 inLYPLAL1 with either NAFLD or Matteoni types. Rs4240624 inPPP1R3Bwas not in the SNP array used for this study, and this marker was not polymorphic or at a very low frequency in the Japanese (0 in 90 Figure 1. Manhattan plot of the GWA study.Associationp-values are calculated by exact trend test and plotted along the chromosome in
2log10scale. The horizontal line indicates Bonferroni-adjusted significance threshold (p= 1.0361027).
doi:10.1371/journal.pone.0038322.g001
Table 2.List of the SNP markers in thePNPLA3locus at chromosome 22q showing genome wide significance.
Genotyping Result and Allele Frequency of A2 Statistics
NAFLD NAFLD vs. Control Matteoni
dbSNPID A1/A2 Control Total Type 1 Type 2 Type 3 Type 4 p-value{ OR (95%CI) p-value{ rs738407 T/C 124/447/361 46/200/283 12/51/37 10/28/35 4/14/11 20/107/200 1.061027 1.56(1.32–1.83) 3.461025
(0.627) (0.724) (0.625) (0.671) (0.621) (0.775)
rs738409 C/G* 247/468/217 88/236/203 20/59/21 21/30/22 8/11/9 39/136/151 1.4610210 1.66(1.43–1.94) 3.661026
(0.484) (0.609) (0.505) (0.507) (0.518) (0.672)
rs2076211 C/T* 248/473/211 92/242/195 21/58/21 21/30/22 8/11/10 42/143/142 1.461029 1.61(1.38–1.87) 3.261025
(0.480) (0.597) (0.500) (0.507) (0.534) (0.653)
rs2896019 T/G* 246/473/213 91/234/204 20/57/23 22/29/22 7/12/10 42/136/149 1.5610210 1.66(1.42–1.93) 2.661025
(0.482) (0.607) (0.515) (0.500) (0.552) (0.664)
rs1010023 T/C* 249/473/210 94/239/196 21/57/22 22/29/22 7/12/10 44/141/142 1.561029 1.61(1.38–1.87) 6.561025
(0.479) (0.596) (0.505) (0.500) (0.552) (0.650)
rs926633 G/A* 247/474/211 93/237/199 21/56/23 22/29/22 7/12/10 43/140/144 7.5610210 1.62(1.39–1.89) 5.861025
(0.481) (0.600) (0.510) (0.500) (0.552) (0.654)
rs3810622 T*/C 330/445/157 263/208/58 40/48/12 28/29/16 14/12/3 181/119/27 1.061027 0.64(0.55–0.75) 0.0017
(0.407) (0.306) (0.360) (0.418) (0.310) (0.265)
Reference (A1) and non-reference (A2) alleles refer to NCBI Reference Sequence Build 36.3 with the effective allele marked by an asterisk. Genotyping results are shown by genotype count of A1A1/A1A2/A2A2 with allele frequency of A2 in parenthesis.
{
P-values are calculated by exact trend test with odds ratios (OR) calculated for A2 with 95% confidence interval (CI). {P
chromosomes in the Japanese result of the International HapMap Project).
Discussion
NASH is a type of hepatic steatosis in NAFLD with poor prognosis accompanying liver fibrosis, and subsequent liver cirrhosis and hepatocellular carcinoma [18]. Despite the extensive biochemical and histological investigation of NAFLD, whether or not NASH forms a distinct disease entity in NAFLD still remains unclear. The principle aim of this study was to identify the genetic factors related to the pathogenic status of NAFLD by collecting DNA samples of Japanese NAFLD patients with critically diagnosed disease status by liver biopsy. To our knowledge, this is the first GWA study of NAFLD using patients with known histology-based Matteoni type. In the initial association study using pooled genotyping results of all the cases, we found a significant association of the PNPLA3 gene at chromosome
22q13.31 with NAFLD in the Japanese. Rs738409 which showed the strongest association with NAFLD in the GWA study of Caucasians was also genotyped and its strongest association with NAFLD was confirmed. These results were in agreement with the former GWA analyses in populations of European descent and in Hispanics, giving strong evidence of the involvement ofPNPLA3in NAFLD beyond ethnicities. Rs738409 is located in exon3 of the PNPLA3gene which is expressed in the liver and adipose tissue. This SNP introduces an amino acid substitution from isoleucine to methionine (I148M), and biological studies demonstrated that its risk allele (G) abolishes the triglyceride hydrolysis activity of PNPLA3[19]. These observations strongly suggest rs738409 to be a causative genetic variation for NAFLD. However, future genomic analyses by fine mapping or extensive sequencing may identify additional genetic determinants within thePNPLA3locus. In the current study we did not find other genetic loci showing genome-wide significance (p,1.061027). However, two additional chromosomal loci withp-values being smaller than 161025were Figure 2. A schematic organization of the humanPNPLA3locus at 22q13.31 with the genome scan results.P-values calculated by the exact trend test were plotted in –log10 scale. Red and blue dots indicate the p-values of genotyped and imputed SNPs, respectively. Local
recombination rate obtained from HAPMAP release 22 is indicated by a red line plotted in cm/Mb scale. The structure and orientation of four genes in the region are shown below the plots with their transcriptional orientations according to NCBI Reference Sequence Build 36.3. LD blocks were generated according to pairwise LD estimates of the SNPs located within the region using the genome scan results. The LD block showing the strongest association is highlighted with the triangle, and the corresponding chromosomal region is represented by the dotted lines.
identified on chromosome 1p (rs11206226) and chromosome 4p (rs1390096) neither of which has been reported as being associated with NAFLD in Caucasians (Table S1). Statistical calculation by taking their allele frequencies and effect sizes into account showed that approximately three times as many case and control samples are required to obtain sufficient statistical power (.0.8) for genome wide significance. Hence, further confirmation is required using a larger collection of patients and controls although they may be potential candidates of low-penetrance genes for susceptibility to NAFLD in Japanese.
Subsequent analyses through comparison of genotype distribu-tion among four subgroups of NAFLD (type1 to type4) categorized by Matteoni’s classification revealed that the seven NAFLD-associated SNPs in the PNPLA3 gene were also significantly associated with the pathogenic status of NAFLD. There were also marked differences in genotype distribution of rs738409 between type4 subgroup and the other three groups (p= 4.861026, OR = 1.96, 95%CI: 1.47–2.62 between type4 and pooled geno-types of type1 to type3). Moreover, a case/control analysis of rs738409 between Matteoni type4 and controls returned a surprisingly strong association (p= 1.7610216) which was much stronger than the initial analysis using all NAFLD cases (p= 1.4610210), whereas the analysis using Matteoni type1 to type3 as cases didn’t show significance (p= 0.41). There were differences in the score of HOMA-IR and hs-CRP, indicators of insulin resistance and inflammation, respectively, between Mat-teoni type1 to type3 and type4 subgroups (Table 1). Our results provide compelling evidence that NASH corresponding to Matteoni type4 is both a clinically and genetically different disease subset from other spectrums of NAFLD. Previous studies showed association betweenPNPLA3and fatty liver, inflammation, fibrosis grade and NASH [13]. In our result, strong association between rs738409 and fatty liver was not observed by comparing control and Matteoni type1. In addition, strong association between rs738409 and lobular inflammation was not observed by comparing Matteoni Type1 and Type2. In contrast, a strong association between rs738409 and NASH was observed. Although
we could not observe the strong association between rs738409 and fibrosis stage, strong association between rs738409 and Hyaluronic acid suggests that an association exists between PNPLA3 and fibrosis.
We have also undertaken association analyses of rs738409 and clinical traits in the patients. The multivariable regression analysis adjusted for age, sex, BMI and Matteoni type followed by the correction for multiple testing revealed hyaluronic acid and HbA1c as being significantly associated with rs738409. Hyaluronic acid is one of the principle components of the extracellular matrix and its involvement in fibrosis has been previously suggested [20]. This may indicate another possible functional involvement of PNPLA3 in the progression of liver fibrosis by influencing the circulating hyaluronic acid levels. A weak association of rs738409 and HbA1c levels was observed in our study population. However, there are no reports to date indicating such an association, and confirmation with different sample sets is needed for definitive conclusion. Also, the association between rs738409 and iron deposition was demonstrated by an ordinal logistic regression analysis. Since the association still remained after the results were adjusted with Matteoni type, rs738409 may play a functional role in the oxidative stress through iron absorption in the liver.
Recently, a genetic analysis of Japanese NAFLD patients was reported demonstrating a significant association in the increase of AST, ALT, ferritin levels and fibrosis stage (Brunt stage) and in the decrease of serum triglyceride with the risk allele (G) of rs738409 [12]. In our study, the association of rs738409 with AST (p= 1.261024) and ALT (p= 0.0016) was reproduced and that of AST still remained after the results were adjusted for Matteoni type (p= 0.038). No association was observed for ferritin level. Brunt stage was available for Matteoni type4 patients only in our study. Although the odds ratio was slightly high (OR = 1.28, 95%CI: 0.95–1.72), it was not possible to examine the association. In addition, the inverse association of the risk allele of rs738409 with decrease of serum triglyceride was confirmed in our study (p= 0.013 after being adjusted for Matteoni type). For all of these Figure 3. Histogram of odds ratios for genotype distribution of rs738409 between Matteoni types.Each box denotes the odds ratio (OR) comparing the corresponding Matteoni types on the horizontal axes. N represents the number of samples. Odds ratios andp-values are calculated for the higher Matteoni type per risk allele (G) on additive model by multivariable logistic regression adjusted for age, sex and BMI, and are shown with 95% CI above each box.
biomarkers, however, the significance was lost after the correction for multiple testing.
A replication analysis of other genetic loci that had been reported for their association with NAFLD in East coast white Americans [14] was performed in our sample collection. We confirmed the association of rs780094 inGCKRwith NAFLD in a case/control analysis but at a much weaker level (p= 0.011, OR = 0.82, 95%CI: 0.70–0.95) than that shown for the popula-tions of European-descent. No associapopula-tions were found for LYPLAL1andNCANloci in our study. There are several reasons to explain such differences, such as the insufficient statistical power with a limited number of study subjects in our study due to the difficulty in the collection of a larger number of histologically diagnosed NAFLD patients. The difference in genetic background between the Japanese and Europeans is also conceivable. Indeed, the risk allele frequency of rs12137855 inLYPLAL1was 0.944 in our control subjects but approximately 0.79 in the European populations [14]. Similarly, there was a difference in the risk allele
frequency of rs2228603 inNCAN(0.049 in Japanese and 0.08 in Europeans). Rs4240624 inPPP1R3Bwas not polymorphic in the Japanese while its risk allele frequency was 0.91 in Europeans.
Materials and Methods
Ethics Statement
In compliance with the Declaration of Helsinki, ethical approval for this study was given by the respective Institutional Review Board and subject written informed consent were obtained for all subjects (Ethical committee of Nara City Hospital; Ethical committee of Saiseikai Suita Hospital; Medical Ethics Committee of Kanazawa University; Ethics committee of Kyoto Prefectural University of Medicine; Ethical Committee of Aichi Cancer Center; Ethical Committee of Kochi Medical School, Kochi University; Ethics Committee of Tokyo Women’s Medical University; Ethical Committee on Kawasaki Medical School and Kawasaki Medical School Hospital; Ethical Committee of
Table 3.Association of rs738409 with clinical traits.
Biochemical traits Statistical calculation1 Statistical calculation 2
Phenotype Coef. (S.E.) p-value Coef. (S.E.) p-value
Biological traits
AST (IU/L) 0.22 (0.056) 1.261024 0.11 (0.052) 0.038
ALT (IU/L) 0.19 (0.058) 0.0016 0.093 (0.056) 0.098
GGT (IU/L) 20.056 (0.061) 0.37 20.088 (0.062) 0.16 Albumin (g/dL) * 0.015 (0.051) 0.77 20.012 (0.052) 0.81 Total bilirubin (mg/dL) 20.011 (0.063) 0.86 0.0059 (0.064) 0.93 Cholinesterase (unit) * 0.062 (0.040) 0.12 0.069 (0.041) 0.092 Type IV collagen 7S (ng/dL) * 20.19 (0.064) 0.0025 20.11 (0.062) 0.069 Hyaluronic acid (ng/dL) 0.30 (0.065) 4.961026 0.22 (0.063) 4.661024 Triglycerides (mg/dL) 20.10 (0.058) 0.072 20.15 (0.059) 0.013 Total cholesterol (mg/dL) 20.066 (0.060) 0.27 20.057 (0.061) 0.34
HbA1c (%) 20.17 (0.053) 0.0012 20.18 (0.054) 0.0011
IRI (mg/dL) 0.16 (0.063) 0.012 0.086 (0.061) 0.16
FPG (mg/dL) 20.14 (0.049) 0.0047 20.15 (0.05) 0.0035
HOMA-IR 0.084 (0.064) 0.19 0.0092 (0.062) 0.88
Hs-CRP (mg/dL) 20.013 (0.048) 0.79 20.031 (0.049) 0.52 Adiponectin (mg/mL) 0.048 (0.066) 0.47 0.12 (0.066) 0.072
Leptin (ng/mL) 0.11 (0.068) 0.11 0.10 (0.069) 0.15
Ferritin (ng/mL) 0.031 (0.047) 0.51 20.0042 (0.048) 0.93 Uric acid (mg/dL) 20.097 (0.061) 0.11 20.11 (0.062) 0.067 PLT (x104/
mL) 20.056 (0.020) 0.0052 20.045 (0.020) 0.028
Immunological/histological traits
ANA (0/1/2/3/4) 0.92 (0.70–1.21) 0.56 0.86 (0.65–1.15) 0.31 Brunt grade (1/2/3) 1.42 (1.06–1.92) 0.021 1.38 (1.02–1.87) 0.036 Brunt stage (1/2/3/4) 1.28 (0.95–1.72) 0.11
Fat deposition (1/2/3/4) 1.44 (1.15–1.81) 0.0019 1.24 (0.98–1.56) 0.76 Iron deposition (0/1/2/3/4) 0.61 (0.47–0.80) 3.061024 0.62 (0.47–0.81) 5.661024
Associations between distribution of rs738409 genotypes and clinical traits are calculated by multivariable regression. Statistical calculation1 is adjusted for age, sex and BMI, while the Matteoni types are additionally included as covariate in statistical calculation 2. Statistics are calculated by multivariable linear regression for biochemical traits and by multivariable ordinal logistic regression for immunological and histological traits.
Coefficients and odds ratios are calculated for the increase of each trait per risk allele (G). Thep-values showing significance after Bonferroni’s correction for multiple testing (p= 0.0021) was shown in bold.
Juntendo University; Ethics Committee of Yamagata University School of Medicine; Ethical Committee of the Ikeda Municipal Hospital; Institutional Review Board and Ethics Committee of Kyoto University School of Medicine).
Study Population
A total of 543 patients histologically diagnosed for NAFLD in 2007–2009 were recruited through the Japan study of Nonalco-holic Fatty Liver Disease. Biopsy specimens were stained with H&E and Masson’s trichrome for morphological review and assessment of fibrosis. Perl’s Prussian blue was performed to evaluate iron load. Biopsy specimens were reviewed by a hepatopathologist (T.O). NAFLD patients were classified into four categories by liver histology according to the classification by Matteoni et al [2] as follows; type1: fatty liver alone, type2: fat accumulation and lobular inflammation, type3: fat accumulation and ballooning degeneration, type4: fat accumulation, ballooning degeneration, and either Mallory-Denk body or fibrosis. With these criteria, the 543 patients were classified as type1; 102, type2; 75, type3; 31 and type4; 335. The histological grade and fibrosis stage were also evaluated by the classification of Bruntet al[21] for advanced NAFLD cases (type3 and type4) as follows; grade 1: steatosis involving up to 66% of biopsy, occasional ballooned zone 3 hepatocytes and absence or mild portal chronic inflammation, grade2: steatosis, ballooning hepatocytes mild to moderate chronic inflammation, grade3: panacinar steatosis, ballooning and disarray obvious and mild or portal mild to moderate inflammation, stage1: perivenular and/or perisinusoidal fibrosis in zone3, stage2: combined pericellular portal fibrosis, stage3: septal/bridging fibrosis, stage4: cirrhosis. The degree of fat deposition was evaluated by amount of fat droplets as observed under the microscope as follows; 0:,5%, 1: 5–,10%, 2: 10–,34%, 3: 34– ,67%, 4:.67%. The degree of iron deposition was categorized by the presence of granules of free iron observed under the microscope as follows; 0: absence by x400, 1: easily identifiable by x400 and rarely identifiable by x250, 2: identifiable by x100, 3: identifiable by x25, 4: identifiable at lower than x25.
Inclusion criteria for NAFLD patients were as follows; (i) no history of alcoholism, (ii) no history for HBV/HCV/HIV infection, (iii) diagnosed by liver biopsy, (iv) information regarding age and BMI available. The sex of two samples was unknown, and was imputed from the results of the genome scan. As general Japanese population controls, the genome scan results of 942 healthy Japanese volunteers from Aichi Cancer Center Hospital and Research Institute were used [22].
Anthropometric and Laboratory Evaluation
We employed conventional methods for the measurement of anthropometry (height, weight, amount of visceral fat and abdominal circumscript). BMI was calculated from the measure-ments. The following biochemical/hematological/immunological traits were also measured by conventional methods; aspartate aminotransferase (AST), alanine aminotransferase (ALT), c-glutamyl transpeptidase (GGT), albumin, total bilirubin, cholin-esterase, type IV collagen 7S, hyaluronic acid, triglyceride, total cholesterol, hemoglobin A1c (HbA1c), fasting immunoreactive insulin (IRI), fasting plasma glucose (FBS), high sensitive CRP (hs-CRP), adiponectin, leptin, ferritin, uric acid, and platelet (PLT) count. Anti nuclear antibody (ANA) was measured by ELISA and categorized by the detection limit in a serial dilution as follows; 0: ,40x, 1: 40–80x, 2: 81–160x, 3: 160x, 4: .320x. Homeostasis model assessment-insulin resistance (HOMA-IR) was calculated from the measurements. Patients were assigned a diagnosis of diabetes mellitus (DM) when they had documented use of oral
hypoglycemic medication, a random glucose level.200 mg/dl, or FPG .126 mg/dl. Hyperlipidemia was diagnosed with the cholesterol level being .200 mg/dl and/or triglyceride level being.160 mg/dl. Hypertension was diagnosed when the patient was taking antihypertensive medication and/or had a resting recumbent blood pressure §140/90 mmHg on at least two occasions.
DNA Preparation
Genomic DNA was extracted from peripheral blood mononu-clear cells by standard phenol-chloroform extraction and resus-pended in TE buffer. DNA concentration and purity were measured with Nanodrop 1000 spectrophotometer (Thermo Scientific, Waltham, MA, USA). The samples were stored at 220uC until use.
Genome-wide Genotyping and Quality Control
Genome scan was conducted for 543 patients with NAFLD and 942 healthy subjects using Illumina Human 610-Quad Bead Chip on a Bead Station 500G Genotyping System (Illumina, Inc., San Diego, CA, USA) and subjected to the following quality controls. Initially, ten patients and six control subjects were removed due to low call rates (,0.99). Regarding the SNP markers, 85,472 SNPs with minor allele frequency of smaller than 0.01 in either case or control group, 6,479 SNPs with lower success rates (,0.98) and 35 SNPs with distorted Hardy-Weinberg equilibrium (p,1027
) were removed, resulting in 484,751 SNP markers being used for analysis. Principal component analysis by EIGENSOFT [17] including phase II HapMap (http://hapmap.ncbi.nlm.nih.gov/) samples identified no samples that were deviated from the Japanese population. Subsequently, the degree of kinship between individuals was examined by pi-hat in PLINK 1.07 (http://pngu. mgh.harvard.edu/purcell/plink/) [23]. Of the eight pairs of samples (four case pairs and four control pairs) showing high degrees of kinship (PI-HAT.0.4), the sample with the lower call rate in each pair was removed. After these steps, 529 case and 932 controls were used for the analysis.
Statistical Analysis
Supporting Information
Figure S1 QQ plot of the GWA study comparing
distribution of the observed and expected p-values.
Upper box is expressed in antilog scale and the lower box is expressed in –log10 scale. The X- and Y-axis correspond to expected and observedp-values. Blue and red dots denote before and after correction by genomic control method (l= 1.04), respectively.
(DOC)
Table S1 List of the SNPs showing p,1.061025 in the
GWA study.Reference (A1) and non-reference (A2) alleles refer to NCBI Reference Sequence Build 36.3 with the effective allele marked by an asterisk. Genotyping results are shown by genotype count of A1A1/A1A2/A2A2 with allele frequency of A2 in parenthesis.{P-values are calculated by exact trend test with odds ratios (OR) calculated for A2 with 95% confidence interval (CI).
{P-values are calculated by Jonckheere-Terpstra test in NAFLD patients for Matteoni type and additive model of genotype. SNPs are ordered by chromosomal location.
(DOC)
Acknowledgments
The authors would like to thank Yutaka Kohgo, Hirofumi Uto and Tetsuo Takehara for sample collection and Hisako Imamura and Hiroyuki Uneme for data management.
Author Contributions
Conceived and designed the experiments: FM TO. Performed the experiments: MT M. Kokubo. Analyzed the data: TK RY FM. Contributed reagents/materials/analysis tools: TK YS AU KM MT TT KY T. Saibara EH M. Kokubo SW SK YI M. Kawanaka T. Shima HP HT KT RY. Wrote the paper: TK MT RY FM TO.
References
1. Ludwig J, Viggiano TR, McGill DB, Oh BJ (1980) Nonalcoholic steatohepatitis: Mayo Clinic experiences with a hitherto unnamed disease. Mayo Clin Proc 55: 434–438.
2. Matteoni CA, Younossi ZM, Gramlich T, Boparai N, Liu YC, et al. (1999) Nonalcoholic fatty liver disease: a spectrum of clinical and pathological severity. Gastroenterology 116: 1413–1419.
3. Cohen JC, Horton JD, Hobbs HH (2011) Human fatty liver disease: old questions and new insights. Science 332: 1519–1523. doi:10.1126/sci-ence.1204265.
4. Vernon G, Baranova A, Younossi ZM (2011) Systematic review: the epidemiology and natural history of alcoholic fatty liver disease and non-alcoholic steatohepatitis in adults. Aliment Pharmacol Ther 34: 274–285. doi:10.1111/j.1365–2036.2011.04724.x.
5. Okanoue T, Umemura A, Yasui K, Itoh Y (2011) Nonalcoholic fatty liver disease and nonalcoholic steatohepatitis in Japan. J Gastroenterol Hepatol 26 Suppl 1: 153–162. doi:10.1111/j.1440–1746.2010.06547.x.
6. Williams CD, Stengel J, Asike MI, Torres DM, Shaw J, et al. (2011) Prevalence of nonalcoholic fatty liver disease and nonalcoholic steatohepatitis among a largely middle-aged population utilizing ultrasound and liver biopsy: a prospective study. Gastroenterology 140: 124–131. doi:10.1053/j.gas-tro.2010.09.038.
7. Okanoue T (2011) Recent progress in the research of NASH/NAFLD in Japan. Nihon Shokakibyo Gakkai Zasshi 108: 1161–1169.
8. Berson A, De Beco V, Lette´ron P, Robin MA, Moreau C, et al. (1998) Steatohepatitis-inducing drugs cause mitochondrial dysfunction and lipid peroxidation in rat hepatocytes. Gastroenterology 114: 764–774.
9. Day CP (2006) From fat to inflammation. Gastroenterology 130: 207–210. doi:10.1053/j.gastro.2005.11.017.
10. Romeo S, Kozlitina J, Xing C, Pertsemlidis A, Cox D, et al. (2008) Genetic variation in PNPLA3 confers susceptibility to nonalcoholic fatty liver disease. Nat Genet 40: 1461–1465. doi:10.1038/ng.257.
11. Sookoian S, Castan˜o GO, Burguen˜o AL, Gianotti TF, Rosselli MS, et al. (2009) A nonsynonymous gene variant in the adiponutrin gene is associated with nonalcoholic fatty liver disease severity. J Lipid Res 50: 2111–2116. doi:10.1194/jlr.P900013-JLR200.
12. Hotta K, Yoneda M, Hyogo H, Ochi H, Mizusawa S, et al. (2010) Association of the rs738409 polymorphism in PNPLA3 with liver damage and the development of nonalcoholic fatty liver disease. BMC Med Genet 11: 172. doi:10.1186/1471– 2350–11–172.
13. Sookoian S, Pirola CJ (2011) Meta-analysis of the influence of I148M variant of patatin-like phospholipase domain containing 3 gene (PNPLA3) on the susceptibility and histological severity of nonalcoholic fatty liver disease. Hepatology 53: 1883–1894. doi:10.1002/hep.24283.
14. Speliotes EK, Yerges-Armstrong LM, Wu J, Hernaez R, Kim LJ, et al. (2011) Genome-wide association analysis identifies variants associated with nonalco-holic Fatty liver disease that have distinct effects on metabolic traits. PLoS Genet 7: e1001324. doi:10.1371/journal.pgen.1001324.
15. Petersen KF, Dufour S, Hariri A, Nelson-Williams C, Foo JN, et al. (2010) Apolipoprotein C3 gene variants in nonalcoholic fatty liver disease. N Engl J Med 362: 1082–1089. doi:10.1056/NEJMoa0907295.
16. Terao C, Yamada R, Ohmura K, Takahashi M, Kawaguchi T, et al. (2011) The human AIRE gene at chromosome 21q22 is a genetic determinant for the predisposition to rheumatoid arthritis in Japanese population. Human Molecular Genetics 20: 2680–2685. doi:10.1093/hmg/ddr161.
17. Price AL, Patterson NJ, Plenge RM, Weinblatt ME, Shadick NA, et al. (2006) Principal components analysis corrects for stratification in genome-wide association studies. Nat Genet 38: 904–909. doi:10.1038/ng1847.
18. Yasui K, Hashimoto E, Komorizono Y, Koike K, Arii S, et al. (2011) Characteristics of patients with nonalcoholic steatohepatitis who develop hepatocellular carcinoma. Clin Gastroenterol Hepatol 9: 428–433; quiz e50. doi:10.1016/j.cgh.2011.01.023.
Table 4.Replication study of previously reported SNPs.
Genotyping Result and Allele Frequency of A2 Statistics
NAFLD NAFLD vs. Control Matteoni
dbSNPID A1/A2 Gene Control Type 1 Type 2 Type 3 Type 4 p-value{ OR (95%CI) p-value{ rs12137855 C*/T LYPLAL1 828/102/2 90/10/0 67/6/0 24/5/0 294/33/0 0.55 0.89 0.98
(0.056) (0.050) (0.041) (0.086) (0.050) (0.64–1.25) rs780094 T*/C GCKR 321/433/178 34/54/12 28/34/11 17/11/1 133/139/55 0.011 0.82 0.92
(0.423) (0.390) (0.383) (0.224) (0.381) (0.70–0.95)
rs4240624 G/A PPP1R3B – – – – – – – –
rs2228603 C/T* NCAN 842/88/2 93/7/0 65/8/0 28/1/0 292/31/4 0.80 1.05 0.58 (0.049) (0.035) (0.054) (0.017) (0.059) (0.75–1.48)
19. He S, McPhaul C, Li JZ, Garuti R, Kinch L, et al. (2010) A Sequence Variation (I148M) in PNPLA3 Associated with Nonalcoholic Fatty Liver Disease Disrupts Triglyceride Hydrolysis. J Biol Chem 285: 6706–6715. doi:10.1074/ jbc.M109.064501.
20. Ueno T, Inuzuka S, Torimura T, Tamaki S, Koh H, et al. (1993) Serum hyaluronate reflects hepatic sinusoidal capillarization. Gastroenterology 105: 475–481.
21. Brunt EM, Janney CG, Di Bisceglie AM, Neuschwander-Tetri BA, Bacon BR (1999) Nonalcoholic steatohepatitis: a proposal for grading and staging the histological lesions. Am J Gastroenterol 94: 2467–2474. doi:10.1111/j.1572– 0241.1999.01377.x.
22. Suzuki T, Matsuo K, Sawaki A, Mizuno N, Hiraki A, et al. (2008) Alcohol Drinking and One-Carbon Metabolism-Related Gene Polymorphisms on
Pancreatic Cancer Risk. Cancer Epidemiology Biomarkers & Prevention 17: 2742–2747. doi:10.1158/1055–9965.EPI-08–0470.
23. Purcell S, Neale B, Todd-Brown K, Thomas L, Ferreira MAR, et al. (2007) PLINK: A Tool Set for Whole-Genome Association and Population-Based Linkage Analyses. Am J Hum Genet 81: 559–575.
24. Yamada R, Okada Y (2009) An optimal dose-effect mode trend test for SNP genotype tables. Genet Epidemiol 33: 114–127. doi:10.1002/gepi.20362. 25. Devlin B, Roeder K (1999) Genomic control for association studies. Biometrics
55: 997–1004.