© 2008 Science Publications
Corresponding Author: Mahmoud Yahyai, Faculty of Civil Engineering, K.N. Toosi University of Technology, P.O. Box 15875-4416, Tehran, Iran
Soil Structure Interaction between Two Adjacent
Buildings under Earthquake Load
Mahmoud Yahyai, Masoud Mirtaheri, Mehrab Mahoutian, Amir Saedi Daryan and Mohammad Amin Assareh
Faculty of Civil Engineering, K.N. Toosi University of Technology, P.O. Box 15875-4416, Tehran, Iran
Abstract: In some cases, tall buildings are located in geotechnically unsuitable places, due to their high ratio of height to width; there is risk of uplift and other effects such as overturning and reduction structure serviceability during earthquake. This research is aimed to evaluate the effect of Soil-Structure Interaction (SSI) on seismic behavior of two adjacent 32 story buildings such as time period, base shear and displacements. The interaction effects are investigated for variable distance between the two buildings. Three types of soil such as soft clay, sandy gravel and compacted sandy gravel are considered for this study. The result obtained that the interaction effect increases time period of both buildings base shear and lateral displacement of the structures increases.
Key words: Soil structure interaction, adjacent buildings, shear wall, earthquake loading
INTRODUCTION
A method has been presented for evaluation of structures with a risk of foundation uplift or slip[1]. In general, foundation uplift or slip causes immediate instability in structures. Hence, it is recommended to avoid this effect in structures. Research has shown that Soil-Structure Interaction increases the time period and damping in structural models[2]. These effects are more considerable in soft soil to compact soil.
The results of analytical-experimental studies proved that increasing of time period and damping in tall buildings is more than low-rise buildings and these effects are negligible in upper modes. Additionally with increase of structure damping, the effects of SSI (Soil-Structure Interaction) are decreases. Researchers have examined the effects of SSI in pounding of two adjacent structures[3]. Both of subsoil and high time period pounding can increase the potential of pounding of two adjacent structures. Pounding may cause inciting the upper modes. The SSI has decreasing effects in low and high frequencies, especially near the natural frequency of structure. In this study first the effect of SSI and then the effect of Structure-Soil-Structure Interaction (SSSI) with assuming a real model on the soil are investigated.
MATERIALS AND METHOD
Two adjacent buildings with foundation and subsoil were selected to evaluate the effects of SSI. The
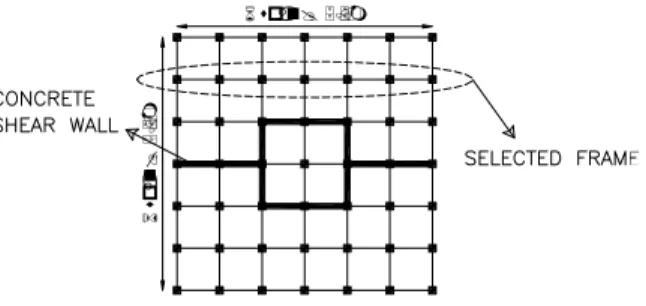
selected buildings are located in north of Tehran-Iran. The system of structures is steel moment frame with concrete shear walls. The height of structures, the width of first three stories and the width of other stories are 100, 44 and 33m respectively. The story plan is shown in Fig. 1.
The connection of steel beams to shear wall is hinged and column sections are box and their connections to the foundation are moment connections. The floor type is composite. The distance between two structures is 18 m and the soil type is type II with C = 0.2 kg cm−2 and ϕ =35°. For modal analysis three types of soil are selected according to Iranian seismic code. Module of Elasticity for soil type I, II and III are 15, 65 and 100 MPa respectively. Poison ratio for all types of soil is assumed as 0.3. Barghi recommended that it is better neglecting variation of this ratio.
Fig. 2: Longitudinal section of structures
Fig. 3: Sample model of subsoil, foundation and structure
Foundation of structures is mat caisson foundation with 4.1m thickness.
Due to large number of frames and similarity of time period in 2D and 3D structures, a 2D frame is modeled in ANSYS5.4. This selection not only does not have any considerable influence in results but also decreases the time of analysis. The constructed model contains soil, foundation and structures as it is shown in Fig. 1 and 2. The distance between two structures is,'d' and '2a' is the width of the foundation.
Soil, foundation and structure frames are modeled using BEAM3, SHELL43 and SOLID42 elements respectively. BEAM3 is a uniaxial element with tension, compression and bending capabilities. This element has three degrees of freedom at each node: translations in the nodal x and y directions and rotation about the nodal z axes. SOLID42 is used for 2D modeling of structure. This element can be used as a plane element. This element is defined by four nodes having two degrees of freedom at each node: translations in the nodal x and y directions. SHELL43 is well suited to model linear, warped and moderately-thick shell structure. This element has six degrees of freedom at each node: translations and rotations in the nodal x, y and z directions.
In modeling of soil, dampers and springs are not used, but the length is taken as three times the height of structure and depth of the soil model is assumed as one height of the building as it is shown in Fig. 3. The mesh size of soil elements near the bottom area of the structure is smaller than other regions of soil.
0.000 5.000 10.000 15.000 20.000 25.000
1 2 3 4 5
Mode
p
e
rc
e
n
t I
n
c
reas
e
of
T
im
e
P
e
ri
od
Fig. 4: Percent increase of time period of one building
-1.500 -1.000 -0.500 0.000 0.500 1.000 1.500 2.000
0.0 1.0 2.0 3.0 4.0 5.0
d/a
P
er
cen
tag
e i
n
cr
eas
e o
f
ti
m
e p
er
io
d
Mode 1 Mode 2 Mode 3 Mode 4 Mode 5
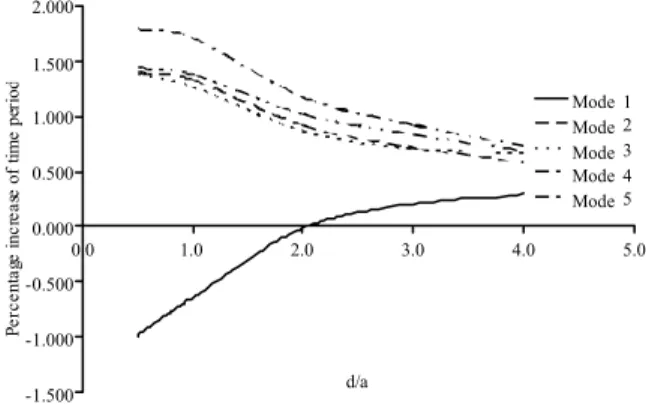
Fig. 5: Percent increase of time period of two adjacent buildings to one building on soil type I
-1.500 -1.000 -0.500 0.000 0.500 1.000 1.500 2.000
0.0 1.0 2.0 3.0 4.0 5.0
d/a
P
er
cen
tag
e i
n
cr
eas
e o
f
ti
m
e p
er
io
d
Mode 1 Mode 2 Mode 3 Mode 4 Mode 5
Fig. 5: Percent increase of time period of two adjacent buildings to one building on soil type I
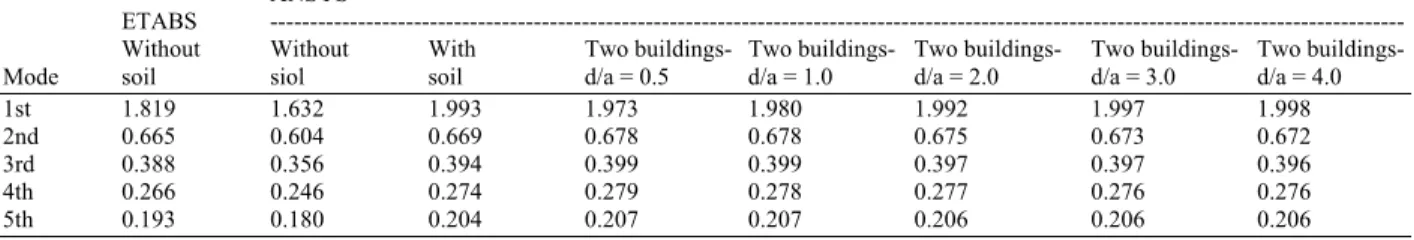
Table 1: Comparison of time period modal analysis in soil type I in second
ANSYS
ETABS ---
Without Without With Two buildings- Two buildings- Two buildings- Two buildings- Two buildings-
Mode soil siol soil d/a = 0.5 d/a = 1.0 d/a = 2.0 d/a = 3.0 d/a = 4.0
1st 1.819 1.632 1.993 1.973 1.980 1.992 1.997 1.998
2nd 0.665 0.604 0.669 0.678 0.678 0.675 0.673 0.672
3rd 0.388 0.356 0.394 0.399 0.399 0.397 0.397 0.396
4th 0.266 0.246 0.274 0.279 0.278 0.277 0.276 0.276
5th 0.193 0.180 0.204 0.207 0.207 0.206 0.206 0.206
Table 2: Comparison of time period modal analysis in soil type II in second
ANSYS
ETABS ---
Without Without With Two buildings- Two buildings- Two buildings- Two buildings- Two buildings-
Mode soil siol soil d/a = 0.5 d/a = 1.0 d/a = 2.0 d/a = 3.0 d/a = 4.0
1st 1.819 1.632 1.797 1.793 1.801 1.798 1.799 1.799
2nd 0.665 0.604 0.647 0.649 0.649 0.648 0.648 0.648
3rd 0.388 0.356 0.381 0.382 0.382 0.382 0.382 0.382
4th 0.266 0.246 0.264 0.266 0.266 0.265 0.265 0.265
5th 0.193 0.180 0.197 0.196 0.196 0.195 0.195 0.195
Table 3: Comparison of time period modal analysis in soil type III in second
ANSYS
ETABS ---
Without Without With Two buildings- Two buildings- Two buildings- Two buildings- Two buildings-
Mode soil siol soil d/a = 0.5 d/a = 1.0 d/a = 2.0 d/a = 3.0 d/a = 4.0
1st 1.819 1.632 1.776 1.773 1.774 1.775 1.777 1.777
2nd 0.665 0.604 0.644 0.646 0.646 0.646 0.645 0.645
3rd 0.388 0.356 0.380 0.381 0.381 0.380 0.380 0.380
4th 0.266 0.246 0.263 0.264 0.264 0.264 0.264 0.264
5th 0.193 0.180 0.194 0.194 0.194 0.194 0.194 0.194
- 1.000 - 0.800 - 0.600 - 0.400 - 0.200 0.000 0.200 0.400 0.600
0.0 1.0 2.0 3.0 4.0 5.0
d/a
Pe
rc
e
n
ta
ge i
n
cr
ea
se
o
f
ti
m
e p
er
io
d
Mode 1 Mode 2 Mode 3 Mode 4 Mode 5
Fig. 6: Percent increase of time period of two adjacent buildings to one building on soil type II
analyzed at various distances d/a = 0.5, 1.0, 2.0, 3.0, 4.0.
Figure 4 shows the Percent increase of time period of a single structure on subsoil to a single structure with rigid foundation for the first five modes. Three types of soft clay, sandy gravel and compacted sandy gravel are considered for this study. As it is obvious from this figure, first mode has a maximum increase of time period and from second mode it remains almost
-0.200 -0.100 0.000 0.100 0.200 0.300 0.400
0.0 1.0 2.0 3.0 4.0 5.0
d/a
P
er
cen
tag
e i
n
cr
eas
e
o
f t
im
e
p
er
io
d
Mode 1 Mode 2 Mode 3 Mode 4 Mode 5
Fig. 7: Percent increase of time period of two adjacent buildings to one building on soil type III
constant. As it is expected, the softer the soil, the higher the time period of vibration.
- 10 - 8 - 6 - 4 - 2 0 2 4 6 8
0 5 10 15 20 25
Tim e (sec)
Ds
(m
a
x
)/
D
i(m
a
x)
with soil d/a = 0.5 d/ a = 1.0
d/a = 2.0 d/a = 3.0
Fig. 8: Comparison lateral displacement of two adjacent structures to the single structure
0.5 0.7 0.9 1.1 1.3 1.5 1.7 1.9 2.1 2.3 2.5
0 1 2 3 4 5 6
Time (sec)
With soil d/a =0.5 d/a =1.0 d/a =2.0 d/a =3.0
As
(m
a
x
)/
Ai
(m
a
x)
Fig. 9: Comparison vertical displacement of two adjacent structures to the single structure
structures), the effect of SSSI causes decreasing the time period for the first mode and vise-versa.
Dynamic analysis: Dynamic analysis is used for of comparison of the response of a single structure with two adjacent structures on subsoil. These structures are modeled with real soil type with C = 0.2 kg cm−2 and
ϕ = 35°.
Three earthquake records as Tabas, Naghan and Elcentro are applied to the bottom of soil. The variation of displacements and base shear in two buildings (SSSI) to single building (SSI) are evaluated for the whole duration time of applied records.
The comparison of maximum lateral displacement of two adjacent buildings (SSSI) with various distances to a single building (SSI) under Tabas record. If the distance of two structures decreases, this ratio increases. As it can be shown in Fig. 8, the maximum interaction effect occur at d/a = 0.5, 1.0, 2.0. At longer distances this effect would be negligible. In Naghan and Elcentro records, the same results were obtained.
The comparison of maximum vertical displacement of two adjacent buildings (SSSI) in various distances to a single building (SSI) is shown in Fig. 9 when Naghan earthquake record is applied. If the distance of two structures decreases, this ratio increases. As Fig. 8
0 5 10 15 20 25
0 5 10 15 20 25 30
Tim e (sec)
Ss
(m
a
x
)/
Si
(m
a
x
) With soil
d /a =0.5 (1) d /a =0.5 (2) d /a =1.0 (1) d /a =1.0 (2)
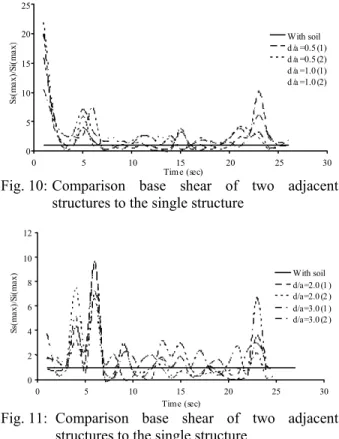
Fig. 10: Comparison base shear of two adjacent structures to the single structure
0 2 4 6 8 10 12
0 5 10 15 20 25 30
Tim e (sec)
With soil d/a=2.0 (1 ) d/a=2.0 (2 ) d/a=3.0 (1 ) d/a=3.0 (2 )
S
s(m
a
x
)/
S
i(m
a
x
)
Fig. 11: Comparison base shear of two adjacent structures to the single structure
shows, the maximum effects occur in d/a = 0.5 and 1.0. As the distances between two structures decreases the interaction effect of SSSI to SSI on vertical displacement.
Figure 10 and 11 shows the ratio of base shear for two buildings to isolated one in varying distances to on subsoil under Elcentro earthquake record. As it is shown, for two buildings two base shear is obtained that it causes by different primary deformation of soil and structure. In the beginning of quake applying, if the distance of two structures decreases, the base shear increases, but in continuing the base shear in SSSI and SSI does not vary considerably.
The ratio of lateral displacement and shear force in two buildings to single building on subsoil become huge and unbelievable value. This is for no much effects of SSSI, perhaps for differs of these parameters in that time. Due to assuming soil under structure, the time of the quake waves to foundation is changed. The ratio of maximum lateral displacement and maximum base shear of two adjacent buildings to the single building on subsoil is shown in Fig. 12 and 13.
0 0.5 1 1.5 2 2.5 3
0 1 2 3 4 5
d/a
Tabas Nagan Elcentro
Ds
(m
a
x
)/
Di
(m
a
x)
Fig. 12: Maximum Lateral displacement of two adjacent structures to the single structure
0 0.5 1 1.5 2 2.5
0 1 2 3 4 5
d/a
Ss
(m
a
x
)/
Si
(m
a
x
)
Tabas Nagan Elcentro
Fig. 13: Maximum base shear of two adjacent structures to the single structure
minimum effects occur in d/a = 2.0. Because of sine waves in soil for placing one building on subsoil, the graphs of Fig. 12 and 13 become 'v' shape, which it goes damping with increasing of the distances.
CONCLUSION
Assuming the effects of Structure-Soil-Structure Interaction (SSSI), causes time period to increase and by increasing the distance between two buildings, time period increases in first mode, but in other modes time period escalating decreases by rising the distances between two buildings. The effect of SSSI causes effect in maximum lateral displacement in d/a = 0.5, 1.0, 2.0. Base shear ratio of two adjacent buildings to single building on subsoil increases very much under Elcentro, Tabas and Naghan records.
Totally, due to archiving results, the SSSI effects causes the time period increasing of buildings and considering of this effect often causes increasing the base shear and displacements and these increasing depends on the distance of two adjacent buildings. The SSSI effects changes the maximum lateral displacement up to three times to without considering the SSSI effects and the applying base shear up to two times to without considering the SSSI effects.
REFERENCES
1. Barghi, K. and A. Nourzad, 2001. Effects of soil structure interaction on foundation under earthquake loading. In: Proceeding in the 5th International Conference of Civil Engineering in Iran, pp: 19-21.
2. Hosseinzade, N. and F. Nateghi, 2003. Study of effects of soil structure interaction in two adjacent buildings on vibrated table. In: Proceeding of the 4th International Conference of Earthquake Engineering in Iran Chapter, pp: 123-134.