Abs tract
Pounding of neighbouring construction of structures due to seis-mic excitation increases the damage of structural components or even causes collapse of structures. Among the possible building damages, earthquake induced pounding has been commonly ob-served in several earthquakes. Therefore it is imperative to con-sider pounding effect for structures. This study aims to under-stand the response behaviour of adjacent buildings with dissimilar heights under earthquake induced pounding. Effects of different separation distances between structures are also investigated. Nonlinear finite element analysis in time domain has been carried out for pounding of neighbouring structures having varying heights. To show the importance of avoiding pounding in struc-tures the results obtained were compared with model having no pounding phenomena. The results were obtained in the form of storey shear, pounding force, storey drift, point displacement and acceleration. The acceleration at pounding level significantly increases during collision of building. The generated extra pound-ing force may cause severe damage to structural members of structures. Pounding produces shear at various story levels, which are greater than those obtained from no pounding case. Building with more height suffers greater damage than shorter building when pounding occurs. Increasing gap distance tends to reduce story shear in consistent manner. The results also show that the conventional modelling of building considering only beams and columns underestimates pounding effects. More realis-tic modelling such as beams, columns and slabs shall be adopted to accurately understand the pounding phenomenon.
Key words
Structural pounding effect; Neighbouring Structures; Pounding level; gap element; Separation distance; Seismic induced blow.
Non-linear FEM Analysis of seismic induced pounding
between neighbouring Multi-storey Structures
1 INTRODUCTION
Under earthquakes excitation, structures will be displaced and deformed. When two structures are close together, it is expected that they will pound against each other. There are many structures
Mo ham m ed Jam ee la, A .B . M. S aif u l Is la ma, Raj a Riz wa n Hu s sa in*, b , Sy ed Dan is h H as anc, M. Kh al ee la
a Department of Civil Engineering, University of Malaya, 50603 Kuala Lumpur, Malaysia
b Asst. Professor, CoE-CRT, Department of Civil Engineering, College of Engineering, King Saud University, Riyadh, Saudi Arabia
c Civil Engineering Section, Aligarh Muslim University, Aligarh-202002, India
Received 05 May 2012 In revised form 04 Feb 2013
Latin American Journal of Solids and Structures 10(2013) 921 – 939
which are built close to each other and could experience seismic pounding in future earthquakes. This situation can be easily seen in highly populated cities. Pounding of adjacent structures increas-es the damage of structural components. It may even cause collapse of structurincreas-es. The earthquake that struck Mexico City in 1985 has revealed the fact that pounding was present in more than 40% of 330 collapsed or severely damaged structures [1]. Furthermore, even in those cases where it does not result in significant structural damage, pounding always induces higher floor acceleration in the form of large magnitude short duration pulses, which in turn cause greater damage to building con-tents [2-5].
Pounding effect for varying separation distance has been covered by several researchers with equal floor heights [6,7]. It is shown that constructing adjacent structures with equal floor heights and separation distances reduces the effects of pounding considerably. Study on seismic separation device has also been performed by several researchers [8-11]. Kasai and Maison [12] investigated the building pounding damage during the 1989 Loma Prieta earthquake. Jankowski [13] presented non-linear viscoelastic modelling of earthquake-induced structural pounding. Jankowski [14] reported that the increase in structural damping of adjacent structures simultaneously leads to the extension of the region in the spectrum where the impact force is equal to zero.
The height ratio of two structures significantly changes the storey shear of structures which was shown by Jeng and Tzeng [15]. Numerical analysis has been conducted by Jankowski [14] for differ-ent mass ratio of structures. The pounding force response spectra for the El Cdiffer-entro earthquake confirm that the increase in mass value leads to considerable increase in peak impact force. Jankow-ski [16] performed non-linear analysis for earthquake-induced pounding of two equal height struc-tures with substantially different dynamic properties. This response analysis show that collisions have a significant influence on the behaviour of the lighter and more flexible building especially in longitudinal direction causing generous amplification of the response and lead to extensive perma-nent deformation due to yielding [17-20]. Associated with the possibility of seismic vulnerability, automated mitigation of responses is required to be assessed [21-26] in construction technology.
Seismic codes and regulations state the minimum separation distances to be provided between adjacent structures which are equal to the relative displacement of two potentially colliding struc-tures. For instance International Building Code [27], Clause 1613.6.7, stated all structures and structures shall be separated from adjoining structures. However, providing large separation dis-tance between structures is not a good solution due to several factors. Firstly, the building code is inconsistent with the actual condition during earthquakes where large inelastic deformations can occur and structures may not be secured. Secondly, the land in high density cities is a valuable asset financially. Thirdly, structural pounding involves structures nearby which may not be devel-oped at the same time or by same party. Therefore, it is necessary to measure pounding effect in building to develop better damage control and more efficient use of land space.
Latin American Journal of Solids and Structures 10(2013) 921 – 939 • the structural response behaviour of structures in seismic-induced pounding in a 3D frame
system with 6 degrees of freedom resembling to practical structures
• The alteration of structural behaviours for dissimilar heights of adjacent structures • the effects of different separation distances in between structures are studied in addition • the parameters in forms of displacement, acceleration, storey drift, pounding force and storey
shear
• the influence of structural mass of adjacent structures on the seismic pounding forces
• the difference of results between different modelling techniques, “frame + slab” model with the only “frame” model
• justify more realistic modelling such as beams, columns and slabs adopted to accurately un-derstand the pounding phenomenon.
2 METHODOLOGY
This study is carried out by analysing reinforced concrete frames using nonlinear time history analysis. Seismic and pounding responses of two multi-storey structures are studied in aspects of displacement, storey drift, pounding force and storey shear. Type of pounding being analysed is the pounding effect where shorter building collides to adjacent taller building. Besides, frame and slab model is modelled to understand the influence of modelling
2.1 Gap Elements in Building Construction
Gap has been defined as link elements in ETABS [28]. It is a compression-only element required to assess the force of pounding and simulate the effect of pounding. The purpose of the gap el e-ment is to transmit the force through link only when contact occurs and the gap is closed. The
nonlinear force-deformation relationship is given by Eqn. (1).
�= �0 �−���� �� �−����<0
��ℎ������ (1)
Where K is the spring constant, d denotes the displacement, and open is the initial gap ope
n-ing, which must be zero or positive.
Stiffness, K for gap elements is recommended one or two orders of magnitude greater than the horizontal equivalent springs representing both structures at fourth storey level. The way of s e-lecting stiffness for the gap elements is chosen as 100 times greater value than the relation AE/L. It this worth mentioning that A is the cross-sectional area of the element, E is the modulus of elasticity, and L is the length of the element in the direction perpendicular to the contact surfa c-es. Therefore, in this model K is calculated as follows.
�=��
� ×100 (2)
�=
������� �� ���������� �� ������������ �� ������� �������
Latin American Journal of Solids and Structures 10(2013) 921 – 939
Energy dissipation during contact can be accounted by damping. Gap element should include the effect of linear effective stiffness and damping to achieve desired contact behaviour.
2.2 Nonlinear Dynamic Analysis of Building Construction
Nonlinear dynamic analysis has been carried out considering familiar earthquake seismic record El Centro. Finite element analysis package ETABS is found to be more appropriate for the current study. The governing equations of motion are obtained considering equilibrium of all forces at each degree of freedom. The equations of motion for the structure are written in Eq. (4).
[M
]{
y
b
}
+
[
C
]{
y}
+
[K
]{y}
=
−
[M
][
T
g]{
y
g}
(4)Where, [M], [K] and [C] are the mass, damping and stiffness matrices of the superstructure re-spectively; {y} and {yb}, are displacement of super structure and base; {ÿb} and {ÿg} are base ac-celeration and acac-celeration relative to the ground; [Tg] is the earthquake influence coefficient matrix.
All nonlinearities are restricted to the nonlinear link elements only. The above dynamic equilib-rium equations considering the super structure as elastic and link as nonlinear can be written as:
[
M
]{
y
(
t
)}
+
[
C
]{
y
(
t
)}
+
[
K
L
]{
y
(
t
)}
+
r
N(
t
)
=
r
(
t
)
−
[
r
N(
t
)
−
K
Ny
(
t
)])
(5)where
K
=
K
L
+
K
N (6)KL= stiffness matrix of all linear elements; KN = stiffness matrix for all of the nonlinear degrees of freedom. C is the proportional damping matrix;
M
is the diagonal mass matrix;r
N is the vector of forces from nonlinear degrees of freedom in the gap elements;
y
,y
, andy
are the relative dis-placement, velocity and acceleration with respect to ground; r is the vector of applied loads. The effective stiffness at nonlinear degrees of freedom is arbitrary, but varies between zero and the max-imum stiffness of that degree of freedom.2.3 Solution Technique
Latin American Journal of Solids and Structures 10(2013) 921 – 939 convergence can not be achieved, the program divides the time step into smaller substeps and tries again.
3 NUMERICAL INVESTIGATION OF STRUCTURES
In this research, two adjacent structures of different height are modelled. The structures are four storeys (16.16 m in height) and seven storeys (28 m in height). The structures are reinforced con-crete frames which consist of square columns of dimension 500 x 500 mm, all beams of dimension 400 x 250 mm. 6 – ASTM #7 bars are provided for every column’s vertical grade-60 steel. In
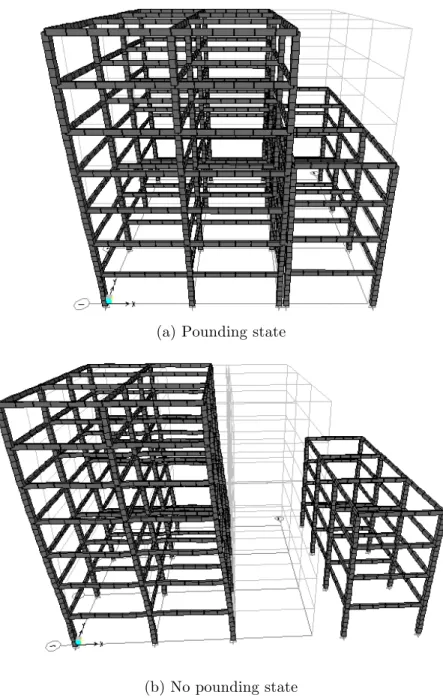
addition, 200mm slab thickness has been chosen in frame-slab model case. Gap elements are linked at 4 nodes between the structures at the roof level of lower building in order to simulate contact between two surfaces by generating forces when the two surfaces approach each other. The plan and elevation of the structures are as in Figure 1 as below.
Latin American Journal of Solids and Structures 10(2013) 921 – 939
Modulus of elasticity of concrete has been chosen as 25000 MPa. Gap is defined as link el e-ments having stiffness 1100000 KN/mm. Energy dissipation during contact is accounted by damping. Gap element includes the effect of linear effective stiffness and damping to achieve d e-sired contact behaviour.
Seismic time history function is selected as the ground excitation data of El Centro earthquake (magnitude 7.1) in year 1940 is used. Total duration of this time history function is 12.113 s e-conds. It has a peak pounding acceleration of 0.319g at time 2.006 see-conds. It is applied for both longitudinal and traverse direction. The graph of the functions is illustrated in Figure 2.
4 RESULTS AND DISCUSSIONS
Most previous researches were often carried out in single degree of freedom system, plane frame and rarely utilize finite element software. In this study, pounding effect of a four and seven storey
structures subjected to seismic load is analysed by using finite element code ETABS [28].
Nonlin-ear time history analysis has been carried out in order to obtain the storey shNonlin-ear, pounding force, storey drift, point displacement and acceleration. Mostly familiar El Centro earthquake, 1940 time history function is applied in both longitudinal and transverse direction to investigate r e-sponse of structures in MDOF system. Influence of separation distance between two structures and effect of different modelling approach by using “frame” and “frame + slab” models are also investigated.
Figure 2 Time history of El Centro earthquake, 1940 ‐0.4
‐0.3 ‐0.2 ‐0.1 0 0.1 0.2 0.3 0.4
0 2 4 6 8 10 12
A
cc
e
le
ar
1
o
n
(
g
)
Latin American Journal of Solids and Structures 10(2013) 921 – 939 4.1 Free vibration analysis in Structures
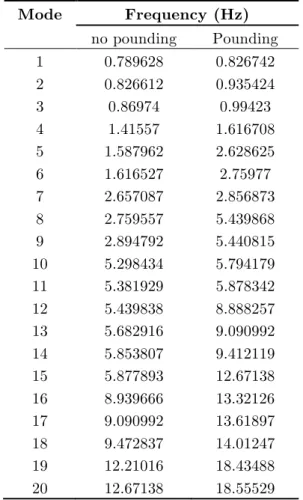
Eigen frequencies of structures both pounding and no pounding case is shown in Table 1. It can be seen that frequency of structures is higher in pounding state for all the first 20 modes of r e-sponse. 20the modal frequency for pounding state is 18.56 Hz while no pounding state is only 12.67 Hz.
Table 1 Natural frequency of buildings for pounding and no pounding state
Mode Frequency (Hz) no pounding Pounding
1 0.789628 0.826742
2 0.826612 0.935424
3 0.86974 0.99423
4 1.41557 1.616708
5 1.587962 2.628625
6 1.616527 2.75977
7 2.657087 2.856873
8 2.759557 5.439868
9 2.894792 5.440815
10 5.298434 5.794179
11 5.381929 5.878342
12 5.439838 8.888257
13 5.682916 9.090992
14 5.853807 9.412119
15 5.877893 12.67138
16 8.939666 13.32126
17 9.090992 13.61897
18 9.472837 14.01247
19 12.21016 18.43488
20 12.67138 18.55529
Latin American Journal of Solids and Structures 10(2013) 921 – 939
(a) Pounding state
(b) No pounding state
Figure 3 Mode 1 response of buildings for (a) pounding sate and (b) no pounding state
4.2 Longitudinal Responses of Structures
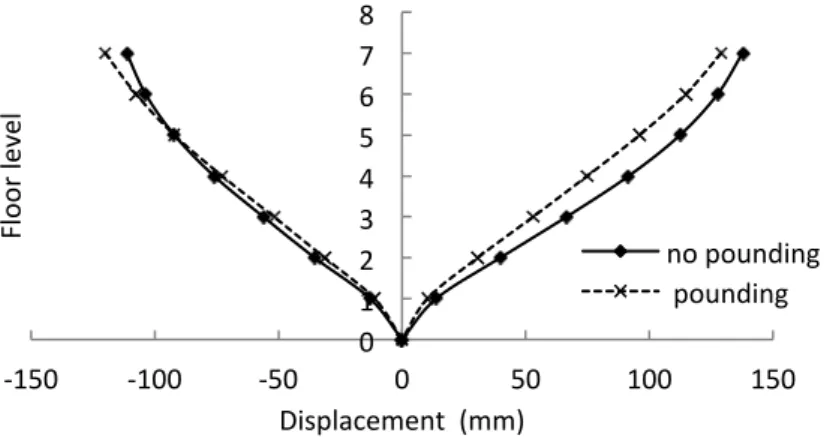
Latin American Journal of Solids and Structures 10(2013) 921 – 939 Figure 4 Maximum displacements at different floors (longitudinal direction)
The highest displacement for both no pounding and pounding case occur at roof level of buil d-ing. Highest roof displacement for no pounding case is 137.62 mm and for pounding case is 129.07 mm. It has been reduced by 8.55 mm. However, maximum displacement movement toward left shows increase in pounding case. It is -119.94 mm while for no pounding case is only -111.35 mm.
It may be due to the flexible nature of taller building that causes it to bounce back after poun d-ing. Maximum negative displacements for floor levels below fifth storey are still lower in poun d-ing state. Generally poundd-ing reduces the lateral displacement throughout the buildd-ing height. The reduction in displacement is more obvious in direction towards right compared to left, which may be due to overall increase of building stiffness while in contact. These patterns of results
have been validated with Maison and Kasai [30]. Similar results had also been obtained in analy t-ical studies for type of structural pounding by Maison and Kasai [30], where analogous reason is also revealed.
Figure 5 Maximum storey drift at different floors (longitudinal direction)
Figure 5 shows storey drift of each level of building in longitudinal direction. It can be clearly seen that storey drift increase in the levels above the pounding level. Beneath the pounding level, storey drift tends to decrease. For both no pounding and pounding case, smallest storey drift exists in first storey of structures which are 0.003912 and 0.002899 respectively. Largest storey
0 1 2 3 4 5 6 7 8
‐150 ‐100 ‐50 0 50 100 150
Floor
le
v
e
l
Displacement (mm)
no pounding pounding
0 1 2 3 4 5 6 7 8
0 0.002 0.004 0.006 0.008
Floor
le
v
e
l
Story driF no pounding
Latin American Journal of Solids and Structures 10(2013) 921 – 939
drift for pounding case occur just above the level of pounding. The peak storey drift is 0.006012 which is 0.000756 more than no pounding case. The pounding of taller adjacent building creates
high storey shear above pounding level. This high storey shear causes the increase in storey drift
on each floor level above pounding location.
4.3 Transverse Responses of Structures
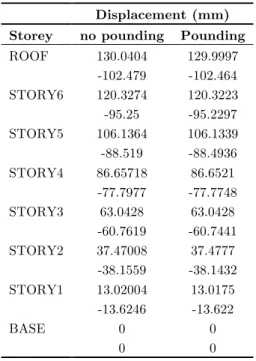
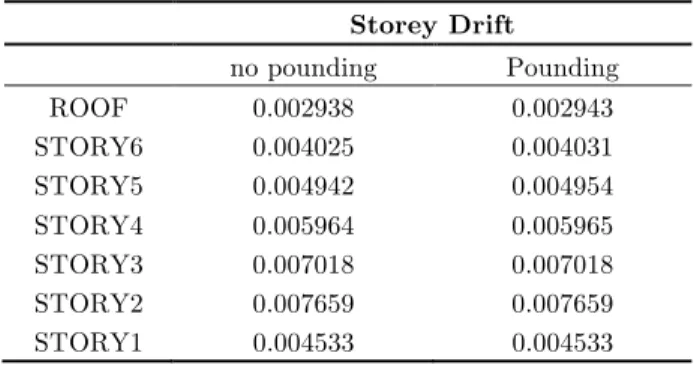
The pounding involved and independent vibration displacements in transverse direction for each floor level are presented in Table 2. The displacement is gradually increasing as the height of structures increases. It also can be seen that in transverse direction there is no significant diffe r-ence in displacement for both pounding and no pounding case. It is because transverse responses of structures are only due to the effect of friction force rather than direct impact force of poun d-ing. It is to mention that the friction between the structures was modelled by a linear compens a-tion spring.
Table 2 Maximum displacement at different floor levels in transverse direction
Displacement (mm) Storey no pounding Pounding
ROOF 130.0404 129.9997
-102.479 -102.464
STORY6 120.3274 120.3223
-95.25 -95.2297
STORY5 106.1364 106.1339
-88.519 -88.4936
STORY4 86.65718 86.6521
-77.7977 -77.7748
STORY3 63.0428 63.0428
-60.7619 -60.7441
STORY2 37.47008 37.4777
-38.1559 -38.1432
STORY1 13.02004 13.0175
-13.6246 -13.622
BASE 0 0
0 0
Latin American Journal of Solids and Structures 10(2013) 921 – 939 Table 3 Maximum Storey drift at different floor levels in transverse direction
Storey Drift
no pounding Pounding
ROOF 0.002938 0.002943
STORY6 0.004025 0.004031
STORY5 0.004942 0.004954
STORY4 0.005964 0.005965
STORY3 0.007018 0.007018
STORY2 0.007659 0.007659
STORY1 0.004533 0.004533
4.4 Pounding Effect on Displacement of Structures
4.4.1Taller Building
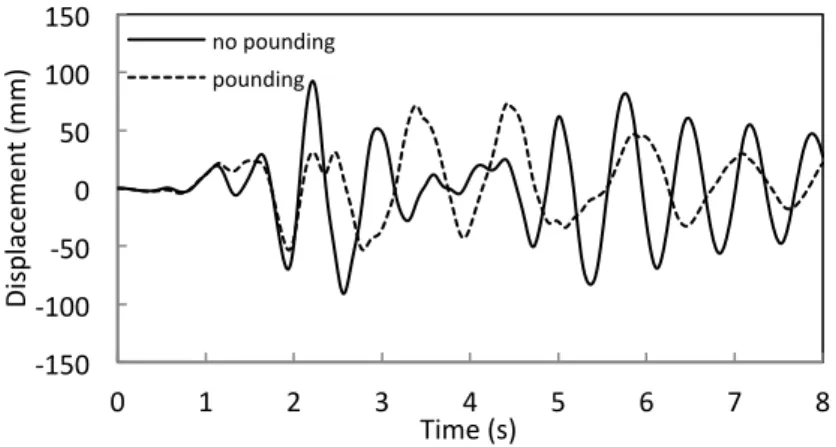
The displacement time history at pounding level of the taller building in longitudinal direction is shown in Figure 6a. Both pounding and no pounding cases show unstable sinusoidal displacement graph. From the graph, it can be seen that amplitude for the pounding case sinusoidal graph are lower compared to no pounding except in the time range of 4 to 5 seconds. The peak displac e-ment at fourth floor level for no pounding case is 91.69 mm while it is only 74.93 mm for poun
d-ing case. Overall displacement at level four decreases after poundd-ing because shorter buildd-ing prevents further movement of taller building.
(a) Pounding level
Figure 6 Displacement time history (longitudinal direction) at: (a) pounding level, (b) roof level of taller building ‐150
‐100 ‐50 0 50 100 150
0 1 2 3 4 5 6 7 8
D
is
p
lac
e
m
e
n
t
(m
m
)
Time (s) no pounding
Latin American Journal of Solids and Structures 10(2013) 921 – 939
(b) Roof level
Figure 6 (continued) Displacement time history (longitudinal direction) at: (a) pounding level, (b) roof level of taller building
On the other hand, Figure 6b shows the displacement time history at roof level of the taller building. Magnitude of displacement at roof level is generally higher than pounding level. It is because of taller object tends to be more flexible than shorter object. From the display, peak di s-placement at roof level without pounding effect is 137.67mm while subjected to pounding effect is 129.03 mm. This is due to the shorter building, which restricted the movement of building below pounding location. It causes high inertia force on level above pounding location. Therefore, di s-placement of building above pounding location is relatively higher than below pounding location.
4.4.2 Shorter Building
Pounding takes place at the roof level of shorter building. Figure 7 shows the longitudinal di s-placement time history at pounding level of shorter building. From the graph, diss-placement of no pounding case is not in phase with pounding case. It shows that pounding causes major changes in response of shorter building.
Figure 7 Displacement time history (longitudinal direction) at pounding level of shorter building ‐150
‐100 ‐50 0 50 100 150
0 1 2 3 4 5 6 7 8
D
is
p
lac
e
m
e
n
t
(
m
m
)
Time (s) no pounding
pounding
‐150 ‐100 ‐50 0 50 100 150
0 1 2 3 4 5 6 7 8
D
is
p
lac
e
m
e
n
t
(m
m
)
Time (s) no pounding
Latin American Journal of Solids and Structures 10(2013) 921 – 939 Peak displacement for no pounding state is 92.20 mm while for pounding state is 72.90 mm. It is equivalent to 20.9% of decrease in peak displacement. From both Figures 6 and 7, it can be noticed that pounding reduces displacement of building regardless of building height.
4.5Pounding Effect on Acceleration of Structure
4.5.1Taller Building
During earthquakes, large floor accelerations will be generated due to the vigorous ground m o-tion. These accelerations can increase by multiple times when pounding of structures occurs.
Figure 8a shows the longitudinal acceleration time history at pounding level of taller building. The most obvious change in the graph is that there are few sharp increases in negative acceler a-tions. The crowning negative acceleration is as high as -43.05 m/s2at 3.56 seconds. It is almost 6 times higher compared to no pounding state acceleration which is only -6.71 m/s2at 2.46 seconds.
(a) Pounding level
(b) Roof level
Figure 8: Acceleration time history (longitudinal direction) at: (a) pounding level, (b) roof level of taller building
However, accelerations at roof level of taller building do not undergo such abrupt changes as shown in Figure 8b. Uttermost acceleration at roof level in pounding state is -11.07m/s2while for
‐50 ‐40 ‐30 ‐20 ‐10 0 10 20 30 40 50
0 1 2 3 4 5 6 7 8
A cc e le ra1 o n ( m /s 2) Time (s) no pounding pounding ‐15 ‐10 ‐5 0 5 10 15
0 1 2 3 4 5 6 7 8
Latin American Journal of Solids and Structures 10(2013) 921 – 939
no pounding state it is 7.52m/s2. The amplification in acceleration during pounding is only 1.5 times. It indicates that acceleration increases at roof level but not as abrupt as at pounding level.
4.5.2Shorter Building
Figure 9 shows the longitudinal acceleration time history at pounding level of shorter building. Both pounding state diagram in Figures 8a and 9 shows great similarities in peak accelerations but only in opposite direction. Peak acceleration generated in shorter building during collision is as much as 105.69m/s2. It exists 9.7 times more value than the peak acceleration for no pounding case which is only -10.86m/s2. Comparison between the peak acceleration of both building clearly indicates that heavier building will induce high acceleration on lighter building.
Figure 9 Acceleration time history (longitudinal direction) at pounding level of shorter building
4.6Effect of Separation Distance between Structures
As previous results have shown, the major pounding effect takes place in longitudinal direction of pounding level. Thus, this study observes the changes of pounding force for such condition. Table 4 shows the pounding force generated in link element at pounding level for different separation distances.
Table 4 Pounding force at fourth storey of buildings for different separation distances
Gap distance
(mm) Floor level
Time
(s) Pounding force (kN)
25 4th 3.56 1374.14
125 4th 3.62 1374.63
250 4th 4.62 878.30
By increasing gap distance from 25 mm to 125 mm, pounding force does not decrease but slightly increases, as this distance is not enough to reduce the most severe contact between the two structures. For 250 mm gap, the pounding force has decreased to 878.30 kN, i. e.36.8% r e-duction, if compared to 25 mm gap response. This result shows that adequate gap distance b
e-‐40 ‐20 0 20 40 60 80 100 120
0 2 4 6 8
A
cc
e
le
ra1
o
n
(
m
/s
2)
Latin American Journal of Solids and Structures 10(2013) 921 – 939 tween the structures will significantly reduce pounding damage. Smaller pounding force is much desirable because it reduces the chances of structures collapse.
Storey shear amplification of each floor level for different gap distance is shown in Figure 10. It shows that taller structures are more likely to suffer greater damage when pounding occurs. The effect of pounding can be clearly seen from the sharp increase of storey shear at level five of
building. Another important trend can be seen is that increasing gap distance tends to reduce
story shear in consistent manner. For instance, at floor level five, the storey shear amplification
for 25 mm gap is 1.69, 125 mm gap is 1.68 and 250 mm gap is 1.67. Though the reduction of st
o-rey shear is not large, it implies that providing adequate gap distance is a viable option to reduce
pounding damage.
Figure 10 Storey shear amplification at different floor level versus separation distance
4.7Evaluation of “Frame + Slab” Model with “frame” model
Conventionally framed structure modelling had been often used as a basis for comparative r e-search purpose. It is the simplest form of modelling which is computationally efficient. Theoret i-cally, “frame + slab” model will be displaced less as compared to the “frame” model because slab has positive effect on increasing the lateral stiffness of the structure under lateral loads.
Firstly, the display of floor level versus displacement is shown in Figure 11a. The maximum displacement at roof level for “frame + slab” model is 136.78 mm, which is 6% higher if compared to “frame” model. It can also be seen that both positive and negative displacement of “frame and slab” model is relatively higher. This shows that the theory of reduction in lateral displacement by “frame and slab” modelling is not applicable in case of pounding of structures. This is because slab increases the mass of building generating larger momentum upon pounding. It is known that momentum is directly proportional to object’s mass. This large momentum generated during pounding are more significant than the increase of lateral stiffness by slabs. Thus, the building is displaced more in “frame + slab” model.
Figure 11b compares the storey drift for each floor level of building for both the types of mo d-elling concept. For both model, the peak storey drift occurs at level above pounding location. “Frame and slab” model has higher peak storey drift of 0.00714 while frame model is only 0.006012. It is due to higher pounding force generated during collisions. The time history of pounding force at level four can be seen in Figure 11c. The peak pounding force of “frame and slab” model is 3201.38 kN. It is 2.3 times higher than frame model which is only 1374.14kN. Such high pounding force causes big difference in displacement between the levels of building.
0 1 2 3 4 5 6 7 8
1 1.1 1.2 1.3 1.4 1.5 1.6 1.7 1.8
Floor
le
v
e
l
Storey shear
25 mm gap
125 mm gap
Latin American Journal of Solids and Structures 10(2013) 921 – 939
(a) Displacement
(b) Storey Drift
(c) Pounding force
(d) Pounding force
Figure 11 Comparison of building responses (longitudinal direction) for “frame + slab” with “frame” model 0
2 4 6 8
‐150 ‐100 ‐50 0 50 100 150
Floor le v e l Displacement (mm) Frame Frame + slab 0 2 4 6 8
0 0.002 0.004 0.006 0.008
Floor le v e l Story driF Frame Frame + slab 0 500 1000 1500 2000 2500 3000 3500
0 2 4 6 8
Po u n d in g fo rce ( kN) Time (s) Frame Frame + Slab 0 2 4 6 8
0 0.5 1 1.5 2
Latin American Journal of Solids and Structures 10(2013) 921 – 939 Lastly, illustration of floor level versus shear amplification is shown in Figure 11d. It can be seen that “frame and slab” model does not response similar to frame model. Storey shear of frame model is increasing with the height of building while trend of graph of “frame and slab” model is inconsistent. Generally, shear amplification for “frame and slab” model is lower and only has peak shear amplification of 1.5.It shows that dynamic properties of structures are very important in non-linear dynamic analysis. In this case, it had affected the storey shear of building significantly.
5 CONCLUSIONS
The results of present study show that pounding effect may be hazardous for structures. Major findings of thisstudy are as follows:
1. Response of building is greatly affected in the direction of pounding (longitudinal) while response in transverse direction is almost negligible. It is because the direction of poun d-ing (longitudinal) is influenced by impact force but there is only friction force acting on transverse direction.
2. Pounding reduces lateral displacement of structures because movement of structures are
blocked by each other. The stiffness of whole system is increased.
3. Acceleration at pounding level of structures greatly increases during collisions. Pounding force is directly proportional to acceleration. This extra pounding force may severely damage the structural members of structures.
4. During pounding lighter building experiences more acceleration and displacement. It is more venerable to damage than building with higher mass.
5. Separation distance between neighbouring structures reduces pounding damage as poun d-ing force is widely decreased for greater separation distance compared to low dimensional gap element.
6. “Frame + slab” model shows higher displacement that only “Frame” model. This is due to
inclusion of slab in the model of building, which also increases the mass causing larger
momentum during pounding.
7. The conventional modelling of building considering only beams and columns underest i-mates pounding effects. More realistic modelling such as beams, columns and slabs shall
be adopted to accurately understand the pounding phenomenon.
AcknowledgementsThe authors gratefully acknowledge University of Malaya, Malaysia for suppor t-ing this work through research grant RG140-12AET.
References
[1] E. Rosenblueth, R. Meli, The 1985 earthquake: Causes and effects in Mexico City. Concrete International. 8(1986). 23-24.
[2] You-Wei Zhang, Yan Zhao, Jia-Hao Lin, W.P. Howson and F.W.Williams, “ A General Symplectic Method for the Response Analysis of Infinitely Periodic Structures Subjected to Random Excitations”, Latin Amer i-can Journal of Solids and Structures, Vol. 9 (2012) pp. 569 –579.
Latin American Journal of Solids and Structures 10(2013) 921 – 939
[4] M. Jameel, Islam, A. B. M. S., R.R. Hussain, M. Khaleel (2012). Optimum Structural Modelling for Tall Buildings. The Structural Design of Tall and Special Building, [10.1002/tal.1004].
[5] A. B. M. S. Islam, M. Jameel, M.Z. Jumaat, M.M. Rahman (2013). Optimization in Structural Altitude for Seismic Base Isolation at Medium Risk Earthquake Disaster Region. Disaster Advances, 6(1), 23-34.
[6] J. Penzien, Evaluation of building separation distance required to prevent pounding during strong eart h-quakes. Journal of Earthquake Engineering and Structure Dynamics. 26 (1997) 849 –858.
[7] M. Dogan, A. Gunaydin, Pounding of adjacent RC buildings during seismic loads. Journal of Engineering and Architecture Faculty of Eskisehir Osmangazi University. 22(2009) 129-145.
[8] K. Kasai, V. Jeng, P.C. Patel, J.A. Munshi, B.F. Maison, Seismic pounding effects – Survey and analysis. Earthquake Engineering, 1992, Tenth World Conference.
[9] A.B.M. S. Islam, S.I. Ahmad, M. Jameel, M.Z. Jumaat, Seismic Base Isolation for Buildings in Regions of Low to Moderate Seismicity: A Practical Alternative Design. Practice Periodical on Structural Design and Construction, ASCE, 17(2012):13-20.
[10] A. B. M. S. Islam, M. Jameel, M.Z. Jumaat (2012). Review of offshore energy in Malaysia and floating Spar
platform for sustainable exploration. 16(8), 6268 -6284. Renewable & Sustainable Energy Reviews.
[11] A.B.M. Islam, M. Jameel, M.Z. Jumaat, Study on optimal isolation system and dynamic structural respon s-es in multi-story buildings. International Journal of Physical Science 6(2011): 2219 –2228.
[12] K. Kasai, B.F. Maison, Building pounding damage during the 1989 Loma Prieta earthquake. Engineering
Structures. 19(1997) 957-977.
[13] R. Jankowski, Non-linear viscoelastic modelling of earthquake-induced structural pounding. Earthquake Engineering and StructuralDynamics. 34(2005) 595-611
[14] R. Jankowski, Pounding force response spectrum under earthquake excitation, Engineering Structures. 28(2006). 1149-1161.
[15] V. Jeng, V, W.L. Tzeng, (2000). Assessment of seismic pounding hazard for Taipei City. Engineering Stru
c-tures. 22(2000) 459-471.
[16] R. Jankowski, Earthquake-induced pounding between equal height buildings with substantially different dynamic properties. Engineering Structures. 30 (2008). 2818-2829.
[17] A.B.M. Islam, M. Jameel , M.Z. Jumaat, Seismic isolation in buildings to be a practical reality: behavior of structure and installation technique. Journal of Engineering and Technology Research 3(2011): 97-117. [18] E.L. Harkness, M.A. Hassanain, Seismic damage in NSW, Australia: construction insurance, social, and
economic consequences. Journal of Performance of Constructed Facilities. 16(2002). 75-84.
[19] A. B. M. S. Islam, M. Jameel, M.Z. Jumaat (2012). Review of offshore energy in Malaysia and floating Spar
platform for sustainable exploration. 16(8), 6268 -6284. Renewable &Sustainable Energy Reviews.
[20] A.B.M. Islam, M. Jameel, S.I. Ahmad, M.Z. Jumaat, Study on corollary of seismic base isolation system on buildings with soft story. International Journal of Physical Science 6(2011): 2654-2661.
[21] R.R. Hussain, T. Ishida. Computer-aided oxygen transport model of mass and energy simulation for corr o-sion of reinforced steel, Automation in Construction, Volume 20, Issue 5, August 2011, Pages 559-570.
[22] A. B. M. S. Islam, M. Jameel, M.Z. Jumaat (2012). Oil and gas energy potential at Malaysian sea beds and Spar platform for deep water installation. International Journal of Green Energy, 9(2),111-120.
[23] M. Jameel, A. B. M. S. Islam, M. Khaleel, L.T. How (2013). Nonlinear analysis of marine riser for energy
exploration in shallow and deep water regions. Energy Education Science and Technology Part A-Energy Science and Research, 31(1), 187-206.
[24] M. Jameel, S. Ahmad, A. B. M. S. Islam, M.Z. Jumaat (2013). Nonlinear dynamic analysis of coupled spar platform. Journal of Civil Engineering and Management. DOI:10.3846/13923730.2013.768546.
[25] A.B.M. Islam, R.R. Hussain, M. Jameel, M.Z. Jumaat. Automated Non-linear Time Domain Analysis of Base Isolated Multi-storey Building under Site Specific Bi-directional Seismic Loading, Automation in Co n-struction. 22(2012): 554 –566.
[26] Z. Ren, C.J. Anumba, G. Augenbroe, T.M. Hassan, A functional architecture for an e-Engineering hub, Automation in Construction 17(2008) 930-939.
Latin American Journal of Solids and Structures 10(2013) 921 – 939
[28] A. Habibullah, 2007. ETABS Three DimensionalAnalysis of Building Systems. Computers and Structures, Inc., Berkeley, California.
[29] E. Wilson, 2002, Three-dimensional static and dynamic analysis of structures, 3rd ed. Berkeley: Computers & Structures Inc.
[30] B.F. Maison, K. Kasai, (1990). Analysis for Type of Structural Pounding, Journal of Structural Engineering. 116(1990). 957-977.