ISSN 1941-7020
© 2008 Science Publications
Corresponding Author: Alireza M. Goltabar, Department of Civil Engineering, Babol Noshirvani University of Technology, Iran Tel: +981113234501 Fax: +981113234201
Study of Impact between Adjacent Structures during of
Earthquake and their Effective Parameters
Alireza M.Goltabar, R. Shamstabar Kami and A. Ebadi
Department of Civil Engineering, Babol Noshirvani University of Technology, Iran
Abstract: In this research, buildings with 2-15 stories and different heights were put together using GAP joint element and nonlinear time-history analyses were done for Tabas, Elcentro and Sakaria accelerographs. The responses of both impact and non-impact cases were compared. With results analyzing, we found out that the impact increased the responses in taller buildings but decreased them in shorter ones. The largest increase was occurred when the height difference was 3 stories. Then the effective parameters in impact phenomenon, hardness and the distance between the structures were studied. The results shown that existence of the distance and hardening the structures (esp. in taller ones) may result to decrease the effect of impact in the structure responses.
Key words: Impact, adjacent structure, earthquake, appropriate distance between structures
INTRODUCTION
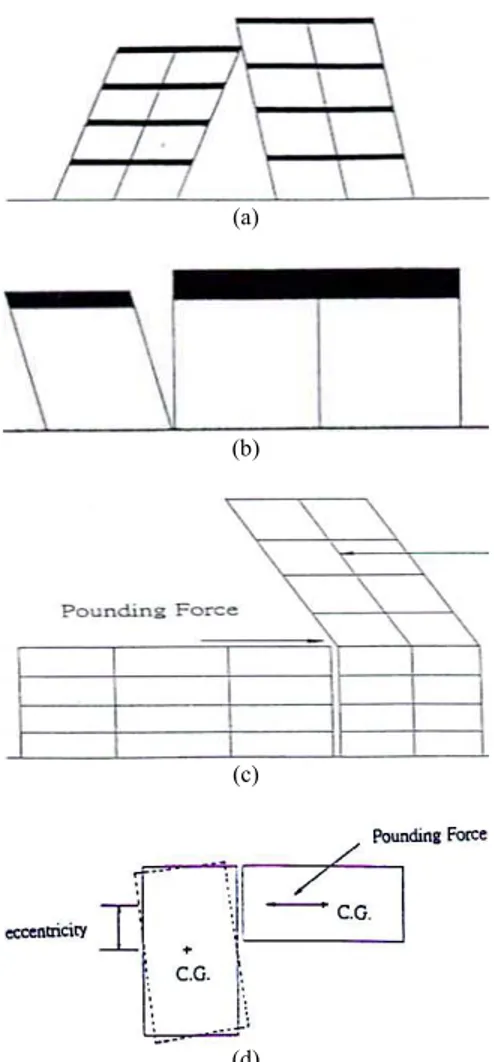
During strong earthquakes, adjacent structures that do not have appropriate distance and hit each other, that is called impact. The difference between dynamic properties (mass, hardness and height) of adjacent structures results different-phase oscillations which is the main cause to impact and the more different in shape of vibration causes stronger impact and vice versa, if the dynamic properties are the same, even if the distance is zero, there is no impact. Impact phenomenon has been reported in the strong earthquakes, for example Alaska (1964), San Fernando (1971), Romania (1977), Greece (1981), Northridge (1994) and Kobe (1995). In Lumaprita earthquake (1989), most damages were caused by the impact of structure[1]. In Mexico City earthquake (1985), more than 15% of the 330 structure that damaged or totally destroyed were result of impact phenomenon[2]. Because of the important of this object, many researchers have reconsidered on it[3-9].
Various types of impacts: Various types of impact
seen in the recent earthquakes can be categorized into 5 main groups[10].
Impact of the structure on the column of an adjacent building: This type of impact occurs in some adjacent buildings in which the floors levels are not in the same heights. Therefore, when shaking with different phases occurs, the floor of one building hits
the column of another and causes serious damages which can lead to the fracture of the columns of the story. This type is the most dangerous impact that can result in sudden destruction of the structure (Fig. 1a).
Impact of a heavier building on a lighter one: Since adjacent buildings may differ in the structural system of floors and/or in their applications, they have different masses, this can cause different phase oscillations, since the lighter building tolerates more intensive response (Fig. 1b).
Impact of a shorter building on a taller one: When
two structures with different heights are adjacent, because of different dynamic properties, the shorter structure hits the adjacent one, which results in floor shearing in higher levels of impact part. It is important to know that the higher in the impact part level, the greater impact is tolerated more intensive response (Fig. 1c).
Impact of two adjacent buildings with non-coaxial
mass centers: In building with non-coaxial mass
centers, the structure may pound on the edge of the adjacent structure and cause strong tensional torques, which can lead to seriously damage to the column on the edges and corners of the pounded building (Fig. 1d).
Pendulum-like impact of buildings: This type of
(a)
(b)
(c)
(d)
Fig. 1: Different types of impact in buildings. (a): Pounding of building on the adjacent building column, (b): Pounding of heavier building on a lighter building, (c): Pounding of shorter building on a taller building, (d): Pounding of two building with non-coaxial mass center
impact, some similar buildings that oscillate similarly, in strong earthquakes, hit the last building in the series and cause serious displacement in the pounded building. Existence of the same shape of the vibration in some building and the high momentum lead to last building has intensive responses. Numerous cases of this type of impact occurred in Mexico City earthquake in 1985.
MATERIALS AND METHODS
During intensive earthquakes, when two adjacent structures with inappropriate distance begin to vibrate, they vibrate separately, then together and then again
A 0.35 -
Soil type II -
Fig. 2: GAP element and its function
separately. Therefore, impact seems to behave nonlinearly. Since, solving of the nonlinear problems is very complicated, costly and time-consuming, the problem is simplified to two ideal linear cases. The first type is when the buildings vibrate separately and the sec. one is when the buildings are in touch[2]. The method that is more applicable is the developed form of quick Wilson method. This method is quite efficient and is designed for systems of linear basis with finite nonlinear elements. In this method, the forces caused by the nonlinear degrees of freedom are put in the right hand side of the dynamic balance equation and the equation is solved by iteration method. This method is used in this study. For avoiding of special conditions, we considered the regular structure, only. For this purpose, 3span concrete frames were considered that the distances of axes were 4 m and the heights were 3.2 m. These frames were designed with ACI-318 and 2800 (Iran) codes. P-∆ effects weren't considered and the story floors were assumed to be rigid and the dead load and effective live load were 800 and 200 (Kg m−2), respectively. Other characteristics of structure are shown in Table 1.
Connection modeling was done using a GAP joint element, which has only got pressing behavior (Fig. 2). The behavior of the element is such that it behaved nonlinearly with bilinear hardness, i. e. in cases that two adjacent buildings are in touch to each other, the hardness of this element is active and in case the two structures are separate, the hardness is considered to be zero.
One example of adjacent modeling is shown in Fig. 3.
Fig. 3: One example of adjacent modeling
the adjacent structure response (lateral displacement and stories shearing), modeling was done for some 2-15 story buildings (18 specimen), using the SAP2000 software. The analysis was done in the form of nonlinear time-history for Tabas, Elcentro and Sakaria accelerographs. Moreover one of the most critical cases which were the impact of a 13 story building on an adjacent 10 story building was selected for description.
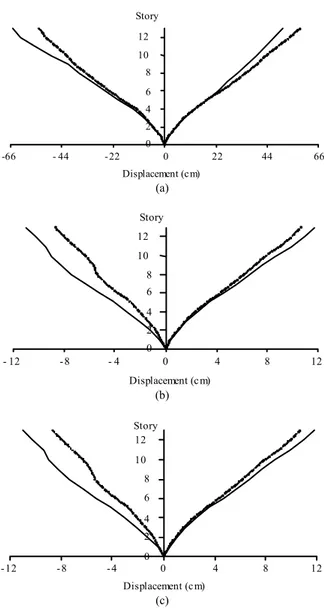
Impact effect on the responses of 13 story building:
Due to impact, the lateral displacement and the shear force of story in the 13 story building was increased under the three accelerographs that maximum values of it was 47.53 and 45.46% , respectively, that occurs under the Elcentro accelerograph. In addition, the lateral displacement and shear force of story under the Tabas and Sakaria accelerographs were slightly increased in positive direction (Fig. 4 and 6).
Impact effect on the responses of 10 story building:
The lateral displacement of the stories in the 10 story building recorded under the Tabas and Elcentro accelerographs were decreased throughout the height, that it's maximum value was 51.45% under the Elcentro accelerograph. Also shear force of stories in the 10 story building recorded under the Tabas and Elcentro accelerographs were decreased throughout the height, except for the impact point, that maximum value of it was 44.41% under the Elcentro accelerograph. Recorded the lateral displacement and the shear force of
0 2 4 6 8 10 12
-66 - 44 - 22 0 22 44 66
Story
Displacement (c m)
(a)
0 2 4 6 8 10 12
- 12 - 8 - 4 0 4 8 12
Displacement (c m) Story
(b)
0 2 4 6 8 10 12
- 12 - 8 - 4 0 4 8 12
Displacement (c m) Story
(c)
Fig. 4: The lateral displacement of the 13 story building. (a): Tabas earthquake, (b): Elcentro earthquake, (c): Sakaria earthquake
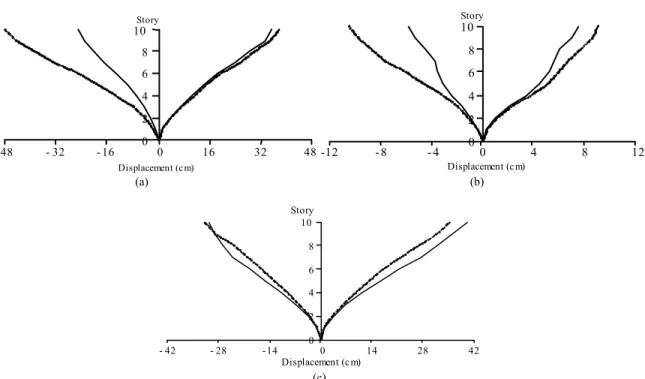
stories under the Sakaria accelerograph generally increased, that maximum value of it was 28.92 and 45.4% that occurred at the impact point in positive direction (Fig. 5 and 7).
0 2 4
-48 - 32 - 16 0 16 32 48
Displacement (c m)
0 2 4
-12 - 8 - 4 0 4 8 12
Displacement (c m)
(a) (b)
0 2 4 6 8 10
-42 -28 - 14 0 14 28 42
Story
Displacement (c m)
(c)
Fig. 5: The lateral displacement of the 10 story building. (a): Tabas earthquake, (b): Elcentro earthquake, (c): Sakaria earthquake
0 2 4 6 8 10 12
-3210 -2140 -1070 0 1070 2140 3210 Shear (KN)
Story
0 2 4 6 8 10 12
- 780 - 520 - 260 0 260 520 780
Shear (KN) Story
(a) (b)
0 2 4 6 8 10 12
-3420 -2280 - 1140 0 1140 2280 3420 Shear (KN)
Story
(c)
Fig. 6: Story shearing of the 13 story building. (a): Tabas earthquake, (b): Elcentro earthquake, (c): Sakaria earthquake
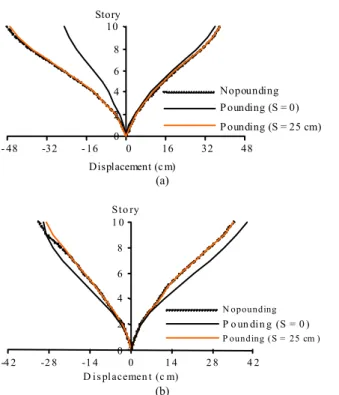
The effect of the distance between two adjacent buildings: To study the influence of this factor, the
(a)
0 2 4 6 8 10
-720 -480 -240 0 240 480 720
Shear (KN) Story
(b)
0 2 4 6 8 10
-2220 -1480 -740 0 740 1480 2220 Shear (KN)
Story
(c)
Fig. 7: Story shearing of the 10 story building. (a): Tabas earthquake, (b): Elcentro earthquake, (c): Sakaria earthquake
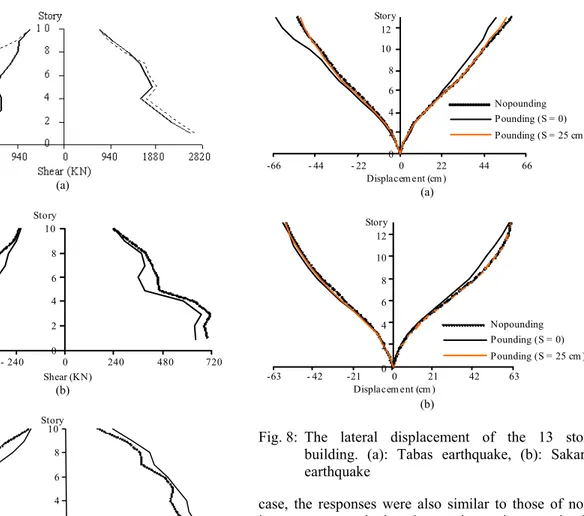
many times under the Tabas and Sakaria accelerographs, (while nothing was recorded under the Elcentro accelerograph) the lateral displacement of the stories in the 13-strory building, increased under the Tabas and Sakaria accelerograph, that maximum value of it was 5.57 and 10%, respectively. In this case, the responses are close to the non-impact state, such that the maximum changes in the first case (21.57%) decreased by 110.8% in the sec. case (-2.33%), as shown in Fig. 8.
The shear force of the stories in the 13 story building under the Tabas and Sakaria accelerographs has increased by the effect of impacts, that maximum value of it was 3.84 and 14.62%, respectively. In this
0 2 4 6 8 10 12
-66 - 44 - 22 0 22 44 66
Displacem ent (cm ) Story
Nopounding Pounding (S = 0) Pounding (S = 25 cm )
(a)
0 2 4 6 8 10 12
-63 - 42 -21 0 21 42 63
Displacem ent (cm ) Story
Nopounding Pounding (S = 0) Pounding (S = 25 cm )
(b)
Fig. 8: The lateral displacement of the 13 story building. (a): Tabas earthquake, (b): Sakaria earthquake
case, the responses were also similar to those of non-impact state, such that the maximum increase in the responses in the first case (35.45%) decreased by 73.15% in the sec. case (9.51%), as shown in Fig. 10. The lateral displacement of the 10 story building under the Tabas and Sakaria accelerographs has decreased, that maximum value of it was 6.45 and 9.21%, respectively. In this case, the responses were also similar to those of non-impact state, such that the maximum decrease in the first case (49.09%) lowered by 73.15% in the sec. case (0.86%). The important point is that the increasing pace of response in the first case changed to a decreasing pace in Sakaria accelerograph (Fig. 9).
0 2 4
- 48 - 32 - 16 0 16 32 48
Displacement (c m)
Nopounding
P ounding (S = 0)
P ounding (S = 25 cm)
(a)
0 2 4 6 8 1 0
-4 2 -2 8 -1 4 0 1 4 2 8 4 2 D i s pl acemen t (c m)
S t o ry
N opounding P o un di n g (S = 0 ) P ounding ( S = 25 cm )
(b)
Fig. 9: The lateral displacement of the 10 story building. (a): Tabas earthquake, (b): Sakaria earthquake
the buildings with distance in between, have decreased with respect to when there were no distance, lower floors has shown larger decrease in the impact, such that in below of the sixth story level under the Tabas accelerograph and in below of the fifth story level under the Sakaria accelerograph, no impact was reported (Fig. 12).
The hardness effect in two adjacent buildings: To
study the effect of hardness, the same 10 and 13 story models were utilized. By hardening the taller building (13 story one) the main period decreases from T = 1.79 sec to T = 1.45 sec and The responses of the two buildings are studied under the impact.
Study of the hardness when taller building has hardened: Under impact, the lateral displacement of the 13 story building increased under the Sakaria and Elcentro accelerographs, that maximum value of it was 20.13% under the Elcentro accelerograph. In this case, the lateral displacement of the stories is very similar to that of the non-impact case, such that the maximum increase of the displacement in the first case (47.53%) decreased by 76.77% in the sec. case (11.04%), as shown in Fig. 13. The shear force of the stories in the
0 2 4 6
-3210 -2140 - 1070 0 1070 2140 3210 Shear (KN)
(a)
0 2 4 6 8 10 12
-3420 -2280 -1140 0 1140 2280 3420 Shear (KN)
Story Nopounding P ounding (S = 0) P ounding (S = 25 cm)
(b)
Fig. 10: Story shearing of the 13 story building. (a): Tabas earthquake, (b): Sakaria earthquake
(a)
0 2 4 6 8 1 0
-2 2 2 0 -1 4 8 0 -7 4 0 0 7 4 0 1 4 8 0 2 2 2 0 Sh ear (K N )
Sto ry N opounding P o un din g (S = 0 ) P ounding (S = 25 cm )
(b)
Fig. 11: Story shearing of the 10 story building. (a): Tabas earthquake, (b): Sakaria earthquake
1 3 5 7 9
0 90 180 270
Pounding force (KN)
St
o
ry
(s = 0) Sakaria (s = 25 cm ) Tabas (s = 25 cm ) Sakaria
(s = 0) Tabas
Fig. 12: The impact force in 10 and 13- story models
0 2 4 6 8 10 12
-66 -44 -22 0 22 44 66
DISPLACEMENT (CM) ST ORY NOPOUNDING(1) POUNDING(1) NOPOUNDING(2) POUNDING(2) (a) 0 2 4 6 8 10 12
-15 -10 -5 0 5 10 15
DISP LACEMENT (CM) ST ORY NOP OUNDING(1) P OUNDING(1) NOP OUNDING(2) P OUNDING(2) (b) 0 2 4 6 8 10 12
-66 -44 -22 0 22 44 66
DISPLACEMENT (CM) ST ORY NOPOUNDING(1) P OUNDING(1) NOPOUNDING(2) P OUNDING(2) (c)
Fig. 13: The lateral displacement of the 13 story building. (a): Tabas earthquake, (b): Elcentro earthquake, (c): Sakaria earthquake
the Elcentro accelerograph. The responses in this case were similar to those of the non-impact state, such that the maximum shear force increase in the first case (45.46%) decreased by 89.13% in the sec. Case(4.94%), as shown in Fig. 15. The lateral displacement
0 2 4 6 8 1 0
-4 8 -3 2 - 1 6 0 16 3 2 4 8 D isplacemen t (c m)
Sto ry
N opounding P ounding (1) P ounding (2)
(a) 0 2 4 6 8 10
-12 - 8 -4 0 4 8 12 Displacem ent (cm )
Story
N op ou ndin g P ounding (1) Po unding (2)
(b) 0 2 4 6 8 1 0
-4 8 -3 2 -1 6 0 1 6 3 2 4 8 D is placemen t (c m)
Sto ry
N opounding P ounding (1) P o u n di n g (2 )
(c)
Fig. 14: The lateral displacement of the 10 story building. (a): Tabas earthquake, (b): Elcentro earthquake, (c): Sakaria earthquake
(a)
(b)
(c)
Fig. 15: Story shearing of the 13 story building. (a): Tabas earthquake, (b): Elcentro earthquake, (c): Sakaria earthquake
of the first case has considerably decreased, such that the maximum increase in the first case (28.92%) decreased by 41.53% in the sec. case (16.91%), as shown in Fig. 14.
The shear force of the floors in the shorter building under the Tabas and Elcentro accelerographs has decreased (except for the impact point), with a maximum of 18.69% under the Tabas accelerograph. The responses were similar to those of the non-impact state, such that increasing of the shear force in the first case (4.13%) was decreased by 58.6% to the sec. case (1.71%) and the maximum decrease in the shear force in the first case (44.41%) was lowered by 84.24% in the sec. case (7%). under the Sakaria accelerograph, the shear force of the stories has decreased throughout the whole building except for the impact point and has
0 2 4
- 3 0 0 0 - 2 0 0 0 - 1 0 0 0 0 1 0 0 0 2 0 0 0 3 0 0 0 S h ea r ( K N )
(a)
0 2 4 6 8 10
- 750 - 500 - 250 0 250 500 750
Shear (KN)
Story Nopounding
Pounding (1) Pounding (2)
(b)
0 2 4 6 8 10
- 30 00 - 2000 - 10 00 0 10 00 2000 30 00
She ar (K N )
Sto ry N op ou n ding
Poun ding (1) Poun ding (2)
(c)
Fig. 16: Story shearing of the 10 story building. (a): Tabas earthquake, (b) Elcentro earthquake, (c): Sakaria earthquake
1 2 3 4 5 6 7 8 9 10
0 100 200 300
P ounding force (KN)
S
tor
y
State 2 of tabas
State 2 of elcentro
State 2 of sakaria State 1 of tabas
State 1 of elcentro
State 1 of sakaria
increased in the lower floors in positive direction, that maximum value of it was 11.18%. In this case, the responses were similar to those of the non-impact case, such that in the impact point, increase of the shear force decreased in the first case (45.4%) was lowered by 89.73% in the sec. case (4.66%), as shown in Fig. 16.
In the sec. case, the impact force has decreased throughout the whole building, such that the maximum impact force in the first case (263.3) has decreased by 67.89% in the sec. case (84.66), as shown in Fig. 17.
CONCLUSION
• Based on the studied of the present study, the maximum responses (lateral displacement and story shearing) caused by the impact of two adjacent buildings, decreases in the shorter building, whereas it increases in the taller one, which may lead to critical conditions
• Maximum responses (lateral displacement and story shearing) in the shorter building decreased throughout the whole height of building except for the impact point
• Maximum responses (lateral displacement and floor shearing) in the taller building increased throughout the building
• Depending on the accelerograph, there are different dynamic responses and consequently different responses caused by impact. Earthquakes with acceleration history of repeatedly changes in direction, which have higher acceleration maximums, lead to more effect that is intensive
• One of the ways to decrease impact effects is considering a proper distance between the two adjacent structures. This distance decreases the impact effects, as a result, the responses will be similar to those of non-impact case
• One of the ways to decrease impact effects is to harden the building. This change decreases the impact effects, as a result, the responses will be similar to those of non-impact case
REFERENCES
1. Pantelids, C.P. and X. Ma, 1997. Linear and nonlinear pounding of structural systems. Comput. Struct., 66: 79-92, Doi: 10.1016/S0045-7949(97)00045-X.
2. Masion, B.F. and K. Kasai, 1990. Analysis for type of structural pounding. ASCE J. Struct. Eng., 116: 957-977, http://scitation.aip.org/getabs/ servlet./GetabsServlet?prog=normal&id=JSENDH 000116000004000957000001&idtype=cvips&gifs =yes.
3. Anagnostopoulos, S.A. and K.V. Spiliopouslos, 1992. An investigation of earthquake Induced pounding between adjacent buildings. Earthquake Eng. Struct. Dyn., 21: 289-302, http://dx.doi.org/ 10.1061/(ASCE)0733-9445(1990)116:4(957). 4. Lin, J.H. and C.C. Weng, 2001. Spectral analysis
on pounding of adjacent buildings. Eng. Struct., 23: 768-778, Doi: 10.1016/S0141-0296(00)00098-5.
5. Leibovich, E., A. Rutenberg and D.Z. Yankelevsky, 1996. On eccentric seismic pounding of symmetric buildings. Earthquake Eng. Struct. Dyn., 25: 219-233, DOI: 10.1002/(SICI) 1096-9845(199603).
6. Lin, J.H., 1997. Separation distance to avoid seismic pounding of adjacent buildings. Earthquake Eng. Struct. Dyn., 26: 395-403, DOI: 10.1002/(SICI)1096-9845(199703).
7. Hong, H.P., S.S. Wang and P. Hong, 2003. Critical building separation distance in reducing pounding risk under earthquake excitation. Struct. Saf., 25: 287-303, DOI: 10.1016/S0167-4730 (02)00080-2.
8. Lin, J.H. and C.C. Weng, 2001. Probability analysis of seismic pounding of adjacent buildings. Earthquake Eng. Struct. Dyn., 30: 1539-1557. DOI: 10.1002/eqe.78.
9. Penzien, J., 1997. Evaluation of building separation distance required to prevent pounding during strong earthquake. Earthquake Eng. Struct. Dyn., 26: 849-858, DOI: 10.1002/(SICI)1096-9845(199708).