MHC Class II Molecules
Hao Zhang1., Peng Wang2., Nikitas Papangelopoulos3., Ying Xu4, Alessandro Sette2, Philip E. Bourne3, Ole Lund1, Julia Ponomarenko3, Morten Nielsen1, Bjoern Peters2*
1Center for Biological Sequence Analysis, Department for Systems Biology, Technical University of Denmark, Lyngby, Denmark,2La Jolla Institute for Allergy and Immunology, La Jolla, California, United States of America,3San Diego Supercomputer Center and Skaggs School of Pharmacy & Pharmaceutical Sciences, University of California San Diego, San Diego, California, United States of America,4Department of Biochemistry and Molecular Biology, Institute of Bioinformatics, University of Georgia, Athens, Georgia, United States of America
Abstract
Successful predictions of peptide MHC binding typically require a large set of binding data for the specific MHC molecule that is examined. Structure based prediction methods promise to circumvent this requirement by evaluating the physical contacts a peptide can make with an MHC molecule based on the highly conserved 3D structure of peptide:MHC complexes. While several such methods have been described before, most are not publicly available and have not been independently tested for their performance. We here implemented and evaluated three prediction methods for MHC class II molecules: statistical potentials derived from the analysis of known protein structures; energetic evaluation of different peptide snapshots in a molecular dynamics simulation; and direct analysis of contacts made in known 3D structures of peptide:MHC complexes. These methods areab initioin that they require structural data of the MHC molecule examined, but no specific peptide:MHC binding data. Moreover, these methods retain the ability to make predictions in a sufficiently short time scale to be useful in a real world application, such as screening a whole proteome for candidate binding peptides. A rigorous evaluation of each methods prediction performance showed that these are significantly better than random, but still substantially lower than the best performing sequence based class II prediction methods available. While the approaches presented here were developed independently, we have chosen to present our results together in order to support the notion that generating structure based predictions of peptide:MHC binding without using binding data is unlikely to give satisfactory results.
Citation:Zhang H, Wang P, Papangelopoulos N, Xu Y, Sette A, et al. (2010) Limitations ofAb InitioPredictions of Peptide Binding to MHC Class II Molecules. PLoS ONE 5(2): e9272. doi:10.1371/journal.pone.0009272
Editor:Narcis Fernandez-Fuentes, Leeds Institute of Molecular Medicine, United Kingdom
ReceivedOctober 2, 2009;AcceptedJanuary 21, 2010;PublishedFebruary 17, 2010
Copyright:ß2010 Zhang et al. This is an open-access article distributed under the terms of the Creative Commons Attribution License, which permits unrestricted use, distribution, and reproduction in any medium, provided the original author and source are credited.
Funding:This work was supported by National Institutes of Health contracts HHSN26620040006C, HHSN266200400083C and HHSN266200400025C. The funders had no role in study design, data collection and analysis, decision to publish, or preparation of the manuscript.
Competing Interests:The authors have declared that no competing interests exist.
* E-mail: [email protected]
.These authors contributed equally to this work.
Introduction
A common bioinformatics application in immunology is the prediction of peptide binding to MHC molecules [1]. Most such binding predictions are based on machine learning algorithms, which aim to generalize experimental binding data to define a binding sequence pattern for a given MHC molecule. The quality of such predictions is therefore highly dependent on the amount of experimental training data available [2]. Moreover, there are thousands of different MHC alleles in the human population and binding data is only available for a small subset of alleles. Therefore, it is desirable to develop binding prediction methods that do not rely on the availability of peptide:MHC binding data. A promising approach that does not require binding data is to use 3D structures of peptide:MHC complexes. Different MHC alleles have high sequence homology, and all solved MHC structures have a highly conserved fold, which opens the possibility to use homology modeling for those MHC alleles for which no 3D structure has been solved explicitly. Moreover, a structure-based predictive understanding of peptide:MHC binding provides a
physical explanation for the nature of the binding interactions, while purely peptide sequence based learning methods merely provide a description of the sequence characteristics of preferred MHC-binding ligands. Throughout this manuscript, we refer to prediction approaches that use structural information but not peptide:MHC binding data as ‘ab initio’ approaches.
Several approaches have been published that predict peptide binding to MHC molecules utilizing known 3D structures. Threading-based approaches have been used to align peptides to know peptide:MHC structures and binders are selected using statistical pairwise potentials [3,4]. Bordner and Abagyan utilized a Biased-Probability Monte Carlo docking protocol to predict peptide:MHC binding [5]. Bui et al [6] developed a de novo
for the prediction of MHC class II peptide binding. In a recent paper Singh et al. applied threading guided by a structure derived contact potential to predict binding of peptides to MHC class I molecules [10]. Structure information has also been coupled with experimental data to predict peptide:MHC binding via quantita-tive structure-affinity relationship methods [11]. Evaluation of those methods was typically done using existing structures or a small dataset of known binders and none of them currently provides a public web server. Finally, so-called pan-specific MHC binding predictors have been developed in recent years integrating structural information with experimental peptide binding data allowing for generalization of binding predictions to MHC molecules characterized with few or even no peptide binding data [12,13,14,15,16,17,18].
Here, we present threeab initio structure-based approaches for predicting peptide binding to MHC class II molecules. The approaches are based on 1) statistical potentials derived from the analysis of known protein structures, 2) energetic evaluation of different peptide snapshots in a molecular dynamics simulation, and 3) direct analysis of contacts made in known 3D structures of peptide:MHC complexes. Their prediction performance was evaluated rigorously on a large dataset of 3,882 peptide binding affinities to HLA-DRB1*0101. The implementation and evalua-tion of the three approaches were initially pursued independently by subgroups of the authors at different institutions, but led to overall comparable results: they make significantly better than random discriminations of binders from non-binders, but fail to reach the prediction quality necessary for practical applications.
Results
This section is separated into two parts: In the first part, results are reported that were generated during the derivation of each of the three structure-based prediction methods, starting with the statistical pair potential-based method, followed by the molecular dynamics simulation and the contact map-based method. In the second part, the derived predictions are applied to a common benchmark set, namely a large set of HLA-DRB1*0101 binding data.
Derivation of Statistical Pair Potential Predictions
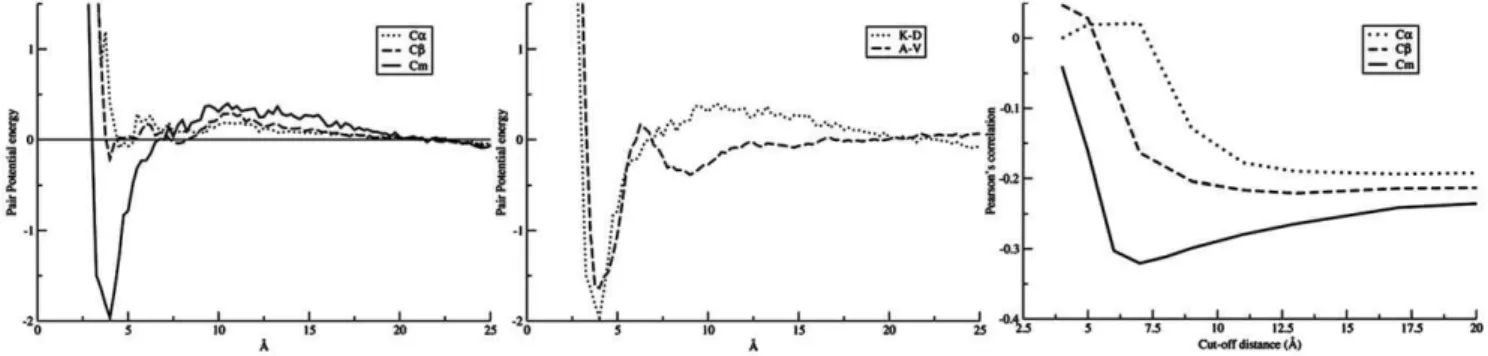
The effect of the center of interaction. Different schemes of representing the centre of interaction were used in this study: Ca, representing a residue by the alpha carbon; Cb, by the beta carbon; and Cm, a virtual atom denoting the centre of mass on the sidechain atoms (see material and method). The effect of different
implementations of centre of interaction on the pair potential for the K-D residue pair is illustrated in Figure 1. It was expected that the positively charged side-chain of lysine (K) attracts the negatively charged carboxylate group in the side-chain of aspartic acid (D) at a short favorable distance. For the statistical potentials, such a binding energy minimum can be seen clearly for Cm, whereas it was not pronounced for Ca and Cb. This suggested that the Cm representation was the most suitable for our study. Two additional potentials are shown in Figure 1 for the interaction between pairs of hydrophobic and negatively charged amino acids, respectively. These plots further demonstrate that the calculated potentials for Cm interactions agree with what is expected physico-chemically.
The optimal scoring function. The distance cutoff in the scoring function defining which pairwise interactions are taken into account when estimating the binding affinity was estimated based on a benchmark set of MHC class I binding data described in the methods section. For each of the three types of interactions centers, the predictive performance for the training set in terms of the Pearson Correlation Coefficient (PCC) was reported as a function of the cutoff distance used in the scoring function. The results of this calculation are shown in Figure 1. It clearly demonstrates that the predictive performance depends strongly on the type of interaction center, and that the optimal scoring function is found when using the Cm interaction centers with a distance cutoff for interactions at 7.5 A˚ .
To confirm the validity of the potential scoring function and the optimized potential parameters, we tested its performance on the separate benchmark set of 36,210 peptides that covers 41 MHC class I alleles. In this experiment the built-in Modeller energy was found to correlate poorly with the peptide:MHC binding affinity and had an average PCC of 0.04, whereas the statistical potential for Ca, Cband Cm reached an average PCC of 0.11, 0.13 and 0.21, respectively. The pair-potential binding prediction method shows large variations in predictive performance for different MHC molecules. The method performs best for alleles with hydrophobic amino acid preference at the primary anchor positions (A2, and A24 supertype alleles) and worse for alleles with charged amino acid preference at the primary anchor positions (A3, and B44 supertype alleles). For details on this experiment see Table S1. These results confirmed that the potential function based on Cm interaction centers performed better than both Ca and Cb, and we shall use this potential function with a distance cutoff of 7.5 A˚ in the subsequent evaluation on the MHC class II benchmark data set described below. Note, that the sequence-based method, NetMHCpan-1.0,
Figure 1. Pairwise potential function.(Left) Pair potential score as a function of interaction distance for K-D based on definition of Ca, Cb, and Cm,
respectively. (Middle) Interaction score as a function of Cmdistance between two hydrophobic amino acids, A-V, and two negatively charged amino acids, L-A, respectively. (Right) Predictive performance as a function of the interactions distance cutoff for three types of interaction centers. The predictive performance is estimated in terms of the Pearsons correlation for the 1173 peptide data in the training data set.
evaluated using a leave-one-allele-out approach on the same data set, achieved a performance of 0.674.
Derivation of Molecular Dynamics-Based Predictions
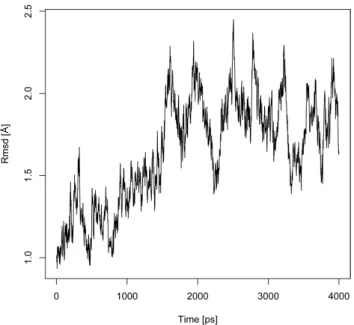
Structures from MD simulation. For the peptide:MHC class II complex, an MD simulation was carried out for 4 ns. The time-series of the root-mean-square-deviation (RMSD) of backbone atoms from the initial PDB structures is shown in Figure 2. For the 4 ns trajectory, the protein complex has an average RMSD of 1.62 A˚ with a standard deviation of 0.33 A˚. At around 1.6 ns into the simulation, the RMSD of the peptide:MHC complex stabilized around 1.83 A˚ with a peak value of 2.42 A˚ suggesting the system has reached equilibrium. In addition, the small RMSD value suggested that the peptide:MHC complex structure is very stable.
Binding free energy calculations and its application to binding prediction. From the trajectory of the MD simulation, it is possible to calculate the absolute binding free energy of individual amino acids. This can be done either by binding free energy decomposition [19,20] or via computational alanine scanning [21]. Previous studies have shown that binding free energy decomposition generally provided more accurate results than computational alanine scanning [22]. However, compu-tational alanine scanning is more suitable for our task as binding free energy decomposition requires MD simulation for large numbers of mutated structures which are prohibitively time consuming. To estimate the binding free energy contributions of all twenty amino acids at each of the nine peptide positions that interact with the MHC class II molecule, we conducted extensive in silico mutations (see Materials and Methods for details). This computational alanine scanning-like approach probed all one hundred eighty (2069) combinations of amino acids (20) and the peptide core positions (9). Those probing structures generated from the computational alanine scanning like approach were first
energy minimized then subjected to binding free energy calcu-lations using the MM-PBSA approach. This process was repeated for 100 snapshots taken from the MD simulation trajectory and the average results were reported as estimates for binding free energy of each amino acid at different core positions.
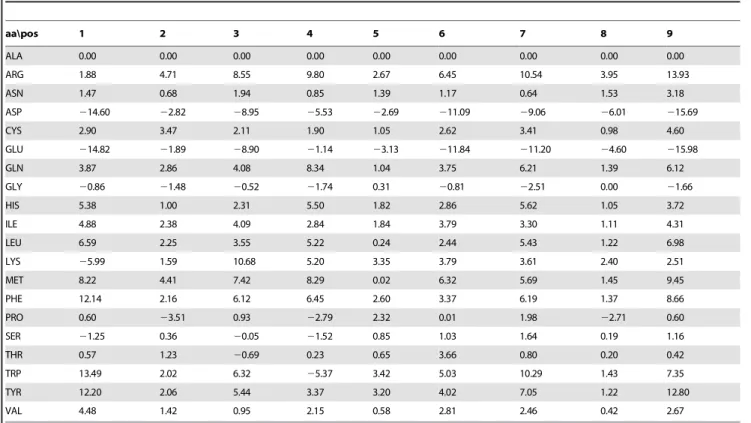
The calculated absolute binding free energies are displayed in Table 1 in a matrix format. Previous studies have suggest that for HLA-DRB1*0101, binding pocket number one has a strong preference for amino acids with a large neutrally charged side chain [23]. Our calculated binding free energies are consistent with this observation since residues like phenylalanine or tryptophan have the most favorable energies. The structure of the peptide:MHC complexes also suggest that epitope residues at pocket number five will not contribute much to the binding as the side chains protrude away from the MHC class II molecule [24]. Our calculated results are consistent with this finding, as the calculated values for pocket number five deviate less from zero than at other positions.
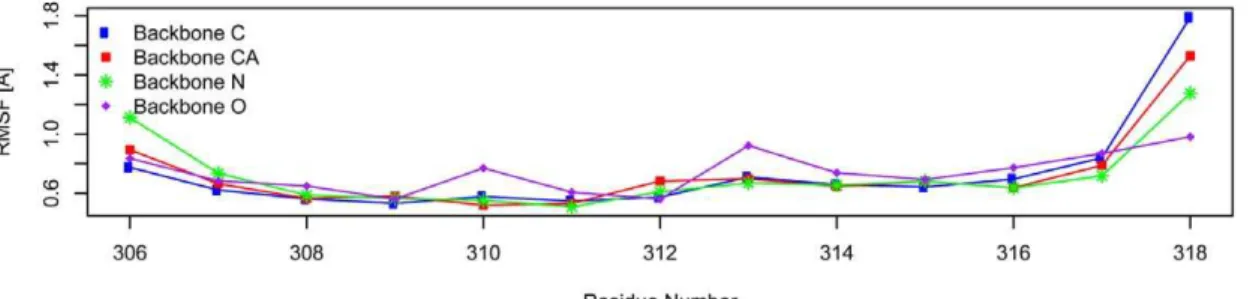
Flexibility of epitope and MHC residues during MD simulation. Dynamic changes of protein structures play im-portant roles in biological processes such as kinase activation and HIV entry into host cell [25,26]. Utilizing the MD simulation data, we examined the flexibility of the MHC molecule and the peptide epitope by calculating root mean square fluctuation (RMSF) of the peptide backbone atoms and the backbone atoms of MHC residues interacting with peptide (within 5 A˚ of the peptide). The resulting RMSFs are displayed in Figure 3. The 9mer core residues of epitope peptide (residue 308 to 316) are very stable as their backbone atoms showed very small RMSFs. While the +1 and 21 residues (residue 307 and residue 317) shared similar RMSFs with the core residues, the+2 and 22 residues (residue 306 and residue 318) showed significantly increased RMSFs. This suggested that residues beyond+1 and21 positions are unlikely to contribute much to peptide:MHC binding as their excessive motions will prevent stable interactions. While pep-tide interacting residues in chain B of the MHC molecule demonstrated remarkable stability, chain A residues located in the middle portion of the peptide interacting helix showed increased mobility. This suggested that the center region of the peptide binding groove has increased flexibility. This flexibility may help in the incorporation of peptides with diverse residues at the center and provide increased flexibility for T-cell receptor interaction.
Derivation of Contact-Map Based Predictions
Types of atom contacts considered. First, we determined which contacts should be considered in calculating the position specific scoring matrices (PSSM). Four schemas for counting atomic interactions were considered: (1) interactions at a distance of 4 A˚ ; (2) hydrogen bonds alone; (3) van der Waals interactions and hydrogen bonds; and (4) hydrogen bonds together with van der Waals and hydrophobic interactions. Each interacting atom pair was counted once, independent of how many different interactions it participated in. The number of contacts for each amino acid residue was defined as the number of atom-atom interactions in which its atoms were involved while interacting with MHC. To select the schema, we used a benchmark set of MHC class II alleles other than HLA-DRB1*0101 (Table S2). The PSSMs were generated for each MHC class II allele using 3D structures of the peptide:MHC complexes and Eqs. (3.1–3.3). The models based on hydrogen bonds, van der Waals, and hydrophobic interactions gave the best AUC values, while the schema taking into account only hydrogen bonds gave the worst prediction (Table S3).
Figure 2. Evolution of RMSD (A˚ ) of the 2G9H protein backbone over 4 ns of MD simulation. Structures of the MD simulation snapshots are aligned to the initial 2G9H structure and their backbone RMSDs (y-axis) are plotted against the time when the snapshots are taken (x-axis). The graph indicates that the structure reaches equilibrium around 1.6 ns into the MD simulation and remains stable through the end of the 4 ns simulation.
Derivation of contact map PSSM for HLA-DRB1*0101.
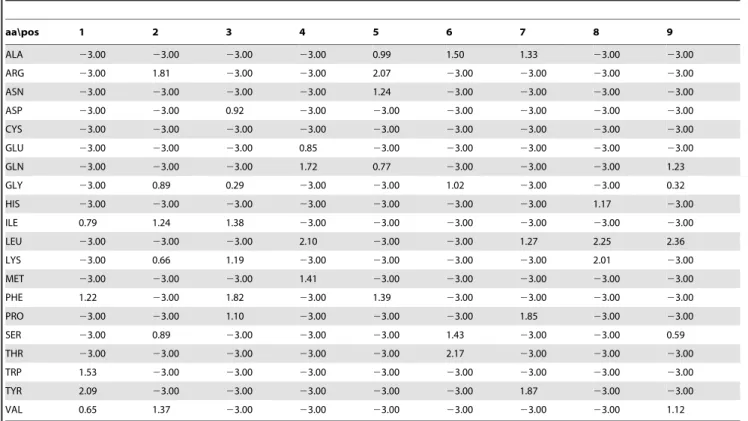
For each peptide core residue, we calculated the number of contacts in all six complexes with HLA-DR1*0101, taking into account hydrogen bonds, van der Waals, and hydrophobic interactions (Table S4). The values in the table correspond to Q(i,s) in Eq. (3.2), that is the number of times the amino acid of type s is found at position i of the peptide core. Using Eqs. (3.1–3.3), the PSSM for DRB1*0101 was calculated (Table 2). As for the absolute binding free energies calculated with the molecular dynamics method (Table 1), the contact-based PSSM values (Table 2) are consistent with the observation that the HLA-DRB1*0101 binding pocket number one has a preference for hydrophobic amino acids [24]. The contact-based PSSM values are also in agreement with the experimentally measured preferences for the HLA-DRB1*0101 binding pocket number four [23], which mostly favors leucine and methionine and disfavors aspartic acid, lysine, tryptophane, and arginine.
Evaluation of MHC Class II Binding Prediction Performance
All three prediction approaches were evaluated on a common benchmark of MHC class II binding peptides to HLA-DRB*0101. The pair-potential method was applied using Cminteraction centers, and a distance cutoff of 7.5 A˚ . The molecular-dynamics based method used the scoring matrix in Table 1, and the contact map method used the scoring matrix in Table 2. For each peptide in the evaluation set, most of which are 15-mers, all possible 9-mer cores were evaluated, and the core with the highest affinity was chosen. The overall performance of the prediction methods was evaluated by their ability to distinguish binding peptides in the set with an IC50,1,000 nM from those with a weaker affinity, as evaluated by a ROC curve.
Figure 4 shows the ROC curves for the three methods. For the statistical pair potential method, the AUC value was 0.68260.009, while it was 0.66760.009 for the molecular dynamics method and 0.62160.010 for the contact-map method. This is significantly better than a random value of AUC = 0.5 (p-value,0.00001 using standard error z-statistics). As a comparison, the ROC curve for the prediction method NetMHCIIpan was included in Figure 4 as well. As described previously [17] NetMHCIIpan utilizes measured peptide binding data from all MHC class II alleles, and can extrapolate predictions to new alleles for which no such data are available. The performance of this method (trained excluding all HLA-DRB1*0101 data) with an AUC value of 0.794 is substantially higher than all structure based predictions.
Discussion
Predicting peptide binding for MHC class II molecules remains a challenging problem [27]. While available prediction methods showed success in peptide binding prediction, their performance is much worse than the performance of the methods for MHC class I binding prediction [2]. In addition, existing methods typically depend on large sets of experimentally measured binding affinities and are not applicable to MHC alleles that lack such data. The three approaches described here were developed independently with the goal of deriving peptide:MHC binding predictions that do not require any binding data. The resulting prediction performances are significantly better than random. However, they are still substantially lower than the best performing sequence based class II prediction methods available (AUC,0.863) [27]. We have chosen to present
our results together in order to support the notion that generating structure-based predictions of peptide:MHC binding without using binding data is unlikely to give satisfactory results.
Table 1.Binding free energy contribution of each amino acid at different epitope core locations.
aa\pos 1 2 3 4 5 6 7 8 9
ALA 0.00 0.00 0.00 0.00 0.00 0.00 0.00 0.00 0.00
ARG 1.88 4.71 8.55 9.80 2.67 6.45 10.54 3.95 13.93
ASN 1.47 0.68 1.94 0.85 1.39 1.17 0.64 1.53 3.18
ASP 214.60 22.82 28.95 25.53 22.69 211.09 29.06 26.01 215.69
CYS 2.90 3.47 2.11 1.90 1.05 2.62 3.41 0.98 4.60
GLU 214.82 21.89 28.90 21.14 23.13 211.84 211.20 24.60 215.98
GLN 3.87 2.86 4.08 8.34 1.04 3.75 6.21 1.39 6.12
GLY 20.86 21.48 20.52 21.74 0.31 20.81 22.51 0.00 21.66
HIS 5.38 1.00 2.31 5.50 1.82 2.86 5.62 1.05 3.72
ILE 4.88 2.38 4.09 2.84 1.84 3.79 3.30 1.11 4.31
LEU 6.59 2.25 3.55 5.22 0.24 2.44 5.43 1.22 6.98
LYS 25.99 1.59 10.68 5.20 3.35 3.79 3.61 2.40 2.51
MET 8.22 4.41 7.42 8.29 0.02 6.32 5.69 1.45 9.45
PHE 12.14 2.16 6.12 6.45 2.60 3.37 6.19 1.37 8.66
PRO 0.60 23.51 0.93 22.79 2.32 0.01 1.98 22.71 0.60
SER 21.25 0.36 20.05 21.52 0.85 1.03 1.64 0.19 1.16
THR 0.57 1.23 20.69 0.23 0.65 3.66 0.80 0.20 0.42
TRP 13.49 2.02 6.32 25.37 3.42 5.03 10.29 1.43 7.35
TYR 12.20 2.06 5.44 3.37 3.20 4.02 7.05 1.22 12.80
VAL 4.48 1.42 0.95 2.15 0.58 2.81 2.46 0.42 2.67
Each row is an amino acid and the columns refer to pocket one to nine of the MHC class II epitope-binding groove. Each value is the difference of binding free energy in comparison with alanine in units of kcal/mol. Positive values indicate residues favorable for binding.
While it is surely possible to improve on the approaches presented here, a large gap to satisfactory prediction qualities remains. This is especially true as the evaluations conducted here for the DRB1*0101 MHC molecules constitute a best case scenario, as this is the molecule with the largest amount of 3D structures information available. One straightforward approach to improve upon the prediction quality would be to make a consensus of the three methods applied here. Minimally, this would achieve the prediction performance of the convex hull of the ROC curves shown in Figure 4. Still, such a consensus would have an AUC value of less than 0.70, which is conventionally accepted as a usable prediction performance of sequence based prediction methods.
It has to be stressed that we are not claiming that the use of structural data has no place in peptide:MHC binding predictions. We are explicitly referring here to limitations of ‘ab initio’ methods,
meaning those developed in the absence of any binding data. In fact, the use of structural methods in combination with binding data is promising, as shown by which peptide binding data is used to parameterize structure based scoring functions. Also, implicitly structural data are used in the ‘Pan’ approaches, which include representations of peptide contact residues in the MHC binding pocket molecule positions [12,13,15,16,17].
Another requirement we placed on the methods implemented here is that they needed to be capable of performing predictions on realistic sized datasets in a reasonable time frame. The standard application of these binding predictions is to scan sets of proteins or entire genomes for potential binding peptides. This easily leads to tens of thousands of predictions that have to be made, and rules out the use of very computationally expensive prediction approaches. For example, a prediction that would rely on generating molecular dynamics simulations for a peptide of interest is simply not practical. Figure 3. Backbone RMSF (A˚ ) of the epitope peptide and MHC residues contacting epitope over the last 2 ns of MD simulation. RMSFs of the backbone atoms (CA, C, N and O) are plotted against the residue numbers (x-axis). For the epitope peptide, residue 308 is located in pocket 1 of the MHC binding groove and residue 316 is located in binding pocket 9. The MHC residues contact epitope peptide in a linear fashion. For chain A of MHC molecule, the lower numbered MHC residues contact lower numbered peptide residues and higher numbered residues contact higher numbered peptide residues. For chain B of MHC molecule, the contacts are in reverse order in that the higher numbered MHC residues contact lower numbered peptide residues and lower numbered MHC residues contact higher numbered peptide residues.
The cost of performing a peptide:MHC binding experiment, which is routinely feasible for less than$50, places a boundary on the amount of computation time that is justifiable in a real-world
application. While generating the scoring matrix is a time consuming process for our MD based approach (performing a 4 ns MD simulation for a peptide:MHC complex takes about 2 weeks on a 64 nodes Linux cluster), our MD based prediction method could easily manage genome scale peptide binding prediction once the scoring matrices are generated. The predictive matrix of the contact map based approach only takes seconds to produce, and can easily handle genome scale predictions, similar to the MD based approach. In contrast, the pair potential method requires generating 3d models of peptide:MHC molecules for each possible register, which takes minutes per peptide, and makes genomic scale predictions more problematic.
The work presented here shows similar predictive performance as the early attempts to use protein structure and threading techniques to predict peptide binding to MHC molecules [3,28]. Most structure-based MHC prediction algorithms are not available online on the web, making large scale benchmarking of their predictive performance impossible. Exceptions to this are PREDEP [4], and MHCPred [29] where online prediction servers are available covering a limited set of MHC molecules. In recent large-scale benchmark calculations both of these methods have been shown to under-perform significantly when compared to state-of-the-art data-driven methods [2,30]. In particular, the MHCpred method was shown to achieve a predictive performance of 0.565 AUC when evaluated on a set of more than 1000 HLA-DRB1*0101 peptides [30], suggesting that this method does not outperform the methods considered in this work.
Experimental data had suggested that residues outside of the MHC class II binding groove contribute to binding [31,32] and prediction methods have been developed incorporating such residues with considerable success [30] Our analysis of residue flexibility with the MD simulation data supports this notion. While peptide residues more than one amino acids away from the 9mer Table 2.PSSM for the DRB1*0101 generated by the contact-based method.
aa\pos 1 2 3 4 5 6 7 8 9
ALA 23.00 23.00 23.00 23.00 0.99 1.50 1.33 23.00 23.00
ARG 23.00 1.81 23.00 23.00 2.07 23.00 23.00 23.00 23.00
ASN 23.00 23.00 23.00 23.00 1.24 23.00 23.00 23.00 23.00
ASP 23.00 23.00 0.92 23.00 23.00 23.00 23.00 23.00 23.00
CYS 23.00 23.00 23.00 23.00 23.00 23.00 23.00 23.00 23.00
GLU 23.00 23.00 23.00 0.85 23.00 23.00 23.00 23.00 23.00
GLN 23.00 23.00 23.00 1.72 0.77 23.00 23.00 23.00 1.23
GLY 23.00 0.89 0.29 23.00 23.00 1.02 23.00 23.00 0.32
HIS 23.00 23.00 23.00 23.00 23.00 23.00 23.00 1.17 23.00
ILE 0.79 1.24 1.38 23.00 23.00 23.00 23.00 23.00 23.00
LEU 23.00 23.00 23.00 2.10 23.00 23.00 1.27 2.25 2.36
LYS 23.00 0.66 1.19 23.00 23.00 23.00 23.00 2.01 23.00
MET 23.00 23.00 23.00 1.41 23.00 23.00 23.00 23.00 23.00
PHE 1.22 23.00 1.82 23.00 1.39 23.00 23.00 23.00 23.00
PRO 23.00 23.00 1.10 23.00 23.00 23.00 1.85 23.00 23.00
SER 23.00 0.89 23.00 23.00 23.00 1.43 23.00 23.00 0.59
THR 23.00 23.00 23.00 23.00 23.00 2.17 23.00 23.00 23.00
TRP 1.53 23.00 23.00 23.00 23.00 23.00 23.00 23.00 23.00
TYR 2.09 23.00 23.00 23.00 23.00 23.00 1.87 23.00 23.00
VAL 0.65 1.37 23.00 23.00 23.00 23.00 23.00 23.00 1.12
doi:10.1371/journal.pone.0009272.t002
Figure 4. Performance of three ab initio structure based prediction methods and NetMHCIIpan using HLA DRB1*0101 as an example.The prediction results of three methods applied to HLA DRB1*0101 binding data are shown in the ROC plot. The ROC curves were generated by plotting the true positive rate (y-axis) against the false positive rate (x-axis). The AUC values for the three methods were shown in parentheses.
binding core are unlikely to contribute to binding due to excessive flexibility, the+1 and21 residues could play detectable roles in binding as they share similar flexibility with other core residues. Our analysis of hydrogen bonds (data not shown) detected two stable hydrogen bonds formed between the+1 peptide residue and MHC residues and another two stable hydrogen bonds formed between the21 peptide residue and MHC residues. We further analyzed the roles of those resides in binding by carrying out free energy calculation similar to the core residues. The resulting energy (data not shown) suggested that the+1 and 21 positions have small standard deviations similar to the non-anchor core positions 2, 3, 5 and 8. This suggested that their contribution to binding is mostly due to backbone interactions. Those results provided dynamic evidence supporting the roles of residues immediately outside of the binding groove in peptide:MHC interaction and suggested that predictive methods should incor-porate residues outside of the binding core.
In summary, we have developed and tested three ‘ab initio’ structure based binding approaches that do not require pepti-de:MHC binding information, and found their prediction performance to be limited. We believe, it is nevertheless important to publicize this essentially negative finding as the approaches tested here have an obvious appeal and similar approaches are likely be pursued repeatedly. Also, we would like to be proven wrong, and will be convinced of the usefulness ofab initiostructure based predictions by a method that is publicly available, capable of performing predictions for 1,000 peptides in less than a day, and was developed without requiring peptide:MHC binding data for a complex parameterization.
Materials and Methods
The materials and methods section is separated into three parts corresponding to the three distinct approaches for MHC peptide binding.
The Statistical Pair-Potential-Based Method
This method is based on deriving heuristic potentials between amino acids based on the frequency with which pairs of amino acids occur at a given distance in a large set of protein structures. These potentials are used to assign a heuristic binding affinity to homology modeled peptide:MHC binding complexes.
Statistical Pair-Potential. The statistical potential is defined as a logarithm of the ratio of the probability of observation against the probability of expectation. Here, we take the form adopted by Samudrala et al. [33] to calculate a potential from the count of observations:
E~{logpobs
pexp:
ð1:1Þ
To estimate the probabilityPobs, we counted the number of obser vations of amino acid pairs (a, b), within a distance r in a representative set of protein structures. To obtainPexp, we assume that for any given pair of amino acids (a, b), the distribution is homogenous for a given distance r, i.e., P(r|a,b) = P(r). The potential is hence calculated as:
E~{logp rð Da,bÞ
p rð Þ , ð1:2Þ
where log is the the natural logarithm.
To predict peptide:MHC binding interactions, we are only interested in the inter-chain interactions between the peptide and
the MHC molecule. To focus the potential on such non-local interactions, only amino acid pairs with a sequence separation greater than 9 amino acids were included when calculating the potential function.
The Culled PDB dataset from Wang and Dunbrack [34] was used to build the knowledge-based potential function. This collection of data is composed of 1202 high-resolution (resolution cutoff 2.0 A˚ ) crystal structures of globular proteins with sequence length between 300 and 460 residues (MHC protein sequence size 680 residues). The pair-potential was calculated using a distance bin of 0.25 A˚ . A penalty term was assigned to the potential function for distances closer than 1.0 A˚ to account for steric repulsion. The steric penalty was set to 2.0.
Finally, to limit the computational cost and to optimize the potential scoring function, only pairwise interactions up to a specific distance cutoff value were included [33,35].
Reduced Models for Proteins. The calculation of the potential functions was based on a reduced model for protein structures where the pair-wise interactions of residues are repre-sented by distance-dependent interactions between centroids. A number of schemes to represent the interaction centres of amino acid residues were tested: Ca, Cb, Cm. In the Cascheme, a residue is represented by its alpha carbon; in Cbby the beta carbon in the sidechain (a virtual betacarbon is calculated for glysine); in Cm by the centre of mass of the heavy sidechain atoms (non-hydrogen). Other types of centroid definitions could be considered including backbone atoms of the residue. However, backbone conformations are highly conserved for different residue types and inclusion of such atoms in the centroid description would predominantly lead to residue-type specific shifts in centroid location towards the Cb position. Furthermore, sidechain center of mass centroids have earlier been show to perform well for knowledge-based potential functions [36].
Homology Modelling. The models of peptide:MHC com-plexes were predicted using Modeller 8.v2 [37]. Modeller generates an ensemble of models using an initial random seed, and selects those with as little violation as possible to the spatial restrains derived from the alignment and expressed as probability density functions (PDFs). The PDFs restrain Ca-Caand backbone N-O distances, as well as backbone and side-chain dihedral angles for different residue types. A pool of 42 templates was used to build peptide:MHC binding models (Table S5). For each peptide, three MHC complex models were constructed from the template pool using different initial seeds for Modeller. To obtain a predicted affinity for a given peptide, the three peptide:MHC models were evaluated in the pair-potential, and the final binding score was obtained as the simple average of the three binding scores.
The Molecular Dynamics-Based Method
This method is based on sampling the configurations that a peptide adopts in a molecular dynamics simulation of a peptide:MHC binding complex. Using in silico mutations of the peptides in each configuration, an average contribution to binding free energy of each possible amino acid in each position of the peptide core is assigned.
Molecular dynamics simulation. The molecular dynamics (MD) simulation was performed with the software package NAMD [38] using the CHARMM22 force field [39] with an explicit water model. The structure of the MHC class II molecule in complex with peptide epitope (PDB ID 2G9H) was taken from the Protein Data Bank [40]. The simulation was performed with the following protocol. The peptide:MHC complex was solvated in a box of TIP3 water with at least 10 A˚ distance between protein and the boundary of the water box. The system was first minimized with 10,000 steps of steepest descent followed by 100,000 steps of conjugate gradient descent. The MD simulation time step was 2 fs, and trajectory was saved every 1 ps. The particle mesh Ewald method was used to treat long-range electrostatic interactions and bond lengths involving hydrogen atoms were constrained with the SHAKE algorithm [41]. Constant temperature was controlled by Langevin dynamics, and pressure was maintained by using Nose´-Hoover Langevin piston pressure control. For the purpose of free energy calculation, 100 snapshots were taken from the last 1 ns of the 4 ns MD simulation trajectory.
In silico mutation of the peptide:MHC complex. For each of the 100 snapshot structures of the MD simulation, the following in silico mutations were performed. For each position of the 9-mer binding core of the peptide, 19 mutated structures were generated where each structure contained a mutation of the core residue to one of the other 19 amino acids. Thus, for each snapshot 171 (1969) mutated structures were generated that covered all possible amino acids at each of the core position of the peptide. The mutations were generated with the ‘‘Mutate Residue’’ Plugin of the VMD software [42]. The mutated structures were minimized with 10,000 steps of conjugate gradient descent using NAMD before they were subjected to binding free energy calculation.
Calculating binding free energy contribution of core peptide residues. The contribution to binding free energy was calculated for all 20 amino acids at each position of the 9-mer binding core via a computational alanine scanning like approach:
DDGi,j~DGalanine,j{DGi,j, ð2:1Þ
whereDDGi,jis the contribution to binding free energy of residuei at peptide core positionj,DGi,jis the binding free energy between the MHC class II molecule and the peptide where the residue at positionjwas mutated to amino acidiandDGalanine,jis the binding free energy between MHC class II molecule and the peptide where residue at positionjis mutated to alanine.
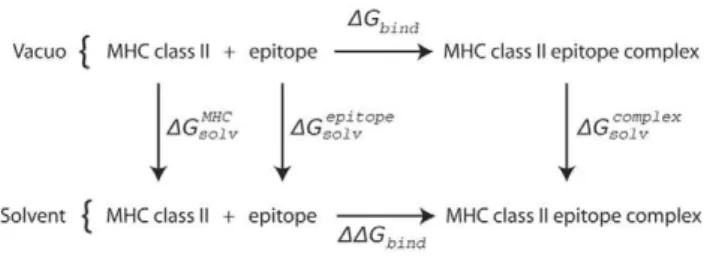
The absolute binding free energy between the MHC class II molecule and peptide was calculated with the molecular mechanics-Poisson-Boltzmann surface area (MM-PBSA) approach according to the thermodynamic cycle shown in Figure 5. In this formulation, the binding free energy was the sum of gas phase contribution, SDGbindT, the desolvation energy upon binding,
SDGdesolvT, and an entropic term, -STDST:
DG~SDGbindTzSDGdesolvT{STDST: ð2:2Þ The brackets,,., denote an average over snapshots taken from the MD simulation trajectories.
The entropy term was omitted from our calculation since previous studies have shown that this term is canceled out when comparing systems with a single point mutation [43].
The gas-phase contribution to the binding free energy,
SDGbindT, is the sum of the van der Waals and electrostatic interaction between MHC class II molecule and peptide and the difference in the internal energy between the peptide:MHC complex and the individual molecules of MHC class II and peptide. Those energies were calculated with the ‘‘NAMD Energy’’ plugin of VMD using the provided default parameters.
The solvation contribution for binding free energy,SDGdesolvT, is the difference between the solvation energy of the peptide:MHC complex and those of the isolated MHC class II molecule and peptide. The solvation energy is divided into the electrostatic contribution and the non-polar contribution. The non-polar contribution to the solvation energy was calculated with an empirical formula:DGnp,solv=s6SASAwhere SASA is the solvent-accessible surface area andsis a constant value of 0.0072 kcal/A˚ 2 [19]. The electrostatic contribution to solvation energy was calculated by solving the Poisson- Boltzmann equation with Delphi [44] at 0.10 M salt. The partial charges and atomic radii were taken from the CHARMM22 force field. The interior of the molecular surface of the solute molecule (calculated with a 1.4 A˚ probe sphere) was assigned a dielectric constant of epsilon = 2, whereas the exterior aqueous phase was assigned a value of epsilon = 80. Debye–Hu¨ckel boundary conditions and five focus-ing steps were used with a cubic grid size of 155.
The Contact Map-Based Method
The contact-based method implements a simple peptide:MHC contact model that assumes the following: (i) the peptide residues interact independently with the MHC molecule and (ii) the probability of an amino acid to be in a certain position of the peptide core is proportional to the average number of atomic contacts made by that amino acid in that position with the MHC molecule in 3D structures of peptides in complexes with MHC class II of a particular allele. The structures used for the method development are provided in Table 3.
Constructing the MHC allele-specific PSSMs. The elements of a position-specific scoring matrix (PSSM) were calculated as follows:
w ið Þ,s ~log2
p ið Þ,s p sð Þzr
, ð3:1Þ
where p(i,s) is the probability of the amino acid s at position i, and r = 0.05 is a small value added to avoid underflow when p(i,s) = 0. Figure 5. Thermodynamic cycle used to calculate the binding free energies between MHC class II molecule and the epitope peptide. The diagram shows the thermodynamic cycle for the binding of a MHC class II molecule and a epitope peptide, in both the solvated phase and in vacuo. The free energy of binding in solvent can be calculated by the following equation:DDGbind~DGbindzDGcomplexsolv {DGMHCsolv {DG
When more than one structure for an allele was considered, the probabilities p(i,s) in the equation above were calculated as follows:
p ið Þ,s~
Q(i,s)|w(i,s) P
S
Q(i,s)|w(i,s)
½ ,
P
S
Q(i,s)|w(i,s)
½ =0
0:05, otherwise
8 > <
> :
ð3:2Þ
whereQ(i,s)is the number of times residuesis found at positioni
in all peptide core sequences in the analyzed structures.
w ið Þ,s~Navð Þs,i,if s[E ið Þ,w ið Þ,s~Nav,if s6[E ið Þ,
where E(i) is a set of amino acids at the position i in all core sequences from the analyzed structures; Nav(s,i) is an average number of contacts that amino acidsat the positionimakes with MHC; andNavis the average of contacts over all residues in all analyzed structures of peptide:MHC complexes for a particular allele.
If only one structure was considered for the allele, the probabilitiesp(i,s)were calculated using the following equation:
p ið Þ,s~
1 20| 1{
N ið Þ,s w
if N ið Þ,s ƒw, 0if N ið Þ,sww sð6[E ið ÞÞ;
1 20| 1z
19N ið Þ,s w
if N ið Þ,s ƒw, 1if N ið Þ,sww sð [E ið ÞÞ
8 > > > <
> > > :
:ð3:3Þ
where N(s,i) is a number of contacts that amino acid s at the positioniof the core makes with the MHC molecule andw is a free parameter that was taken as equal to the average number of contacts per residue over all core residues.
Benchmark Data Sets+ Performance Evaluation Metrics The evaluation of methods was performed using HLA DRB1*0101 binding data described in detail elsewhere [27]. Briefly, the dataset contains 3,882 experimentally measured peptide:MHC binding affinities. The binding affinities were expressed in terms of IC50 values and the experiments were all carried out as described before [45]. For evaluation purpose, the peptides were classified into 2939 binders (experimental IC50,1000 nM) and 943 non-binders (experimental IC50.= 1000 nM). The receiver operating charac-teristic (ROC) curves [46] were used to measure the performance of prediction algorithms. The ROC curve is generated by plotting the true positive rate against the false positive rate while changing the cutoff from the highest to lowest prediction score. The area under the
ROC curve (AUC) can be used to measure prediction performance where 0.5 is random prediction and 1.0 is perfect prediction. The actual plotting of ROC curve and calculation of AUC were carried out with the ROCR [47] package of R [48]. Standard errors for AUC values were calculated according to [49] as:
SEAUC
~ AUC
|ð1{AUCÞznpos{1
|Q1{AUC2 znneg{1
|Q2{AUC2 npos|nneg
0:5 ð4
:1Þ
Where AUC is the area under the curve, npos and nneg are the number of positive and negative binding peptides in the test set respectively, and Q1and Q2are calculated as
Q1~
AUC
2{AUC
ð Þ andQ2~
2|AUC2 1zAUC
ð Þ:
Supporting Information
Table S1 Benchmark performance of methods. Columns are: name of allele, supertype, number of peptides, followed by the Pearsons correlation between the logarithm of the measured binding affinity and Modeller energy, pair potential energy based on Ca, Cband Cmcentre of interaction, respectively. NN refers to
the leave-one-out performance of NetMHCpan taken from Nielsen et al, 2007 [16]. The pair-potential cutoff values for Ca, Cband Cm were 20 A˚ , 20 A˚, and 7.5 A˚, respectively (see figure 1).
Found at: doi:10.1371/journal.pone.0009272.s001 (0.08 MB DOC)
Table S2 Structures of peptide:MHC class II complexes used in the benchmarking contact-based method.
Found at: doi:10.1371/journal.pone.0009272.s002 (0.04 MB DOC)
Table S3 The results of the peptide:MHC class II binding affinity prediction using the contact-based method.
Found at: doi:10.1371/journal.pone.0009272.s003 (0.06 MB DOC)
Table S4 Number of atomic contacts for peptide core residues in complexes with HLA-DRB1*0101, counting hydrogen bonds, van der Waals, and hydrophobic interactions.
Found at: doi:10.1371/journal.pone.0009272.s004 (0.04 MB DOC)
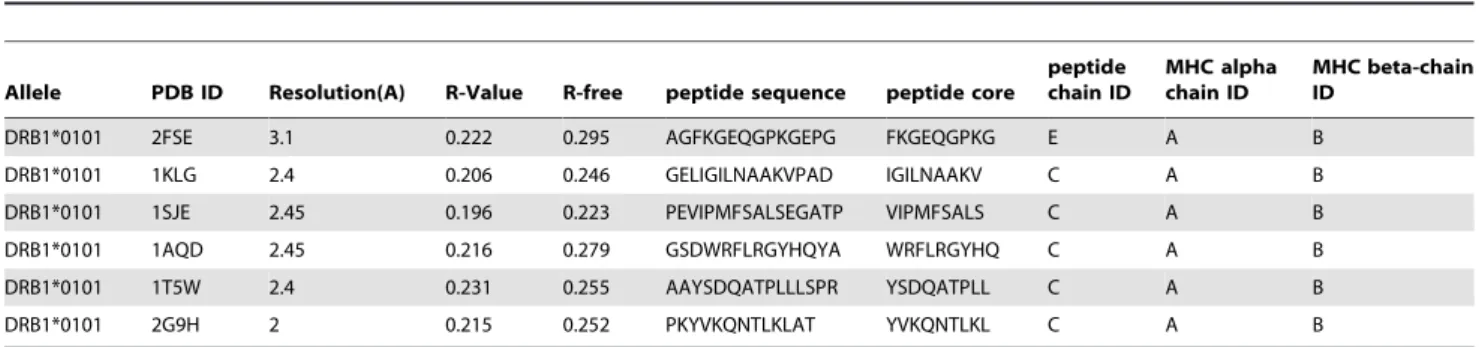
Table 3.Structural data used throughout this study to derive the MHC class II structure-based binding predictions.
Allele PDB ID Resolution(A) R-Value R-free peptide sequence peptide core
peptide chain ID
MHC alpha chain ID
MHC beta-chain ID
DRB1*0101 2FSE 3.1 0.222 0.295 AGFKGEQGPKGEPG FKGEQGPKG E A B
DRB1*0101 1KLG 2.4 0.206 0.246 GELIGILNAAKVPAD IGILNAAKV C A B
DRB1*0101 1SJE 2.45 0.196 0.223 PEVIPMFSALSEGATP VIPMFSALS C A B
DRB1*0101 1AQD 2.45 0.216 0.279 GSDWRFLRGYHQYA WRFLRGYHQ C A B
DRB1*0101 1T5W 2.4 0.231 0.255 AAYSDQATPLLLSPR YSDQATPLL C A B
DRB1*0101 2G9H 2 0.215 0.252 PKYVKQNTLKLAT YVKQNTLKL C A B
The different columns give the MHC allele name, PDB identifier, resolution of X-ray structure, the R-free structure quality value, the peptide sequence, the peptide binding core as defined from the crystal structure, followed by the PDB chain ID for the peptide, MHC alpha, and MHC beta chains, respectively.
doi:10.1371/journal.pone.0009272.t003
ð3.3Þ
Table S5 PDB templates used in homology modeling of the structures of peptide:MHC-I complexes for the pair potential method.
Found at: doi:10.1371/journal.pone.0009272.s005 (0.03 MB DOC)
Author Contributions
Conceived and designed the experiments: HZ PW NP OL JP MN BP. Performed the experiments: HZ PW NP. Analyzed the data: HZ PW NP YX AS PEB OL JP MN BP. Contributed reagents/materials/analysis tools: YX. Wrote the paper: HZ PW NP YX AS PEB OL JP MN BP.
References
1. Korber B, LaBute M, Yusim K (2006) Immunoinformatics comes of age. PLoS Comput Biol 2: e71.
2. Peters B, Bui HH, Frankild S, Nielson M, Lundegaard C, et al. (2006) A community resource benchmarking predictions of peptide binding to MHC-I molecules. PLoS Comput Biol 2: e65.
3. Altuvia Y, Sette A, Sidney J, Southwood S, Margalit H (1997) A structure-based algorithm to predict potential binding peptides to MHC molecules with hydrophobic binding pockets. Hum Immunol 58: 1–11.
4. Altuvia Y, Margalit H (2004) A structure-based approach for prediction of MHC-binding peptides. Methods 34: 454–459.
5. Bordner AJ, Abagyan R (2006) Ab initio prediction of peptide-MHC binding geometry for diverse class I MHC allotypes. Proteins 63: 512–526.
6. Bui HH, Schiewe AJ, von Grafenstein H, Haworth IS (2006) Structural prediction of peptides binding to MHC class I molecules. Proteins 63: 43–52. 7. Schafroth HD, Floudas CA (2004) Predicting peptide binding to MHC pockets
via molecular modeling, implicit solvation, and global optimization. Proteins 54: 534–556.
8. Fagerberg T, Cerottini JC, Michielin O (2006) Structural prediction of peptides bound to MHC class I. J Mol Biol 356: 521–546.
9. Davies MN, Sansom CE, Beazley C, Moss DS (2003) A novel predictive technique for the MHC class II peptide-binding interaction. Mol Med 9: 220–225.
10. Singh SP, Mishra BN (2008) Ranking of binding and nonbinding peptides to MHC class I molecules using inverse folding approach: Implications for vaccine design. Bioinformation 3: 72–82.
11. Doytchinova IA, Walshe VA, Jones NA, Gloster SE, Borrow P, et al. (2004) Coupling in silico and in vitro analysis of peptide-MHC binding: a bioinformatic approach enabling prediction of superbinding peptides and anchorless epitopes. J Immunol 172: 7495–7502.
12. Zaitlen N, Reyes-Gomez M, Heckerman D, Jojic N (2008) Shift-invariant adaptive double threading: learning MHC II-peptide binding. J Comput Biol 15: 927–942.
13. Jojic N, Reyes-Gomez M, Heckerman D, Kadie C, Schueler-Furman O (2006) Learning MHC I–peptide binding. Bioinformatics 22: e227–235.
14. Zhang H, Lund O, Nielsen M (2009) The PickPocket method for predicting binding specificities for receptors based on receptor pocket similarities: application to MHC-peptide binding. Bioinformatics 25: 1293–1299. 15. Hoof I, Peters B, Sidney J, Pedersen LE, Sette A, et al. (2009) NetMHCpan, a
method for MHC class I binding prediction beyond humans. Immunogenetics 61: 1–13.
16. Nielsen M, Lundegaard C, Blicher T, Lamberth K, Harndahl M, et al. (2007) NetMHCpan, a method for quantitative predictions of peptide binding to any HLA-A and -B locus protein of known sequence. PLoS One 2: e796. 17. Nielsen M, Lundegaard C, Blicher T, Peters B, Sette A, et al. (2008)
Quantitative predictions of peptide binding to any HLA-DR molecule of known sequence: NetMHCIIpan. PLoS Comput Biol 4: e1000107.
18. Brusic V, Petrovsky N, Zhang G, Bajic VB (2002) Prediction of promiscuous peptides that bind HLA class I molecules. Immunol Cell Biol 80: 280–285. 19. Gohlke H, Kiel C, Case DA (2003) Insights into protein-protein binding by
binding free energy calculation and free energy decomposition for the Ras-Raf and Ras-RalGDS complexes. J Mol Biol 330: 891–913.
20. Zoete V, Meuwly M, Karplus M (2005) Study of the insulin dimerization: binding free energy calculations and per-residue free energy decomposition. Proteins 61: 79–93.
21. Moreira IS, Fernandes PA, Ramos MJ (2007) Computational alanine scanning mutagenesis–an improved methodological approach. J Comput Chem 28: 644–654.
22. Zoete V, Michielin O (2007) Comparison between computational alanine scanning and per-residue binding free energy decomposition for protein-protein association using MM-GBSA: application to the TCR-p-MHC complex. Proteins 67: 1026–1047.
23. Sturniolo T, Bono E, Ding J, Raddrizzani L, Tuereci O, et al. (1999) Generation of tissue-specific and promiscuous HLA ligand databases using DNA micro-arrays and virtual HLA class II matrices. Nat Biotechnol 17: 555–561.
24. Jones EY, Fugger L, Strominger JL, Siebold C (2006) MHC class II proteins and disease: a structural perspective. Nat Rev Immunol 6: 271–282.
25. Kwong PD, Wyatt R, Robinson J, Sweet RW, Sodroski J, et al. (1998) Structure of an HIV gp120 envelope glycoprotein in complex with the CD4 receptor and a neutralizing human antibody. Nature 393: 648–659.
26. Richards MW, O’Regan L, Mas-Droux C, Blot JM, Cheung J, et al. (2009) An autoinhibitory tyrosine motif in the cell-cycle-regulated Nek7 kinase is released through binding of Nek9. Mol Cell 36: 560–570.
27. Wang P, Sidney J, Dow C, Mothe B, Sette A, et al. (2008) A systematic assessment of MHC class II peptide binding predictions and evaluation of a consensus approach. PLoS Comput Biol 4: e1000048.
28. Altuvia Y, Schueler O, Margalit H (1995) Ranking potential binding peptides to MHC molecules by a computational threading approach. J Mol Biol 249: 244–250.
29. Guan P, Doytchinova IA, Zygouri C, Flower DR (2003) MHCPred: A server for quantitative prediction of peptide-MHC binding. Nucleic Acids Res 31: 3621–3624.
30. Nielsen M, Lundegaard C, Lund O (2007) Prediction of MHC class II binding affinity using SMM-align, a novel stabilization matrix alignment method. BMC Bioinformatics 8: 238.
31. Lovitch SB, Pu Z, Unanue ER (2006) Amino-terminal flanking residues determine the conformation of a peptide-class II MHC complex. J Immunol 176: 2958–2968.
32. Godkin AJ, Smith KJ, Willis A, Tejada-Simon MV, Zhang J, et al. (2001) Naturally processed HLA class II peptides reveal highly conserved immunogenic flanking region sequence preferences that reflect antigen processing rather than peptide-MHC interactions. J Immunol 166: 6720–6727.
33. Samudrala R, Moult J (1998) An all-atom distance-dependent conditional probability discriminatory function for protein structure prediction. J Mol Biol 275: 895–916.
34. Wang G, Dunbrack RL, Jr. (2003) PISCES: a protein sequence culling server. Bioinformatics 19: 1589–1591.
35. Melo F, Sanchez R, Sali A (2002) Statistical potentials for fold assessment. Protein Sci 11: 430–448.
36. Zhang C, Liu S, Zhou H, Zhou Y (2004) An accurate, residue-level, pair potential of mean force for folding and binding based on the distance-scaled, ideal-gas reference state. Protein Sci 13: 400–411.
37. Sali A, Blundell TL (1993) Comparative protein modelling by satisfaction of spatial restraints. J Mol Biol 234: 779–815.
38. Phillips JC, Braun R, Wang W, Gumbart J, Tajkhorshid E, et al. (2005) Scalable molecular dynamics with NAMD. J Comput Chem 26: 1781–1802. 39. Brooks BR, Bruccoleri RE, Olafson DJ, States DJ, Swaminathan S, et al. (1983)
CHARMM: A Program for Macromolecular Energy, Minimization, and Dynamics Calculations. J Comput Chem 4: 187–217.
40. Berman HM, Westbrook J, Feng Z, Gilliland G, Bhat TN, et al. (2000) The Protein Data Bank. Nucleic Acids Res 28: 235–242.
41. Ryckaert J-P, Ciccotti G, Berendsen HJC (1977) Numerical integration of the cartesian equations of motion of a system with constraints: molecular dynamics of n-alkanes. Journal of Computational Physics 23: 327–341.
42. Humphrey W, Dalke A, Schulten K (1996) VMD: visual molecular dynamics. J Mol Graph 14: 33–38, 27–38.
43. Huo S, Massova I, Kollman PA (2002) Computational alanine scanning of the 1:1 human growth hormone-receptor complex. J Comput Chem 23: 15–27. 44. Honig B, Nicholls A (1995) Classical electrostatics in biology and chemistry.
Science 268: 1144–1149.
45. Sidney J, Southwood S, Oseroff C, Del Guercio M, Grey H, et al. (1998) Measurement of MHC/peptide interactions by gel filtration. Current protocals in immunology. new york: John Wiley & Sons, Inc. pp 18.13.11–18.13.19. 46. Swets JA (1988) Measuring the accuracy of diagnostic systems. Science 240:
1285–1293.
47. Sing T, Sander O, Beerenwinkel N, Lengauer T (2005) ROCR: visualizing classifier performance in R. Bioinformatics 21: 3940–3941.
48. RDC T (2006) R: A Language and Environment for Statistical Computing. 49. Hanley JA, McNeil BJ (1982) The meaning and use of the area under a receiver