ACPD
15, 8479–8523, 2015Roles of pressure perturbations in rainband convection
of Typhoon Morakot
C.-C. Wang et al.
Title Page
Abstract Introduction
Conclusions References
Tables Figures
◭ ◮
◭ ◮
Back Close
Full Screen / Esc
Printer-friendly Version
Interactive Discussion
Discussion
P
a
per
|
Discussion
P
a
per
|
Discussion
P
a
per
|
Discussion
P
a
per
|
Atmos. Chem. Phys. Discuss., 15, 8479–8523, 2015 www.atmos-chem-phys-discuss.net/15/8479/2015/ doi:10.5194/acpd-15-8479-2015
© Author(s) 2015. CC Attribution 3.0 License.
This discussion paper is/has been under review for the journal Atmospheric Chemistry and Physics (ACP). Please refer to the corresponding final paper in ACP if available.
A numerical study of convection in
rainbands of Typhoon Morakot (2009) with
extreme rainfall: roles of pressure
perturbations with low-level wind maxima
C.-C. Wang1, H.-C. Kuo2, R. H. Johnson3, C.-Y. Lee2, S.-Y. Huang1, and Y.-H. Chen2
1
Department of Earth Sciences, National Taiwan Normal University, Taipei, Taiwan
2
Department of Atmospheric Sciences, National Taiwan University, Taipei, Taiwan
3
Department of Atmospheric Sciences, Colorado State University, Fort Collins, CO, USA
Received: 19 December 2014 – Accepted: 23 February 2015 – Published: 20 March 2015
Correspondence to: H.-C. Kuo (kuo@as.ntu.edu.tw)
Published by Copernicus Publications on behalf of the European Geosciences Union.
ACPD
15, 8479–8523, 2015Roles of pressure perturbations in rainband convection
of Typhoon Morakot
C.-C. Wang et al.
Title Page
Abstract Introduction
Conclusions References
Tables Figures
◭ ◮
◭ ◮
Back Close
Full Screen / Esc
Printer-friendly Version
Interactive Discussion
Discussion
P
a
per
|
Discussion
P
a
per
|
Discussion
P
a
per
|
Discussion
P
a
per
|
Abstract
This paper investigates the formation and evolution of deep convection inside the east–west oriented rainbands associated with a low-level jet (LLJ) in Typhoon Morakot (2009). With typhoon center to the northwest of Taiwan, the westerly LLJ was resulted from the interaction of typhoon circulation with the southwest monsoon flow, which
sup-5
plied the water vapor for the extreme rainfall (of∼1000 mm) over southwestern Taiwan. The Cloud-Resolving Storm Simulator with 1 km grid spacing was used to simulate the event, and it successfully reproduced the slow-moving rainbands, the embedded cells, and the dynamics of merger and back-building (BB) on 8 August as observed. Our model results suggest that the intense convection interacted strongly with the westerly
10
LLJ that provided reversed vertical wind shear below and above the jet core. Inside ma-ture cells, significant dynamical pressure perturbations (p′d) are induced with positive (negative)p′d at the western (eastern) flank of the updraft near the surface and a re-versed pattern aloft (>2 km). This configuration produced an upward directed pressure gradient force (PGF) to the rear side and favors new development to the west, which
15
further leads to cell merger as the mature cells slowdown in eastward propagation. The strong updrafts also acted to elevate the jet and enhance the local vertical wind shear at the rear flank. Additional analysis reveals that the upward PGF there is re-sulted mainly by the shearing effect but also by the extension of upward acceleration at low levels. In the horizontal, the upstream-directed PGF induced by the rear-side
pos-20
ACPD
15, 8479–8523, 2015Roles of pressure perturbations in rainband convection
of Typhoon Morakot
C.-C. Wang et al.
Title Page
Abstract Introduction
Conclusions References
Tables Figures
◭ ◮
◭ ◮
Back Close
Full Screen / Esc
Printer-friendly Version
Interactive Discussion
Discussion
P
a
per
|
Discussion
P
a
per
|
Discussion
P
a
per
|
Discussion
P
a
per
|
1 Introduction
1.1 Literature review
Rainbands develop in response to linear forcing such as fronts, drylines, troughs, and convergence zone (e.g., Carbone, 1982; Browning, 1990; Doswell, 2001; Johnson and Mapes, 2001) or by self-organization in a sheared environment (e.g., Bluestein and
5
Jain, 1985; Rotunno et al., 1988; Houze et al., 1990), and are a common type of precip-itation systems around the world (e.g., Houze, 1977; Chen and Chou, 1993; Garstang et al., 1994; LeMone et al., 1998; Meng et al., 2013). These linear-shaped mesoscale convective systems (MCSs) are most well studied in mid-latitudes and classified by Parker and Johnson (2000, 2004) into three archetypes based on the location of
strati-10
form region relative to the main line: trailing stratiform (TS), leading stratiform (LS), and parallel stratiform (PS), in response primarily to the different structure of environmental vertical wind shear. Most of these quasi-linear MCSs, especially the TS archetype, are squall lines and propagate relatively fast in direction more-or-less normal to the line (Houze et al., 1990).
15
The above motion of squall-line type systems, however, is not particularly conducive to high rainfall accumulation and the occurrence of flash floods, as Schumacher and Johnson (2005, 2006) found that the three archetypes together constitute only about 30 % of extreme precipitation events caused by MCSs over the United State Great Plains. For the more hazardous linear systems that travel at small angles to their own
20
alignment (also Dowsell et al., 1996; Brooks and Stensrud, 2000), the above authors further identified two common types of MCSs: the training line-adjoining stratiform (TL/AS) and back-building/quasi-stationary (BB), accounting for about 34 and 20 % of the extreme rainfall events, respectively (Schumacher and Johnson, 2005, 2006). Inside the TL/AS type that often forms along or north of a pre-existing slow-moving
25
boundary with an east–west (E–W) orientation, a series of embedded “training” con-vective cells move eastward (also Stevenson and Schumacher, 2014; Peters and Roeb-ber, 2014). On the other hand, the BB systems are more dependent on mesoscale and
ACPD
15, 8479–8523, 2015Roles of pressure perturbations in rainband convection
of Typhoon Morakot
C.-C. Wang et al.
Title Page
Abstract Introduction
Conclusions References
Tables Figures
◭ ◮
◭ ◮
Back Close
Full Screen / Esc
Printer-friendly Version
Interactive Discussion
Discussion
P
a
per
|
Discussion
P
a
per
|
Discussion
P
a
per
|
Discussion
P
a
per
|
storm-scale processes than synoptic boundaries, and while the embedded cells move downwind after initiation, new cells are repeatedly generated at nearly the same lo-cation at the upwind side, making the line as a whole “quasi-stationary” (also e.g., Chappell, 1986; Corfidi et al., 1996). Both the above configurations allow for multiple cells to pass through the same area successively, thus rainfall at high intensity to
accu-5
mulate over a lengthy period (say, several hours) to cause extreme events and related hazards (Doswell et al., 1996). The common mechanism of repeated new cell genera-tion at the end of BB MCSs are through the lifting at the leading edge (i.e., gust front) of the outflow of storm-generated cold pool (see e.g., Fig. 7 of Doswell et al., 1996), which forms on the upwind side of the system (e.g., Parker and Johnson, 2000; Schumacher
10
and Johnson, 2005, 2009; Houston and Wilhelmson, 2007; Moore et al., 2012). Out-side the North America, linear MCSs with embedded cells moving along the line are also often responsible for floods, such as the events in France, Australia, Hawaii, and East China (Sénési et al., 1996; Tryhorn et al., 2008; Murphy and Businger, 2011; Luo et al., 2014).
15
Another well-known theory through which the movement of convective cells, and thus the evolution of quasi-linear MCSs, can be modified is the dynamical pressure change induced by the shearing effect in environments with strong vertical wind shear, first put forward by Rotunno and Klemp (1982) to explain the propagation of isolated supercell storms (also e.g.,Weisman and Klemp, 1986; Klemp, 1987). To be detailed in Sect. 3.3,
20
the convective-scale dynamical pressure perturbation (p′d) can be shown to be roughly proportional to the inner product of the vertical shear vector of horizontal wind (S) and
the horizontal gradient of vertical velocity (∇hw). Thus, in an environment with
west-erly vertical shear (S pointing eastward), positive (negative)p′
d is induced to the west
(east) of the updraft where∇hw points eastward (westward, see e.g., Fig. 7a of Klemp,
25
ACPD
15, 8479–8523, 2015Roles of pressure perturbations in rainband convection
of Typhoon Morakot
C.-C. Wang et al.
Title Page
Abstract Introduction
Conclusions References
Tables Figures
◭ ◮
◭ ◮
Back Close
Full Screen / Esc
Printer-friendly Version
Interactive Discussion
Discussion
P
a
per
|
Discussion
P
a
per
|
Discussion
P
a
per
|
Discussion
P
a
per
|
pressure (p′) couplets (rear-positive and front-negative with respect to S) across the
updraft are also reproduced. In the present study, the roles of pressure perturbations associated with convective cells inside the rainband of Typhoon (TY) Morakot in 2009 (e.g., Chien and Kuo, 2011; Wang et al., 2012) are investigated using the simulation results from a cloud-resolving model, and the background related to typhoon rainbands
5
and this particular typhoon is introduced below.
1.2 Typhoon Morakot and back-building rainbands
Located over the western North Pacific (WNP), on average about 3–5 typhoons hit Taiwan annually and pose serious threats to the island. Some of them develop strong interaction with the monsoon that often further enhance the rainfall and worsen the
10
damages. In the past 50 years, the most devastating case was TY Morakot in Au-gust 2009 (Lee et al., 2011; Chang et al., 2013), leading to 757 deaths and direct damages of roughly 3.8 billion US Dollars (Wang et al., 2012). Based on the Joint Ty-phoon Warning Center (JTWC) best track, after its formation on 3 August, TY Morakot (2009) approached from the east since 4 August then impacted Taiwan during 6–9
15
August (Fig. 1a). Embedded inside a 4000 km monsoon gyre that enclosed two other TCs (e.g., Hong et al., 2010; Nguyen and Chen, 2011), Morakot was large in size (Fig. 1a and b) and moved very slowly near Taiwan under the influence of its background environment (e.g., Chien and Kuo, 2011; Wu et al., 2011). During the departure period on 8 August, its mean translation speed further dropped to below 2 m s−1for about 24 h
20
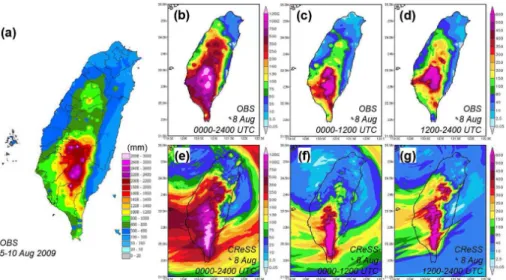
(cf. Fig. 1a), attributed to the effects of asymmetrical latent heating that concentrated at the rear side of the storm over the southern and eastern quadrants (Wang et al., 2012, 2013; Hsu et al., 2013). At only category 2 on the Saffir–Simpson scale, Moarkot did its destruction almost entirely from the extreme rainfall (e.g., Hendricks et al., 2011) that reached 1624 mm in 24 h, 2361 mm in 48 h, and 2748 mm in 72 (Fig. 2a and b;
25
Hsu et al., 2010) and approached the world record (Table 1). While the above studies clearly indicate that the event of Morakot was resulted from interactions across a wide range of scales, the interplay between TC motion and convection was especially
ACPD
15, 8479–8523, 2015Roles of pressure perturbations in rainband convection
of Typhoon Morakot
C.-C. Wang et al.
Title Page
Abstract Introduction
Conclusions References
Tables Figures
◭ ◮
◭ ◮
Back Close
Full Screen / Esc
Printer-friendly Version
Interactive Discussion
Discussion
P
a
per
|
Discussion
P
a
per
|
Discussion
P
a
per
|
Discussion
P
a
per
|
portant since the heaviest rainfall over southern Taiwan took place on 8 August when the TC moved the slowest (Figs. 1a and 2a and b, Wang et al., 2012).
During 8 August, two types of rainbands appeared persistently over or near Taiwan to cause the extreme rainfall. One was aligned north–south (N–S) near 120.7◦E along the windward slopes of southern Central Mountain Range (Figs. 2a–d and 3a, Wang et al.,
5
2012), produced through forced uplift of moisture-laden air by the steep topography at high precipitation efficiency (Yu and Cheng, 2013; Huang et al., 2014). The second type of rainbands, on the other hand, was nearly E–W oriented and parallel to the flow. On 8 August when Morakot’s center was over northern Taiwan Strait, these E–W bands formed repeatedly over the southern Taiwan Strait, within the strong low-level
conver-10
gence zone between the northerly to northwesterly TC circulation and the monsoonal flow from the west and southwest, as illustrated in Fig. 3a at 06:00 UTC as an example. Together, the two rainbands formed a “T-shaped” pattern and persisted into 9 August as the TC gradually moved away (Fig. 3b). Similar combinations of topographic (N–S) and TC/monsoon (E–W) rainbands were also observed in several past TCs (Kuo et al.,
15
2010), such as Mindulle (2004), Talim (2005), Haitang (2005), and Jangmi (2008), so it is not unique to Morakot. While some of them have also been noted for evident in-teraction with the southwesterly monsoon (Chien et al., 2008; Yang et al., 2008; Ying and Zhang, 2012), all are among the 12 most-rainy typhoons in Taiwan, while Morakot (2009) sits at the very top of the list (Chang et al., 2013).
20
The E–W rainbands can be classified as secondary bands (Fig. 3a), as apposed to the three other types of TC rainbands outside the eyewall: principle, connecting, and distant bands (Willoughby et al., 1984; Houze, 2010). Within them, active and vagarious convective cells formed repeatedly offthe coast of southwestern Taiwan and further upstream, then moved eastward over land, in a direction parallel to the band
25
ACPD
15, 8479–8523, 2015Roles of pressure perturbations in rainband convection
of Typhoon Morakot
C.-C. Wang et al.
Title Page
Abstract Introduction
Conclusions References
Tables Figures
◭ ◮
◭ ◮
Back Close
Full Screen / Esc
Printer-friendly Version
Interactive Discussion
Discussion
P
a
per
|
Discussion
P
a
per
|
Discussion
P
a
per
|
Discussion
P
a
per
|
inland for about 50 km, roughly west of 120.5◦E, cf. Figs. 2a–d and 3). In Fig. 4, back-building and merging and intensification of existing cells were both common in these E–W bands, and such behaviors are largely controlled by processes at convective scale. Therefore, besides a favorable forcing of low-level convergence between the TC circulation and southwesterly monsoon at meso-αandβscale to trigger the convection
5
and maintain the rainbands, whether processes at cloud and sub-cloud scale (meso-γ) also contributed in the detailed evolution of convection within the bands to cause the heavy rainfall over southwestern Taiwan? This is the focus of the present study.
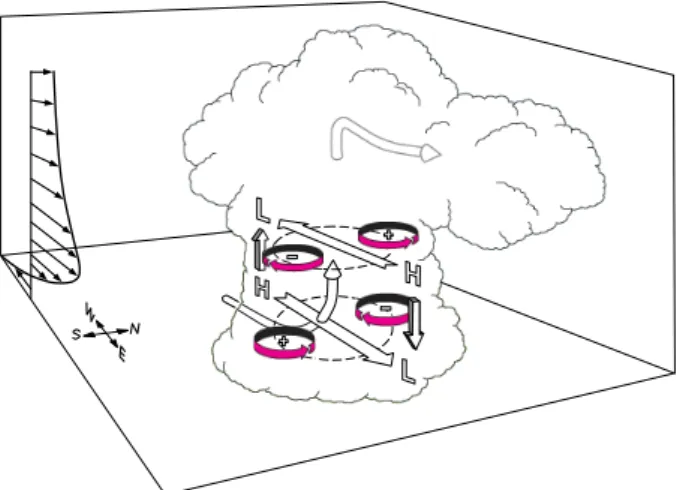
In the typhoon environment, the maximum wind speed typically occurs near the top of the planetary boundary layer (PBL) due to thermal wind relationship and the
influ-10
ence of surface friction (e.g., Hawkins and Imbembo, 1976; Anthes, 1982; Sect. 2.3). Thus, the vertical wind shear is strongly cyclonic below the level of maximum wind and reverses in direction above it. At 00:00 UTC 8 August, the areal-averaged envi-ronmental wind upstream and near southern Taiwan indeed exhibited a distinct west-northwesterly low-level jet (LLJ) reaching 20 m s−1 at 850 hPa, and the vertical shear
15
below it reversed in direction at 700–200 hPa (Fig. 5a), reminiscent to the “hairpin” shape noted by Schumacher and Johnson (2009). At 06:00 and 12:00 UTC (Fig. 5b and c), the LLJ and the associated shear through deep troposphere turned slightly to the left (into more E–W directions), in response to the northwestward movement of Morakot (cf. Fig. 1a). Based on Rotunno and Klemp (1982) and Klemp (1987), the
inter-20
action between convective updraft and its environmental flow (with LLJ and a reversed wind-shear in profile) would produce an anomalous high to the rear and an anomalous low ahead of the updraft near the surface (below the jet core) but a reversed pattern farther aloft (above the jet core). As illustrated by the schematic in Fig. 6, the effect from such dynamical pressure perturbations would be to favor updraft intensification to
25
the west of mature cells and new development there, i.e., to the back side of the E–W rainbands in our case. Thus, in the present study, we examine such a mechanism and the possible roles played by the pressure perturbations surrounding convective cells in storm evolution (such as back-building and cell merger) mainly through cloud-resolving
ACPD
15, 8479–8523, 2015Roles of pressure perturbations in rainband convection
of Typhoon Morakot
C.-C. Wang et al.
Title Page
Abstract Introduction
Conclusions References
Tables Figures
◭ ◮
◭ ◮
Back Close
Full Screen / Esc
Printer-friendly Version
Interactive Discussion
Discussion
P
a
per
|
Discussion
P
a
per
|
Discussion
P
a
per
|
Discussion
P
a
per
|
numerical simulation. In the Morakot case, such meso-γscale processes and their po-tential roles in rainfall accumulation have not been studied previously.
2 Data and methodology
2.1 Observational data
The observational data used in this study include standard weather maps, the
best-5
track data from the JTWC, infrared cloud imageries from the geostationary Multifunc-tional Transport Satellite (MTSAT) of Japan, and data from the rain-gauge network (Hsu, 1998) and radars operated by the Central Weather Bureau (CWB) of Taiwan dur-ing our case period. The radar data also include the vertical maximum indicator (VMI) of reflectivity processed into gridded format by the National Science and Technology
10
Center for Disaster Reduction (NCDR). Many of the above data have been used in the figures discussed so far.
2.2 Model and experiment
In Wang et al. (2012), the evolution of TY Morakot on 8 August 2009 was simulated in close agreement with the observations using the Cloud-Resolving Storm Simulator
15
(CReSS; Tsuboki and Sakakibara, 2007), with a horizontal grid spacing of 3 km and a dimension of 480×480×50 (vertically stretched grid with spacing∆z=100–745 m) and a model top of 25 km. Using European Center for Medium-range Weather Fore-casts (ECMWF) Year of Tropical Convection (YOTC) analyses (0.25◦×0.25◦ and 20 levels, every 6 h, e.g., Waliser and Moncrieff, 2007; Moncrieff 2010) as the initial and
20
ACPD
15, 8479–8523, 2015Roles of pressure perturbations in rainband convection
of Typhoon Morakot
C.-C. Wang et al.
Title Page
Abstract Introduction
Conclusions References
Tables Figures
◭ ◮
◭ ◮
Back Close
Full Screen / Esc
Printer-friendly Version
Interactive Discussion
Discussion
P
a
per
|
Discussion
P
a
per
|
Discussion
P
a
per
|
Discussion
P
a
per
|
For this study, a run similar to R01 was performed with identical setup, except that the model top is increased from 25 to 36 km with slightly reduced vertical resolution. This experiment is referred to as the 3 km run (Table 2) and provides the IC/BCs to a second experiment using a horizontal grid spacing of 1 km and 55 levels, such that detailed structure and evolution of the convective cells embedded inside the rainbands
5
can be reproduced and studied. The integration length of the 1 km run is 24 h starting from 00:00 UTC 8 August 2009, and model output intervals are 7.5 min. The detailed domain configuration and physics of the 3 km and 1 km runs are shown in Table 2 (also cf. Figs. 1b and 3a). For later analysis and discussion, only outputs from the 1 km model are used.
10
2.3 Analysis of pressure perturbations
In this study, to obtain the perturbation pressurep′associated with the convection in the 1 km model results for analysis, two different methods are employed. The first method is to define a background field that varies both with space and time, then separatep′
by subtracting the background from the total field. In our case, since the TC center
15
is located to the north and gradually moving away from the analysis area, set to 22– 23◦N, 119.2–120.2◦E (1◦×1◦, cf. Fig. 7a), the accompanying changes, including those with time, need to be partitioned into the background field. For pressurep(x,y,z,t), its spatial mean over a fixed area ispA(z,t) and its time average over a period fromt1 to
t2ispt(x,y,z). The time average of the spatial mean ofp is thuspAt(z), which varies
20
only withz. Here, we define∆pas the deviation ofpA(z,t) from its time averagepAt(z)
as
∆p(z,t)=pA(z,t)−pAt(z). (1)
Thus,∆p can account for the gradual increase of the areal-mean pressure with time as the TC moves northward. Containing the averaged spatial pattern plus the change
25
in its mean value with time, the background pressure (p0) is defined and computed as
p0(x,y,z,t)=pt(x,y,z)+ ∆p(z,t), (2)
ACPD
15, 8479–8523, 2015Roles of pressure perturbations in rainband convection
of Typhoon Morakot
C.-C. Wang et al.
Title Page
Abstract Introduction
Conclusions References
Tables Figures
◭ ◮
◭ ◮
Back Close
Full Screen / Esc
Printer-friendly Version
Interactive Discussion
Discussion
P
a
per
|
Discussion
P
a
per
|
Discussion
P
a
per
|
Discussion
P
a
per
|
andp′is obtained subsequently as
p′(x,y,z,t)=p(x,y,z,t)−p
0(x,y,z,t). (3)
Thus, the background pressurep0 is not a function of z only, but also varies with
lo-cation and time. Here, the time period for analysis is selected to be 03:00–12:00 UTC 8 August. When needed, the above method is also applied to other variables to obtain
5
their perturbations, including horizontal wind (u, v) and virtual potential temperature (θv).
To further examine the detailed roles of pressure perturbation on the development and evolution of convection, the vertical momentum equation is analyzed and the two components ofp′, the dynamical (p′d) and buoyancy (p′b) pressure perturbations (thus
10
p′=p′d+p′b), are evaluated following Rotunno and Klemp (1982), Klemp (1987), and Parker and Johnson (2004). In this second method, p′d and p′b and any of their con-tributing terms can be solved numerically through the relaxation method by iteration. For better clarity, the relevant formulation and procedure will be described later in Sects. 3.2 and 3.3, immediately followed by the results obtained from the 1 km
simula-15
tion for selected convective cells with the presence of a westerly wind speed maximum near the top of the PBL in the Morakot case.
3 Results of model simulation
3.1 Model result validation
The CReSS model-simulated column maximum mixing ratio of total precipitating
hy-20
drometeors (rain+snow+graupel) in the 1 km run over the period of 06:00–08:00 UTC 8 August 2009 is shown in Fig. 7, which can be compared with the radar reflectivity composites in Fig. 3 and Wang et al. (2012, their Figs. 6e–g and 7). Comparison of these figures suggests that the model successfully reproduces the rainbands associ-ated with TY Morakot near southwestern Taiwan over this period. On many occasions,
ACPD
15, 8479–8523, 2015Roles of pressure perturbations in rainband convection
of Typhoon Morakot
C.-C. Wang et al.
Title Page
Abstract Introduction
Conclusions References
Tables Figures
◭ ◮
◭ ◮
Back Close
Full Screen / Esc
Printer-friendly Version
Interactive Discussion
Discussion
P
a
per
|
Discussion
P
a
per
|
Discussion
P
a
per
|
Discussion
P
a
per
|
more than one roughly E–W aligned bands (as observed) are simulated along a rel-atively wide zone of low-level convergence between the northerly TC flow and the south-southwesterly monsoon flow (Fig. 7). These modeled rainbands are in general agreement with earlier observational studies using radars (e.g., Chen et al., 2010; Yu and Cheng, 2013; Wei et al., 2014) while there are often slight displacements in their
5
exact locations, typically by no more than 50 km. Nevertheless, the simulated accumu-lated rainfall distribution (Fig. 2e–g) compares favorably with the gauge observations on 8 August, including both 00:00–12:00 and 12:00–24:00 UTC (cf. Fig. 2b–d).
In the model, convective cells embedded inside the rainbands are repeatedly gen-erated and move eastward after initiation, as in the observation (cf. Fig. 4), and the
10
phenomena of back-building and cell mergers are successfully captured. For example, Fig. 8 shows the development and evolution of several convective cells near 22.5◦N using model outputs at 1058 m every 7.5 min over 06:30–07:00 UTC. Already mature at the beginning of this 30 min period, cell “A1” moves eastward at an estimated speed of 26.1 m s−1, while cells “B1” and “C1” also travel slightly faster at their mature stage.
15
Meanwhile, new cells, labeled as “A2”, “B2”, and “C2”, respectively, are initiated just upstream (to the west) of each of the three mature cells (Fig. 8), corresponding to back-building behavior as observed (cf. Fig. 4). At early development stage, the new cells also tend to travel faster than the adjacent old cells, most evidently for A2 that reached 31.1 m s−1and eventually catches up and merges with cell A1 shortly after 07:00 UTC.
20
Thus, the merging behavior of convective cells (cf. Fig. 4) is also reproduced and linked to the slowing-down of mature cells. Although Fig. 8 only shows a few selected cells as examples, similar back-building and merging behaviors are quite common in the 1 km run throughout 8 August (details not shown), in much agreement with the observations. Since cells A1 and A2 exhibit typical evolution in the model with clear merging
25
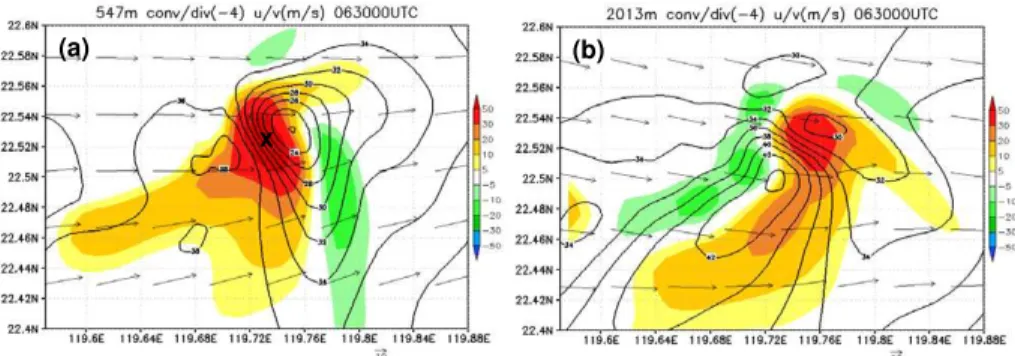
and back-building behavior, this particular pair of mature-new cells is selected for detailed study. Figure 9 presents the model-simulated horizontal winds and conver-gence/divergence associated with cell A1 at 547 and 2013 m at 06:30 UTC. While the rainband develops within the low-level convergence zone and the background
ACPD
15, 8479–8523, 2015Roles of pressure perturbations in rainband convection
of Typhoon Morakot
C.-C. Wang et al.
Title Page
Abstract Introduction
Conclusions References
Tables Figures
◭ ◮
◭ ◮
Back Close
Full Screen / Esc
Printer-friendly Version
Interactive Discussion
Discussion
P
a
per
|
Discussion
P
a
per
|
Discussion
P
a
per
|
Discussion
P
a
per
|
erly flow increased in speed toward the east (about 35 m s−1 at 1058 m near A1; cf. Fig. 7b), the local airflow surrounding the mature, deep convective cell is very diff er-ent. Near the surface (Fig. 9a), a wind speed maximum-minimum couplet exists across the updraft with a west-southwest–east-northeast (WSW–ENE) orientation and strong deceleration (higher wind speed upstream) and convergence. At 547 m, the pattern of
5
convergence resembles that of vertical motion at 1058 m (cf. Fig. 8, top panel), and extends south and west toward the area of new cell initiation (of A2). The speed con-vergence inu-wind (from∼39 to 22 m s−1) at this level across A1 is about 5×10⁻³s−1 and twice the magnitude of the confluence inv-wind, consistent with the deep convec-tion (Fig. 9a). On the other hand, the divergence at 547 m is generally located east and
10
southeast (SE) of the updraft. At 2013 m (Fig. 9b), the updraft core appears slightly to the east and thus is tilted downstream, while the wind speed couplet turns slightly to a SW–NE alignment with similar convergence (from∼45 to 29 m s−1).
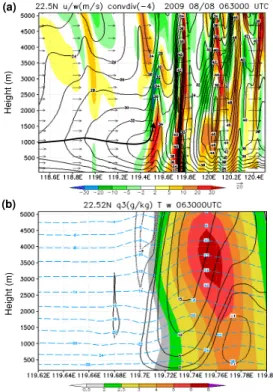
In the E–W vertical cross-section along 22.5◦N, which slices through (or near) sev-eral cells including C1, A1, and B1 at 06:30 UTC (near 119.5, 119.75, and 120.05◦E,
15
respectively, cf. Figs. 7b and 8), the local deceleration of westerly winds and conver-gence across convective cells at low levels are evident, while the oncoming environ-mental flow clearly has the structure of a LLJ with increased speed downstream and a core near 1 km in altitude (Fig. 10a). Away from the jet core level, the wind speed de-creases much more rapidly below than above, suggesting strong westerly vertical wind
20
shear near the surface (>10−2s−1 in vorticity) but weak easterly shear above the LLJ, in agreement with Fig. 5. Across theu-wind couplets, the maximum speed typically oc-curs near 2 km, indicating an upward transport of momentum of the jet by the updraft, and the minimum speed is toward the surface. Another cross-section that cuts through A1 along 22.52◦N (cf. Fig. 8) is shown in Fig. 10b and provides a close-up view of this
25
ACPD
15, 8479–8523, 2015Roles of pressure perturbations in rainband convection
of Typhoon Morakot
C.-C. Wang et al.
Title Page
Abstract Introduction
Conclusions References
Tables Figures
◭ ◮
◭ ◮
Back Close
Full Screen / Esc
Printer-friendly Version
Interactive Discussion
Discussion
P
a
per
|
Discussion
P
a
per
|
Discussion
P
a
per
|
Discussion
P
a
per
|
updraft, maximum precipitation and near-surface downdraft (below 2 km) both occur slightly downwind (Fig. 10b; cf. Fig. 8). Over the area of strongest precipitation (near 119.77◦E), temperature variation near the surface is small without any clear indication of a local cold pool (Fig. 10b). This suggests that locally, the evaporative cooling in the downdraft (reflected by a downward decrease in hydrometeors) is not strong enough
5
to overcome the adiabatic warming effect, since in near-surface air is very moist (close to saturation) and a mid-level drier layer is also lacking in typhoon environment. Thus, the cold-pool mechanism commonly seen in mid-latitudes to initiate new cells (Doswell et al., 1996) does not seem important in our case here. Nevertheless, from Figs. 8–10, we see that the model cells, especially the mature ones, are moving at speeds slower
10
than their low-level background flow, and we focus on the possible roles played by the pressure perturbations at sub-cloud scale in merging and back-building behaviors. Below, the vertical momentum equation is analyzed.
3.2 Analysis of vertical momentum equation
Following Rotunno and Klemp (1982) and Klemp (1987), the three-dimensional
mo-15
mentum equation can be expressed as
dv
dt +
1
ρ∇p=−gkˆ−fkˆ ×v+F
∗, (4)
wherev(u,v,w) is the velocity vector,ρ is air density,gis gravitational acceleration,f
is the Coriolis parameter, ˆkthe unit vector inzdirection, andF∗(Fx∗,Fy∗,Fz∗) the frictional
term. Bothp and ρ can be separated into the background and perturbation (i.e.,p=
20
p0+p′andρ=ρ0+ρ′, note thatp0here is not the same as the one given in Eq. 2) and the former is assumed to be in geostrophic and hydrostatic equilibrium. At convective scale, the Coriolis force is neglected and friction is replaced by a turbulent mixing term
F(F
x,Fy,Fz). Thus, the horizontal acceleration is caused by the perturbation PGF and
ACPD
15, 8479–8523, 2015Roles of pressure perturbations in rainband convection
of Typhoon Morakot
C.-C. Wang et al.
Title Page Abstract Introduction Conclusions References Tables Figures ◭ ◮ ◭ ◮ Back Close
Full Screen / Esc
Printer-friendly Version Interactive Discussion Discussion P a per | Discussion P a per | Discussion P a per | Discussion P a per |
turbulent mixing as
dvh
dt =−
1
ρ∇hp
′+F
x+Fy, (5)
where the subscript h denotes the horizontal components, while the vertical accelera-tion (dw/dt) can be approximated as
dw
dt =−
1
ρ ∂p′
∂z − ρ′
ρ g+Fz≈ −
1
ρ0 ∂p′
∂z − ρ′
ρ0g+Fz=−
1
ρ0 ∂p′
∂z +B+Fz, (6)
5
whereB=−g ρ′/ρ0
is the buoyancy acceleration. Thus, the vertical acceleration is driven by an imbalance among the perturbation PGF, buoyancy, and turbulent mixing.
The buoyancyB is composed of effects from gaseous phase and condensates, and the former can be accounted for by the virtual potential temperature perturbation (θv′,
whereθv=θv0+θv′) and the latter is the drag by cloud particles and precipitation, such
10
that
B=−ρ ′
ρ0
g=g θ
′
v
θv0
−g qc+qi+qr+qs+qg
, (7)
whereqc,qi,qr,qs, andqgare mixing ratios of cloud water, cloud ice, rain, snow, and graupel, respectively, and available from model outputs. The separation ofθv0and θ′v
is performed using the same method described in Sect. 2.3. Usingp′=p′d+p′b, Eq. (6)
15
can be rewritten to divide the perturbation PGF into two separate terms as
dw
dt = ∂w
∂t +u ∂w
∂x +v ∂w ∂y +w
∂w ∂z =−
1
ρ0
∂p′d ∂z −
1
ρ0
∂p′b ∂z −B
!
+Fz. (8)
Here, the equation of total derivative is used, and the vertical acceleration is driven by the dynamical perturbation PGF, the buoyancy effect (which contains both the buoyancy perturbation PGF and buoyancy acceleration), and turbulent mixing.
ACPD
15, 8479–8523, 2015Roles of pressure perturbations in rainband convection
of Typhoon Morakot
C.-C. Wang et al.
Title Page Abstract Introduction Conclusions References Tables Figures ◭ ◮ ◭ ◮ Back Close
Full Screen / Esc
Printer-friendly Version Interactive Discussion Discussion P a per | Discussion P a per | Discussion P a per | Discussion P a per |
3.3 Analysis of dynamical and buoyancy pressure perturbations
Through the use of nearly incompressible Poisson equation, Rotunno and Klemp (1982) and Klemp (1987) can obtain p′d and p′b as the following. First, Eqs. (5) and (6) in Sect. 3.2 can be combined and linearized as
∂v
∂t +v· ∇v+
1
ρ0∇p′=Bkˆ +F. (9)
5
and the incompressible continuity equation (Boussinasq approximation) is
∇ ·ρ0v=0. (10)
When Eq. (9) is multiplied through byρ0 then applied the three-dimensional gradient
operator, the first lhs term vanishes using Eq. (10), and the dynamical and buoyancy terms can be separated as
10
∇2p′
b=
∂
∂z(ρ0B) and (11)
∇2p′
d=−∇ ·(ρ0v· ∇v)+∇ ·(ρ0F) . (12)
After expansion and cancellation of terms, Eq. (12) can be rewritten as
∇2p′d=−ρ0 ∂u ∂x 2 EX1 + ∂v ∂y 2 EX2 + ∂w ∂z 2 EX3
−w2 ∂
2
∂z2 EX4
(lnρ0)
−2ρ0 ∂v ∂x ∂u ∂y SH1 +∂u ∂z ∂w ∂x SH2 +∂v ∂z ∂w ∂y SH3 (13) 15
where the first rhs term inside the brackets is the fluid extension term and the second is the shearing term. Together, Eqs. (11) and (13) are the Piosson equations of the lapla-cian ofp′d andp′b, and a maximum (minimum) in laplacian corresponds to a minimum
ACPD
15, 8479–8523, 2015Roles of pressure perturbations in rainband convection
of Typhoon Morakot
C.-C. Wang et al.
Title Page
Abstract Introduction
Conclusions References
Tables Figures
◭ ◮
◭ ◮
Back Close
Full Screen / Esc
Printer-friendly Version
Interactive Discussion
Discussion
P
a
per
|
Discussion
P
a
per
|
Discussion
P
a
per
|
Discussion
P
a
per
|
(maximum) in pressure perturbation. From Eq. (11), it can be seen thatp′bis related to the vertical gradient of buoyancyB. While a variety of processes in Eq. (13) can lead to the change in p′d, the fluid extension effect includes four terms: three terms from divergence/convergence and the fourth term linked towand the vertical gradient ofρ0
(and will be referred to as EX1, EX2, EX3, and EX4, respectively). The fluid shearing
5
effect consists of three terms related to horizontal wind shear and vertical shear of u
andv, respectively (referred to as SH1, SH2, and SH3), and SH2 and SH3 contain the shearing effect (ofS· ∇
hw) mentioned in Sect. 1.1. After∇ 2
p′b,∇2p′d, or any of its rhs terms is obtained using Eqs. (11) or (13), the relaxation method is used to solve the associated pressure perturbation through iteration.
10
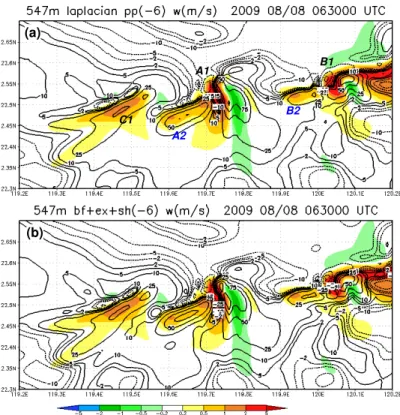
The results of∇2p′obtained by the two different methods are compared in Fig. 11 at 547 m at 06:30 UTC 8 August as an example. The patterns are generally very similar, with positive ∇2p′ (implying p′<0) to the east and negative ∇2p′ (implying p′>0) to the west of mature cells (e.g., A1 and B1) or positive ∇2p′ at and to the south-southeast (SSE) of rising motion of developing cells and negative ∇2p′ to the
north-15
northwest (NNW, e.g., A2, B2, and C1). This suggests that the separation method described in Sect. 2.3 also gives reasonable results. However, the contrast between positive and negative∇2p′values obtained from Eqs. (11) and (13) tends to be slightly larger. A comparison between Fig. 11b with patterns of∇2p′b and∇2p′dindicates that
p′is dominated byp′b(i.e.,p′d is minimal) in most area (wherew is small) except near
20
strong updrafts and downdrafts (not shown).
In Fig. 12, a closer view of the model-simulated vertical velocityw, the total pressure perturbationp′obtained through background separation and relaxation method, as well asp′d through relaxation method at (or near) three different heights of 550, 1050, and 2050 m near cell A1 for the time at 06:30 UTC are shown, together with horizontal winds
25
and vertical wind shear vectorS. Again, from the separation method, areas of p′<0
ACPD
15, 8479–8523, 2015Roles of pressure perturbations in rainband convection
of Typhoon Morakot
C.-C. Wang et al.
Title Page
Abstract Introduction
Conclusions References
Tables Figures
◭ ◮
◭ ◮
Back Close
Full Screen / Esc
Printer-friendly Version
Interactive Discussion
Discussion
P
a
per
|
Discussion
P
a
per
|
Discussion
P
a
per
|
Discussion
P
a
per
|
located to its SE at 550 m but to the southwest at 2050 m. The patterns of totalp′solved by the relaxation method at the three levels are generally similar, withp′<0 to the SE and south of the updraft andp′>0 to the north and northwest (NW, Fig. 12b, e and h). However, the N–S difference in p′ surrounding the cell is considerably larger (near 3 hPa inside the plotting domain) to give a lower value in minimum p′ (∼ −1.5 hPa).
5
The reason for this is most likely two fold: (1) the variation in background pressurep0
on the xy-plane at 06:30 UTC is larger than the time mean used, so that p′ centers are under-estimated for this time using the separation method, and (2) the frictional effect that tends to reduce the contrast in p′ is not taken into account in Eqs. (11)– (13), causing some over-estimation in p′ from the relaxation method. In agreement
10
with earlier discussion (cf. Fig. 10a), the vertical shear across the updraft at 550 m is northwesterly to westerly and quite strong (roughly 1–2×10⁻²s−1, Fig. 12c) and a clear couplet inp′d can be found withp′d>0 to the NW andp′d<0 to the SE of the updraft, which can already reach about 5 m s−1 at this level (cf. Fig. 10b). Consistent with the gradual veering of environmental wind with height in the lower troposphere (cf. Figs. 5b
15
and 12a, d and g) the vertical shear turns clockwise at 1050 and 2050 m, and the alignment of the high-low couplet inp′d also gradually changes into NNW to SSE and even north-northeast to south-southwest (Fig. 12f and i). Although the vertical shear near 1–2 km is considerably weaker (mostly<1×10⁻²s−1) than at 500 m, the largerw
and its horizontal gradient allow for a comparable magnitude inp′d(cf. Fig. 10b). Thus,
20
the patterns ofp′dup to 2 km are consistent with the SH2 and SH3 terms in Eq. (13) and our hypothesis, and with a difference of about 0.6–1 hPa across the high-low couplet, the dynamical pressure perturbations can account for a large part of the difference in totalp′near the updraft (Fig. 12).
In Fig. 10a, it is seen that deep convection can locally modify the vertical wind profile
25
and change the structure of the LLJ, so here we examine such changes and the resul-tant effect on the shearing term in Eq. (13) in greater detail before further discussion on the pressure perturbations due to different terms. In Fig. 13, the E–W vertical cross sections as in Fig. 10b (along 22.52◦N) but for kinematic variables, vertical wind shear,
ACPD
15, 8479–8523, 2015Roles of pressure perturbations in rainband convection
of Typhoon Morakot
C.-C. Wang et al.
Title Page
Abstract Introduction
Conclusions References
Tables Figures
◭ ◮
◭ ◮
Back Close
Full Screen / Esc
Printer-friendly Version
Interactive Discussion
Discussion
P
a
per
|
Discussion
P
a
per
|
Discussion
P
a
per
|
Discussion
P
a
per
|
and∇2p′dfrom SH2 are presented. In Fig. 13a, it can be clearly seen that the low-level convergence induced by the mature cell A1 also causes the LLJ to accelerate toward the updraft and decelerate beneath the updraft core. The upward transport of momen-tum inside the updraft (∼6 km in width), consistent with its eastward tilt with height, also elevates the jet to 2–4 km. Due to the formation of the tilted maximum–minimum
5
wind couplet (Fig. 13a), the vertical wind shear directly below the updraft core is en-hanced (near 119.71–119.75◦E and below 1 km, Fig. 13b). Associated with the rise of the LLJ, the northwesterly shear above the jet core at the western flank of the updraft (near 119.72◦, 2–4 km) is also strengthened to some extent. In response to this profile of vertical wind shear modified by convection, the pattern of∇2p′dfrom SH2 (multiplied
10
by−1 to have the same sign as p′d) exhibits positive p′d below 1–1.5 km to the west and negativep′dbelow∼3 km to the east of the updraft center, and a reversed pattern above to at least 5 km (Fig. 13b), again consistent with our hypothesis.
Figure 14 presents the totalp′ from background separation andp′band p′d and the major contributing terms ofp′dfrom the relaxation method along the same E–W vertical
15
cross section as Fig. 13, in addition tow. The totalp′ associated with cell A1 obtained from the two different methods have similar patterns on the vertical plain (Fig. 14a and b), with largest negative p′ of about −1 hPa near 3–4 km and higher p′ at the surface immediately to the west of the updraft core. Directly underneath the updraft and to its east, on the other hand,p′obtained through the relaxation method is smaller
20
(more negative) near the surface, which is mainly due to the effects ofp′brather thanp′d
(Fig. 14c and d). To the west of the updraft, however,p′dis the main reason for the total
p′to become positive near the surface and negative further aloft as expected (Fig. 14a– c), and the major contributing terms to this pattern is the shearing and divergent effects of the updraft (SH2 + EX3, Fig. 14e and f), in agreement with Fig. 13. The region
25
ACPD
15, 8479–8523, 2015Roles of pressure perturbations in rainband convection
of Typhoon Morakot
C.-C. Wang et al.
Title Page
Abstract Introduction
Conclusions References
Tables Figures
◭ ◮
◭ ◮
Back Close
Full Screen / Esc
Printer-friendly Version
Interactive Discussion
Discussion
P
a
per
|
Discussion
P
a
per
|
Discussion
P
a
per
|
Discussion
P
a
per
|
4 Discussion
In the previous section, the dynamical pressure perturbationp′dnear the updraft of the mature cell in the rainband is found to exhibit a pattern consistent with our hypothesis, i.e., with positive (negative) perturbation below (above) the LLJ upwind from the up-draft, and this pattern is attributed mainly to the shearing effect of the updraft on the
5
vertical wind shear associated with the jet (SH2) but also to the extension term from vertical acceleration inside the tilted updraft (EX3). The induced PGF by the totalp′
and its components (p′b and p′d) in the vertical can be computed using Eq. (8), and this is shown in Fig. 15 on the same cross section through cell A1 (along 22.52◦N). With its pattern shown in Fig. 14c, the high-low couplet of p′d west of the updraft
in-10
duces an upward-directed PGF there below about 3 km, with a peak value of roughly 7×10⁻²m s−2at 1.5 km (Fig. 15a). Such acceleration can produce an upward motion of 5 m s−1under 75 s, or from 5 to 15 m s−1in 150 s across a distance of about 1.5 km, very comparable to the acceleration below the core of the main updraft. Thus, the dis-tribution ofp′dto the rear side of the updraft can certainly affect the evolution of cell A1
15
and cause it to slow down in moving speed. In other words, the cell merging behav-ior in the rainbands consisting of multiple cells, when they develop in an environment with an intense LLJ as in the present case, can be explained by the mechanism of dynamical pressure perturbations induced through the shearing (and extension) effect. In addition, the reduced propagation speed of mature cells implies an enhancement in
20
low-level convergence upstream. Using Fig. 8 (A1 travelling at 26.1 m s−1) and assum-ing a LLJ of 35 m s−1 about 40 km upstream (cf. Figs. 10a), the speed convergence implied is about 2.2×10⁻⁴s−1, or 3.2×10⁻⁴s−1larger than the background with speed divergence of∼1×10⁻⁴s−1.
Because of the surface-based negative p′b below and east of the updraft, the
in-25
duced vertical PGF byp′b is also negative (directed downward) below 3 km (Figs. 14d and 15b), suggesting that the downwind side of the updraft is less favorable for its main-tenance and further development. The buoyancyBis mostly positive inside the updraft
ACPD
15, 8479–8523, 2015Roles of pressure perturbations in rainband convection
of Typhoon Morakot
C.-C. Wang et al.
Title Page
Abstract Introduction
Conclusions References
Tables Figures
◭ ◮
◭ ◮
Back Close
Full Screen / Esc
Printer-friendly Version
Interactive Discussion
Discussion
P
a
per
|
Discussion
P
a
per
|
Discussion
P
a
per
|
Discussion
P
a
per
|
(Fig. 15c) and this can only come from an increasedθ′v due to latent heat release (cf.
Eq. 7). AlthoughBis also positive below the updraft core and even to the west (below 1 km), its values are smaller than the upward acceleration induced by thep′d pattern and largely cancelled by the effect ofp′b. Thus, when all three terms in Fig. 15a–c are added together in Fig. 15d, their total effect on vertical acceleration (cf. Eq. 8)
resem-5
bles that from the effect ofp′dalone in both the pattern and magnitude (cf. Fig. 15a). From Fig. 14c and e, the positivep′d near the surface can be seen to also produce horizontal PGF apart from the vertical PGF, and the westward-directed PGF upstream from A1 (west of 119.7◦E) can be estimated using Eq. (5) to be about 3–7×10⁻³m s−2, which is about one order of magnitude smaller than the PGF in the vertical fromp′d.
10
Nevertheless, a value of 5×10⁻³m s−2is enough to decelerate the oncoming westerly flow by 1 m s−1 in 200 s and induce a speed convergence of roughly 1.4×10⁻⁴s−1 (again assuming a background flow of 35 m s−1). Even though this value is one order of magnitude smaller than the convergence associated with cell A2 at 06:30 UTC during its early stage of development (∼1.5×10⁻³s−1, cf. Fig. 9a) the combined convergence
15
with that implied by a slower moving speed of A1 (as discussed earlier) would be about 4.6×10⁻⁴s−1 larger compared to its surrounding. This is certainly not negligible and can provide additional forcing to favor new cell development upstream from the old cell. Therefore, the role played by the dynamical pressure perturbation in producing an anomalous high near the surface and additional uplift at the rear flank of the updraft
20
of mature cells can favor both merging and new cell initiation further upstream, i.e., the behavior commonly found in back-building MCSs, in the rainbands of TY Morakot (2009) when a strong LLJ is present in the background environment.
In the Mei-yu season (May–June), quasi-linear MCSs also often develop near the Mei-yu front in an environment with a LLJ (e.g., Chen, 1992; Chen and Chou, 1993;
25
ACPD
15, 8479–8523, 2015Roles of pressure perturbations in rainband convection
of Typhoon Morakot
C.-C. Wang et al.
Title Page
Abstract Introduction
Conclusions References
Tables Figures
◭ ◮
◭ ◮
Back Close
Full Screen / Esc
Printer-friendly Version
Interactive Discussion
Discussion
P
a
per
|
Discussion
P
a
per
|
Discussion
P
a
per
|
Discussion
P
a
per
|
not as strong in the Mei-yu season, a similar interaction between the updrafts and LLJ may promote cell merging and initiation of new cells upstream, and thus contribute to heavy rainfall and related weather hazards.
5 Conclusion and summary
Typhoon Morakot in August 2009 was the most devastating TC to hit Taiwan over the
5
past 50 years, with extreme rainfall that came close to the 24 h and 48 h world records. During the period of heaviest rainfall on 8 August, when the TC center was over the northern Taiwan Strait, the E–W oriented, persistent, and slow-moving rainbands and the embedded deep convection that propagated eastward (parallel to the bands) were responsible for the serious and wide-spread flooding over the southwestern plains of
10
Taiwan. Developing inside the low-level convergence zone between the TC vortex (from the N/NW) and the monsoon flow (from the WSW) over southern strait, as also ob-served in several other past TCs, these rainbands were collocated with a westerly LLJ and exhibited frequent cell merging and back-building behavior that contributed to the heavy rainfall. Thus, the possible roles of pressure perturbations associated with deep
15
convection on rainband behavior of TY Morakot (2009) are investigated in this study, mainly through the use of simulation results from the CReSS model at a horizontal grid-spacing of 1 km every 7.5 min.
In the model, the rainbands, multiple cells embedded, their eastward movement, and merging and back-building behavior are all successfully captured in close agreement
20
with the observations, although slight positional errors are often unavoidable. In its mature stage, a particular cell at 06:00 UTC 8 August is selected for detailed study. As hypothesized (cf. Fig. 6) following Rotunno and Klemp (1982) and Klemp (1987), in an environment of a LLJ (∼35 m s−1) with reversed vertical wind shear below and above, the interaction between convective updraft and such a vertical shear profile produces
25
a positive dynamical pressure perturbationp′d to the west (rear) and a negativep′d to the east of the updraft near the surface (∼500 m), butp′d<0 to the west andp′d>0 to
ACPD
15, 8479–8523, 2015Roles of pressure perturbations in rainband convection
of Typhoon Morakot
C.-C. Wang et al.
Title Page
Abstract Introduction
Conclusions References
Tables Figures
◭ ◮
◭ ◮
Back Close
Full Screen / Esc
Printer-friendly Version
Interactive Discussion
Discussion
P
a
per
|
Discussion
P
a
per
|
Discussion
P
a
per
|
Discussion
P
a
per
|
the east farther aloft above the jet core (>2 km). At the rear side, the positive-negative couplet ofp′din the vertical has a difference of about 1 hPa inp, and induces an upward directed PGF whose magnitude is comparable to the acceleration inside the updraft core. This configuration favors updraft development at the rear flank, and subsequently causes the mature cells to slow down and merge with approaching new cells, which
5
remain faster without a strong updraft. The intense updraft of this mature cell, reaching 10 m s−1at 1.3 km and about 20 m s−1at mid-level, is also found to elevate the jet and act to enhance the local vertical wind shear both above and below the jet core at its rear flank, aided by the induced near-surface convergence at cloud scale.
Through the use of relaxation method to solve for each contributing terms ofp′d(and
10
the buoyancy perturbation pressurep′b, where p′=p′d+p′b), our results indicate that the above vertical couplet ofp′dto the rear flank is mainly caused by the shearing effect (SH2 in Eq. 13, or−2ρ0(∂u/∂z)(∂w/∂x)), but also contributed by the vertical extension
term (EX3 in Eq. 13, or−ρ0(∂w/∂z) 2
), i.e., by the upward acceleration of the updraft, at low levels, while the effect ofp′bis nearly counteracted by the buoyancyB near the
15
mature cell examined. Near the surface, the westward-directed horizontal PGF induced by the positivep′dat the rear side, when combined with the effect from the slow-down of mature cells, can produce an estimated additional convergence (in speed) roughly 1/4– 1/3 of the value associated with developing new cell further upstream. Thus, a positive
p′d near the surface in the couplet is also helpful to new cell initiation some distance
20
upstream, i.e., the back-building process, compared to the conditions without a mature cell. Finally, the updraft in the mature cell in our case tilts eastward (downwind) with height due to the presence of the LLJ, and the maximum precipitation and near-surface downdraft occur at the eastern side. However, a clear cold pool through evaporative cooling is not found since the low-level air is very moist and a dry layer does not exist
25
ACPD
15, 8479–8523, 2015Roles of pressure perturbations in rainband convection
of Typhoon Morakot
C.-C. Wang et al.
Title Page
Abstract Introduction
Conclusions References
Tables Figures
◭ ◮
◭ ◮
Back Close
Full Screen / Esc
Printer-friendly Version
Interactive Discussion
Discussion
P
a
per
|
Discussion
P
a
per
|
Discussion
P
a
per
|
Discussion
P
a
per
|
Acknowledgement. The authors wish to acknowledge the Central Weather Bureau (CWB) in providing Fig. 2a and the panels used in Fig. 3b (as well as nearly all observational data) and the National Science and Technology Center for Disaster Reduction (NCDR) of Taiwan in providing the digital data used in Fig. 4. This study is jointly supported by the Ministry of Science and Technology of Taiwan under Grants NSC-102-2119-M-003-003 and
NSC-103-5
2119-M-003-001-MY2.
References
Anthes, R. A.: Tropical Cyclones, Their Evolution, Structure and Effects, Meteor. Monogr., No. 41, American Meteorological Society, Boston, MA, USA, 208 pp., 1982.
Bluestein, H. B. and Jain, M. H.: Formation of mesoscale lines of precipitation: severe squall
10
lines in Oklahoma during the spring, J. Atmos. Sci., 42, 1711–1732, 1985.
Brooks, H. E. and Stensrud, D. J.: Climatology of heavy rain events in the United States from hourly precipitation observations, Mon. Weather Rev., 128, 1194–1201, 2000.
Browning, K. A.: Organization of clouds and precipitation in extratropical cyclones, in: ex-tratropical cyclones: the Erik Palmén Memorial Volume, edited by: Newton, C. W. and
15
Holopanien, E. O., Boston, MA, USA, Am. Meteor. Soc., 129–153, 1990.
Carbone, R. E.: A severe frontal rainband, Part I, stormwide hydrodynamic structure, J. Atmos. Sci., 39, 258–279, 1982.
Corfidi, S. F., Meritt, J. H., and Fritsch, J. M.: Predicting the movement of mesoscale convective complexes, Weather Forecast., 11, 41–46, 1996.
20
Chang, C.-P., Yang, Y.-T., and Kuo, H.-C.: Large increasing trend of tropical cyclone rainfall in Taiwan and the roles of terrain, J. Climate, 26, 4138–4147, 2013.
Chappell, C. F.: Quasi-stationary convective events, in: Mesoscale Meteorology and Forecast-ing, edited by: Ray, P., American Meteorological Society, Boston, MA, USA, 289–310, 1986. Chen, G. T.-J.: Mesoscale features observed in the Taiwan Mei-Yu season, J. Meteor. Soc.
25
Japan, 70, 497–516, 1992.
Chen, G. T.-J. and Chou, H.-C.: General characteristics of squall lines observed in TAME X, Mon. Weather Rev., 121, 726–733, 1993.
ACPD
15, 8479–8523, 2015Roles of pressure perturbations in rainband convection
of Typhoon Morakot
C.-C. Wang et al.
Title Page
Abstract Introduction
Conclusions References
Tables Figures
◭ ◮
◭ ◮
Back Close
Full Screen / Esc
Printer-friendly Version
Interactive Discussion
Discussion
P
a
per
|
Discussion
P
a
per
|
Discussion
P
a
per
|
Discussion
P
a
per
|
Chen, G. T.-J., Wang, C.-C., and Lin, D. T.-W.: Characteristics of low-level jets over northern Taiwan in Mei-yu season and their relationship to heavy rain events, Mon. Weather Rev., 133, 20–43, 2005.
Chen, T.-C., Wei, C.-H., Lin, P.-L., and Liou, Y.-C.: The characteristics of radar-observed mesoscale rainbands of Typhoon Morakot, in: Scientific Report on Typhoon Morakot (2009),
5
edited by: Hsu, H.-H., Kuo, H.-C., Jou, J.-D., Chen, T.-C., Lin, P.-H., Yeh, T.-C., and Wu, C.-C., National Science Council, Taipei, Taiwan, 53–81, (in Chinese), 2010.
Chien, F.-C. and Kuo, H.-C.: On the extreme rainfall of Typhoon Morakot (2009), J. Geophys. Res., 116, D05104, doi:10.1029/2010JD015092, 2011.
Chien, F.-C., Liu, Y.-C., and Lee, C.-S.: Heavy rainfall and southwesterly flow after the leaving
10
of Typhoon Mindulle (2004) from Taiwan, J. Meteor. Soc. Jpn., 86, 17–41, 2008.
Doswell, C. A., III: Severe convective storms – an overview, in: Severe Convective Storms, Meteor. Monogr., Boston, MA, USA. Doswell, C. A. III, ISBN: 978-1-878220-41-7, No. 50, Amer. Meteor. Soc., 1–26, 2001.
Doswell, C. A., III, Brooks, H. E., and Maddox, R. A.: Flash flood forecasting: an
ingredients-15
based methodology, Weather Forecast., 11, 560–581, 1996.
Garstang, M., Massie, H. L., Jr., Halverson, J., Greco, S., and Scala, J.: Amazon coastal squall lines, Part I, structure and kinematics, Mon. Weather Rev., 122, 608–622, 1994.
Guhathakurta, P.: Highest recorded point rainfall over India, Weather, 62, p. 349, doi:10.1002/wea.154, 2007.
20
Hawkins, H. F. and Imbembo, S. M.: The structure of a small, intense hurricane – Inez 1966, Mon. Weather Rev., 140, 418–442, 1976.
Hendricks, E. A., Moskaitis, J. R., Jin, Y., Hodur, R. M., Doyle, J. D., and Peng, M. S.: Prediction and diagnosis of Typhoon Morakot (2009) using the Naval Research Lab-oratory’s mesoscale tropical cyclone model, Terr. Atmos. Oceanic Sci., 22, 579–594,
25
doi:10.3319/TAO.2011.05.30.01(TM), 2011.
Holland, G. J.: WMO/TC-No. 560, Report No. TCP-31, World Meteorological Organization, Geneva, Switzerland, 1993.
Hong, C.-C., Lee, M.-Y., Hsu, H.-H., and Kuo, J.-L.: Role of submonthly disturbance and 40–50 day ISO on the extreme rainfall event associated with Typhoon Morakot (2009) in southern
30
ACPD
15, 8479–8523, 2015Roles of pressure perturbations in rainband convection
of Typhoon Morakot
C.-C. Wang et al.
Title Page
Abstract Introduction
Conclusions References
Tables Figures
◭ ◮
◭ ◮
Back Close
Full Screen / Esc
Printer-friendly Version
Interactive Discussion
Discussion
P
a
per
|
Discussion
P
a
per
|
Discussion
P
a
per
|
Discussion
P
a
per
|
Houston, A. L. and Wilhelmson, R. B.: Observational analysis of the 27 May 1997 central Texas tornadic event, Part I, prestorm environment and storm maintenance/propagation, Mon. Weather Rev., 135, 701–726, 2007.
Houze, R. A. Jr.: Structure and dynamics of a tropical squall-line system, Mon. Weather Rev., 105, 1540–1567, 1977.
5
Houze, R. A., Jr.: Clouds in tropical cyclones, Mon. Weather Rev., 138, 293–344, 2010. Houze, R. A., Jr., Smull, B. F., and Dodge, P.: Mesoscale organization of springtime rainstorms
in Oklahoma, Mon. Weather Rev., 118, 613–654, 1990.
Hsu, H.-H., Kuo, H.-C., Jou, J.-D., Chen, T.-C., Lin, P.-H., Yeh, T.-C., and Wu, C.-C.: Scientific report on Typhoon Morakot (2009), National Science Council, Taipei, Taiwan, 192 pp., (in
10
Chinese), 2010.
Hsu, J.: ARMTS up and running in Taiwan, Väisälä News, 146, 24–26, 1998.
Hsu, L.-H., Kuo, H.-C., and Fovell, R. G.: On the geographic asymmetry of typhoon translation speed across the mountainous island of Taiwan, J. Atmos. Sci., 70, 1006–1022, 2013. Huang, H.-L., Yang, M.-J., and Sui, C.-H.: Water budget and precipitation efficiency of Typhoon
15
Morakot (2009), J. Atmos. Sci., 71, 112–129, 2014.
Johnson, R. H. and Mapes, B. E.: Mesoscale processes and severe convective weather, edited by: Doswell, C. A. III, ISBN: 978-1-878220-41-7, 15, Boston, MA, USA, in: Severe Convective Storms, Meteor. Monogr., No. 50, Amer. Meteor. Soc., 71–122, 2001.
Jou, B. J.-D., Lee, W.-C., and Johnson, R. H.: An overview of SoWMEX/TiMREX and its
oper-20
ation, edited by: Chang, C.-P., Ding, Y., Lau, N.-C., Johnson, R. H., Wang, B., and Yasunari, T., in: The Global Monsoon System: Research and Forecast, 2nd edn., World Scientific, Singapore, 303–318, 2011.
Klemp, J. B.: Dynamics of tornadic thunderstorms, Annu. Rev. Fluid Mech., 19, 369–402, 1987. Kuo, H.-C., Yang, Y.-T., and Chang, C.-P.: Typhoon Morakot (2009): interplay of southwest
mon-25
soon, terrain, and mesoscale convection, Int. Workshop on Typhoon Morakot (2009), Taipei, Taiwan, National Science Council and National Applied Research Laboratories, Taipei, Tai-wan, 25–26 March 2010, p. 55, 2010.
Lee, C.-S., Wu, C.-C., Chen, T.-C., and Elsberry, R. L.: Advances in understanding the “perfect monsoon-influenced typhoon”: summary from international conference on typhoon Morakot
30
(2009), Asian-Pacific J. Atmos. Sci., 47, 213–222, 2011.
![Figure 3. (a) The composite of radar VMI reflectivity (dBZ, scale on the right) near Taiwan overlaid with the ECMWF-YOTC 850 hPa horizontal winds [m s −1 , full (half) barb = 10 (5) m s −1 ] at 06:00 UTC 8 August 2009](https://thumb-eu.123doks.com/thumbv2/123dok_br/18389927.357416/33.918.96.602.131.403/figure-composite-reflectivity-taiwan-overlaid-ecmwf-horizontal-august.webp)