Journal of Applied Fluid Mechanics, Vol. 9, No. 2, pp. 593-604, 2016. Available online at www.jafmonline.net, ISSN 1735-3572, EISSN 1735-3645.
Mixed Convection Heat Transfer Enhancement in a
Vented Cavity Filled with a Nanofluid
A. Bahlaoui
1†, A. Raji
2, M. Hasnaoui
3and M. Naïmi
21
Sultan Moulay Slimane University, Polydisciplinary Faculty, Physics Department, Interdisciplinary Laboratory of Research in Sciences and Technologies (LIRST), B. P. 592, Béni-Mellal 23000, Morocco
2
Sultan Moulay Slimane University, Faculty of Sciences and Technologies, Physics Department, Laboratory of Flows and Transfers Modelling (LAMET), B. P. 523, Béni-Mellal 23000, Morocco
3
Cadi Ayyad University, Faculty of Sciences Semlalia, Physics Department, Laboratory of Fluid Mechanics and Energetics (LMFE), Unit associated to CNRST (URAC 27), B.P. 2390, Marrakech, Morocco
†Corresponding Author Email: bahlaoui75@yahoo.fr and a.bahlaoui@usms.ma
(Received January 19, 2015; accepted May 13, 2015)
A
BSTRACTIn this paper, a numerical investigation is carried out on mixed convection in a vertical vented rectangular enclosure filled with Al2O3-water nanofluid. The mixed convection effect is attained by heating the right wall
by a constant hot temperature and cooling the cavity by an injected or sucked imposed flow. The effects of some pertinent parameters such as the Reynolds number, 100 Re 5000, the solid volume fraction of the nanoparticles, 0 0.1, and the aspect ratio of the cavity, 1 A 4, on flow and temperature patterns as well as on the heat transfer rate within the enclosure are presented for the two ventilation modes. For a value of the aspect ratio A = 2, the obtained results demonstrate that the increase of volume fraction of nanoparticles contributes to an enhancement of the heat transfer and to an increase of the mean temperature within the cavity. Also, it was revealed that the fluid suction mode yields the best heat transfer performance. In the case when A is varied from 1 to 4, it was obtained that the heat transfer enhancement, using nanofluids, is more pronounced at shallow enclosures than at tall ones.
Keywords: Mixed convection; Nanofluid; Suction; Injection; Vented cavity; Numerical study.
N
OMENCLATUREA aspect ratio of the cavity
H/W
B relative width of the openings
/W
cp specific heat (J/kg.K)g gravitational acceleration (m/s2) H height of the cavity (m)
width of the openings (m) Nu mean Nusselt number Pr Prandtl number
f/f
Ra Rayleigh number
gβf(TH-TC)W /αf f
3
Re Reynolds number
uoW/f
Ri Richardson number
Ra/Re2Pr
t dimensionless time
tuo/W
T dimensionless temperature
(TTC)/(THTC)
T dimensional temperature (K) T dimensionless mean temperature
C
T Temperature of the imposed inflow (K)
o
u velocity of the imposed flow (m/s) (u, v) dimensionless velocity
components
(u,v)/uo
W width of the cavity (m) (x, y) dimensionless coordinates
(x ,y)/W
thermal diffusivity (m2/s)
thermal expansion coefficient (1/K)
thermal conductivity (W/(K.m)) dynamic viscosity (N.s/m2)
kinematic viscosity (m2/s)
density (Kg/m3)
solid volume fraction
dimensionless stream function
/uoW
dimensionless vorticity
W/uo
Subscripts
C cold temperature
H hot temperature max maximum value min minimum value nf nanofluid
S solid particles
Superscripts
dimensional variable
1.
I
NTRODUCTIONWith the advancement of engineering technology, there comes an increasing demand for an efficient cooling which is one of the most important challenges. Low thermal conductivity of working fluids such as water, engine oil or ethylene glycol constitutes the main drawback in enhancing the performance and the compactness of many engineering devices. Therefore, various techniques are applied to overcome this problem. One of them is the use of solid particles, with high thermal conductivity, as an additive suspended into the base fluid. Mixture of nano-size particles uniformly dispersed and suspended in a base fluid is referred to as a nanofluid. The improved heat transfer performance of nanofluids is due to the fact that the nanoparticles increase the heat capacity, and improve the thermal conductivity of the fluid (Eastman et al. 2001; Xie et al. 2003; Jana et al. 2007). This heat transfer improvement makes nanofluids particularly well-suited in heat exchanger designs with convection and can be considered as a new promising technology for heat transfer enhancement.
Various investigations on natural convection heat transfer enhancement using nanofluids were implemented by researchers with different numerical methods. In the case of localized heating, Oğüt (2009) examined numerically the heat transfer enhancement of water based nanofluids in an inclined enclosure with a constant flux heater. The results showed that the presence of nanoparticles causes a substantial increase in the heat transfer rate and, as expected, nanoparticles with a higher thermal conductivity (such as Ag and Cu) produced a greater enhancement in the rate of heat transfer. Another numerical study was carried out by Aminossadati and Ghasemi (2009) on natural convection in an enclosure heated from below by one heat source and filled with different types of nanofluids. It revealed that the increase of solid volume fraction of nanoparticles involved the heat source maximum temperature to decrease particularly at low Rayleigh numbers where conduction is the main heat transfer mechanism. Moreover, the increase of heat source length increases the heat transfer to the nanofluid and therefore, increases the surface temperature of the heat source and the strength of natural convection circulating cells within the enclosure. The same authors (Aminossadati and Ghasemi 2011) explored the problem when two pairs of heat source-sink were considered on the bottom wall of a square cavity filled with a water-CuO nanofluid. The obtained results showed that regardless of the position of the pairs of source-sink, the heat transfer rate increases with an increase of the Rayleigh number and the solid volume fraction. Heat transfer
in a square cavity with partially active vertical walls filled with Cu-water nanofluid was treated numerically by Sheikhzadeh et al. (2011). It was observed from the results that the average Nusselt number increases with increasing both the Rayleigh number and the volume fraction of the nanoparticles. Moreover, the maximum average Nusselt number for the high and the low Rayleigh numbers occur for the bottom-middle and the middle-middle locations of the thermally active parts, respectively. When the heater is disposed within the cavity, such problem was investigated by Mahmoodi (2011) for free convection of various water based nanofluids in a square cavity. It was found that at high Rayleigh numbers, the Ag-water nanofluid is more effective to enhance the heat transfer rate while at low Rayleigh numbers the type of nanofluids does not affect the heat transfer rate. In the case of total heating, Alloui et al. (2011) have developed an analytical and numerical study of natural convection in a shallow horizontal rectangular cavity filled with nanofluids and totally heated from the horizontal walls. It was found that the presence of nanoparticles reduces the strength of flow field, enhances the heat transfer depending on both the strength of convection and the volume fraction of the nanofluid and contributes to stabilize the system. Another study related to natural convection of water-based nanofluids in a differentially heated tilted enclosure was numerically conducted by Kahveci (2010). It was concluded from the results that suspended nanoparticles substantially increase the heat transfer rate and the variation in the average Nusselt number is nearly linear with the solid volume fraction. The results also show that a minimum heat transfer takes place at = 90° and a maximum heat transfer takes place at = 30° or 45° dependently on Ra. Experimental studies related to the heat convection of nanofluid are also available and showed some divergence about the impact of nanoparticles on heat transfer. In this context, Ho et al. (2010) conducted an experimental study concerning natural convection of Al2O3-water nanofluid in vertical
square enclosures. They showed systematic heat transfer degradation for the nanofluids containing nanoparticles of 2 % over the entire range of the Rayleigh number considered. However, for the nanofluid containing much lower particles fraction ( < 0.1 %), a heat transfer enhancement of around 18 % compared with that of water was found to arise in the largest enclosure at sufficiently high Rayleigh number. Very recently, experimental and numerical investigations were performed by Zabihi et al. (2013) to evaluate heat transfer characteristics of Al2O3-water nanofluid inside a triangular tube
number. Moreover, it was perceived that nanoparticles altered the velocity profile and increased the maximum amount of velocity inside the triangular tube. The problem of natural convection cooling of a nanofluid in a square cavity differently heated with a linear temperature from its left wall was studied numerically by Abbasian Arani et al. (2014). The results obtained showed that the flow and temperature patterns are affected by the temperature distribution mode. Moreover, the addition of the nanoparticles in the base fluid enhances or reduces the average Nusselt number depending on Ra and .
Most studies on this topic were concerned mainly with forced convection applications. Among these studies, we quote those of Santra et al. (2009) and Kalteh et al. (2011), related to forced convection of copper-water nanofluid in a two-dimensional horizontal rectangular duct. The obtained results indicated that the heat transfer enhancement increased by increasing Reynolds number and nanoparticles volume concentration (for both Newtonian and non-Newtonian base fluid) as well as with decrease in the nanoparticles diameter. Heat transfer characteristics of a miniature heat sink cooled by SiO2-water nanofluid (Fazeli et al. 2012)
or Al2O3-water nanofluid (Zirakzadeh et al. 2012)
were investigated experimentally. The authors showed that SiO2/(Al2O3) nanoparticles dispersed
into the water increased significantly the heat transfer coefficient of the heat sink while they led to a decrease of the thermal resistance of the latter. Forced convection heat transfer of a miniature plate fin heat sink cooled with SiO2 nanofluids was
studied numerically by Hashemi et al. (2012). The analysis revealed that SiO2-water nanofluid has a
considerable effect on heat transfer augmentation and can be considered as a promising replacement of water in cooling systems.
The combination of forced and natural convection has been recommended for high heat dissipating electronic components, where natural convection was not able to provide required cooling. Thus, modeling of mixed convection heat transfer within enclosures using nanofluids has been recently the subject of many studies. Several works were focused on mixed convection flow in an inclined or vertical enclosure having one or two moving walls at constant speed and filled with nanofluids (Abu-Nada and Chamkha 2010; Alinia et al. 2011; Sheikhzadeh et al. 2012). The results revealed that addition of nanoparticles causes significant changes in the flow pattern, enhances heat transfer in the cavity remarkably and this is accentuated by inclination of the enclosure at moderate and large Richardson numbers.
Relatively, little attention has been devoted to the mixed convection of nanofluids in ventilated cavities in spite of the presence of the phenomenon in several applications like solar energy storage, heat exchangers, lubrication technologies, drying technologies and cooling of the electronic devices. Concerning this subject, a numerical investigation of mixed convection flows through a copper-water
nanofluid in a vented square cavity has been executed by Shahi et al. (2010) in the case of imposed heat flux. The results indicate that increase in solid concentration leads to increase in the average Nusselt number at the heat source surface and decrease in the average bulk temperature. The same problem was studied by Mahmoudi et al. (2010) with imposed temperature for different locations of inlet and outlet. The authors found that the presence of nanoparticles is more effective in Bottom-Top configuration in comparison with other configurations, while the increase in solid concentration has the least effects in Top-Top configuration. Another study of unsteady mixed convection flows through an alumina-water nanofluid in a ventilated square cavity was performed by Sourtiji et al. (2011) for the Top-Bottom configuration. It was observed that the heat transfer is enhanced for all the Strouhal and Richardson numbers investigated by adding nanoparticles to the base fluid.
Based on the previous literature review, no study which compares the performances of imposed flow modes has been reported yet. As such, the focus of this paper is to simulate numerically the mixed convection heat transfer of alumina-water nanofluid in a vertical vented cavity with inlet and outlet ports due to injection / (suction) of incoming / (leaving) flow. The consequence of varying the Reynolds number, the nanoparticles concentration, the aspect ratio and the mode of imposed forced flow (injection or suction) on flow pattern, temperature field and heat transfer performance have been investigated and discussed.
2.
P
ROBLEM DEFINITION ANDM
ATHEMATICALF
ORMULATIONThe basic flow configuration used in the analysis is shown in Fig. 1. It consists of a vertical vented rectangular cavity having an aspect ratio, 1 A 4, and uniformly heated with a constant temperature from its right vertical wall while the remaining walls are adiabatic. The cavity is filled with a suspension of Al2O3 nanoparticles in water. The
physical system is subjected to an external flow which passes through the cavity by injection (Fig. 1(a)) or suction (Fig. 1(b)). The nanofluid enters into the cavity from the right opening located on the bottom horizontal wall and leaves from the left opening located on the upper vertical one. These openings have a constant relative dimension, B = 1/4. Thus, it is assumed that both the fluid phase and nanoparticles are in thermal equilibrium and there is no slip between them. Except for the density, the properties of nanoparticles and fluid are taken to be constant. Table 1 (Eastman et al. 2001) presents thermophysical properties of water and Al2O3 evaluated at the reference temperature, TC. It
Fig. 1. Schematic diagram of the physical model: a) Injection case, b) Suction case.
Table 1 Thermophysical properties of the pure fluid and nanoparticles (Eastman et al. 2001)
Physical properties
Pure fluid (water)
Alumina (Al2O3)
cp (J/kg.K) 4179 765
(kg/m3) 997.1 3970
(W/m.K) 0.613 40
10-5 (K-1) 21 0.85
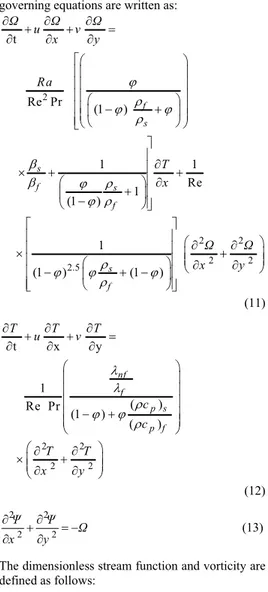
Therefore, under these assumptions, the corresponding set of differential equations in terms of the stream function-vorticity formulation can be written in a dimensional form as follows:
2 2
2 2
( ) t
nf
nf
nf
Ω Ω Ω T
u v g
x y x
Ω Ω
x y
(1)
2 2
2 2
t
x y
n f
T T T
u v
x y
T T
(2)
2 2
2 2
x y
(3)
The velocity components are related to the stream function and the vorticity by the following expressions:
Ψ u
y
;
Ψ v
x
and
v u
x y
(4)
The nanofluid effective density, thermal diffusivity, heat capacitance and the thermal expansion coefficient are given respectively by:
(1 )
nf s f
(5)
( )
nf nf
p nf c
(6)
(cp nf) ( cp s) (1 ) ( cp f) (7)
()nf s s (1 ) f f (8)
The nanofluid effective thermal conductivity is approximated by the widely used Maxwell-Garnett model (Maxwell-Garnett 1904):
2 2 ( )
2 ( )
s f f s
nf
f s f f s
(9)
The use of this equation is restricted to spherical nanoparticles where it does not account for other shapes of nanoparticles. This model is found to be appropriate for studying heat transfer enhancement using nanofluids (Maiga et al. 2005; Akbarinia and Behzadmehr 2007; Abu-Nada and Oztop 2009). This model is identical to that proposed by Hamilton and Crosser (1962) for spherical nanoparticles whose shape factor is equal to 3. Also, despite the simplicity of the MGM, a comparison against the results obtained with Patel model (Patel et al. 2005) leads to confident conclusions about the model used for the effective thermal conductivity of the nanofluid (see Fig. 2).
The viscosity of the nanofluid can be approximated as viscosity of a base fluid f containing dilute
suspension of fine spherical particles and is assumed to follow the Brinkman relation (Brinkman 1952) given by:
2.5 (1 )
f nf
(10)
governing equations are written as: 2 2 2 2 2 2.5 t Re Pr (1 ) 1 1 Re 1 (1 ) 1
(1 ) (1 )
f s s f s f s f
Ω Ω Ω
u v x y Ra T x Ω Ω x y (11) 2 2 2 2
t x y
1
( )
Re Pr (1 ) ( ) nf f p s p f
T T T
u v c c T T x y (12) 2 2 2 2
Ψ Ψ Ω
x y
(13)
The dimensionless stream function and vorticity are defined as follows:
y u x v x Ψ v ; y Ψ u
and
(14)10 12 14 16 18 20 22
0.00 0.01 0.02 0.03 0.04 0.05 Mahmoudi et al. (2010)
Present work
Nu
Re = 50 Re = 100
Fig. 2. Average Nusselt numbers, Nu, in a vented square cavity subjected to an external copper-water nanofluid, for Ri = 1 and different values
of Re and .
2.1. Boundary Conditions
The common boundary conditions related to the two
ventilation modes are written as: u = v = 0 on the rigid walls
1
T on the right vertical heated wall
0 n T
on the adiabatic walls
= 0 on the walls at the left of the two openings
= B on the walls at the right of the two openings
n indicates the outward normal to the considered adiabatic wall.
Appropriate boundary conditions associated to the injection or suction modes are such:
Injection case:
T = 0, = x – (1 – B), = 0, u = 0, v = 1 at the inlet port
For this injection mode, the boundary conditions are unknown at the outlet opening. Values of u, v, T, and are extrapolated at each time step by considering zero second derivatives of these variables at the exit of the cavity.
Suction case:
T = 0 at the inlet port
u = 0, v = 1, = x, 0 at the outlet port
For this suction mode, the boundary conditions for u, v, and are unknown at the inlet while the temperature T is unknown at the outlet. Similarly to the previous case, values of these variables are obtained at each time step by considering zero second derivatives of these variables at these openings.
On the other hand, the vorticity on the rigid boundaries being unknown, an approximate relationship, due to Woods (1954), such as:
W W 1 2 W 1 W
1 3
Ω Ω Ψ Ψ
2 Δη
(15)
is used for its stability and accuracy, where w stands for the wall and the space step in the normal direction to the wall.
2.2. Heat Transfer
In order to estimate the heat transfer enhancement and investigation of cooling efficiency, we use the mean Nusselt number, Nu, calculated at the heated right wall of the cavity such as:
0 1 1 = A A nf f x T Nu dy x
(16)3.
N
UMERICALS
OLUTIONTable 2 Result of grid independence examination for = 0.1 and different values of Re and A in both injection and suction imposed flow
Injection flow Suction flow
Re = 100 Re = 1000 Re = 100 Re = 1000
Grids max Nu max Nu max Nu max Nu
A = 1 101×101 0.279 22.821 0.280 22.778 0.299 23.907 0.306 30.096 161×161 0.282 22.497 0.282 23.092 0.300 23.615 0.307 30.451
A = 2 101×201 0.282 18.730 0.285 18.169 0.300 19.395 0.307 26.778 161×321 0.284 18.514 0.286 18.456 0.301 19.197 0.308 27.126
A = 4 101×401 0.305 14.963 0.297 18.097 0.309 15.330 0.323 23.396 161×641 0.307 14.786 0.298 18.419 0.309 15.204 0.325 23.747
difference method. The first and second derivatives of the diffusive terms were approximated by a second-order central difference scheme. Furthermore, the advection terms are handled using a second-order upwind differencing scheme to avoid possible instabilities frequently encountered in mixed convection problems. Then, an alternating direction implicit (ADI) procedure was used to perform the time integration for the Eqs. (11) and (12). At each time step, the Poisson equation, Eq. (13), was treated by using the point successive relaxation method (PSOR) with an optimum over-relaxation coefficient equal to 1.94, 1.95 and 1.96 for the grids retained in this study 101101, 101201 and 101401 respectively.
The numerical code was tested against the results of Mahmoudi et al. (2010), in the case of mixed convection flows through a copper-water nanofluid in a ventilated square cavity, by simulating the average Nusselt numbers at the lower heated wall for Ri = 1, as shown in Fig. 2. It is to note that our results were obtained by using the Maxwell-Garnett model to approximate the nanofluid effective thermal conductivity and those obtained by Mahmoudi et al. (2010) using the Patel model to estimate this conductivity. As shown in this figure, the results obtained by both models are in agreement and maximum differences within 1.35 % were observed by varying from 0 to 0.05 for Re = 50 and 100.
In addition, an overall energy balance for the system was systematically checked for all the computations. Hence, it was carefully verified that the energy released by the heating wall to the fluid is equal to that leaving the cavity through the openings within 2% as a maximum difference. The calculations were performed with a uniform grid, in both x and y direction, of 101101, 101201 and 101401 for A = 1, 2 and 4 respectively. The choice of such grids is due to the fact that they were found appropriate to model accurately flow and heat transfer in the considered geometry. The corresponding results were compared to those obtained with finer grids (Table 2) and gave maximum deviations, in terms of max and Nu, of
1.78 % / 1.50 % for the injected / sucked imposed flow.
4.
R
ESULTS ANDD
ISCUSSIONFor the present numerical study, the value of the Rayleigh number was maintained constant at Ra = 106 and the Reynolds number Re ranging from 100
to 5000. Values of these parameters induce values of the Richardson number, Ri, varying in the range [6.4510-3; 16.13] which simulates natural convection, mixed convection and forced convection dominating regimes. In the following, the study is focused on two principles cases (case 1: fixed A, case 2: varied A). The simulations are focused on the respective effects of the nanoparticle volume fraction, the regime convection, the aspect ratio and the mode flow through the cavity on dynamical and thermal flow structures and on efficient cooling.
4.1. Case 1: A = 2
a) (min = 0, max = 0.293)
a) (min = 0, max = 0.283)
b) (min = 0, max = 0.293) b) (min = 0, max = 0.291)
c) (min = 0, max = 0.287) c) (min = 0, max = 0.285)
d) (min = -0.028, max = 0.270) d) (min = -0.028, max = 0.270)
increase of Re up to 5000, as shown in Fig. 3d, leads to a flow structure characterized by open parallel straight lines joining the two openings while the left cell is divided into two others ones due to the large shear effect. Also, a clockwise convective cell, due to natural convection and shear effect, is formed on the right of the open lines. The corresponding isotherms reveal an important heat exchange between the heated wall and the open lines through the right cell, while this interaction is quasi absent between the forced flow and the left cell. The streamlines and isotherms corresponding to a solid volume fraction of the nanofluid = 0.1 are also reported to better identify the effect of the nanoparticles on the different fields presented (Figs. 3a-3d / right two columns). It can be noticed that the flow structure and the temperature distribution do not undergo a noticeable change in the presence of nanoparticles.
In the case of the suction mode, the effect of the Reynolds number on the dynamical and thermal fields is illustrated in Figs. 4a-4d, by presenting the streamlines and isotherms for = 0 and = 0.1. For Re = 100 (Fig. 4a), the streamlines show a big trigonometric cell, due to shear effect, occupying almost the left half part of the cavity and adjacent with the forced flow lines. This cell is more intense compared to the case of the injection mode (Fig. 3a). The corresponding isotherms are more tightened at the level of the heated vertical wall indicating a better convective heat transfer. Also, a big part of the cavity is at a uniform cold temperature. It is to note that this cold zone is comparable to that observed in the injection mode. By increasing Re to 500 (Fig. 4b), the streamlines show the formation of a clockwise small secondary cell in the left bottom corner and the reduction of the large cell whereas the isotherms illustrate an decrease of the cold zone in favor of the thermal boundary layer testifying of the growing effect of the mixed convection. Dynamical and thermal structures displayed in Figs. 4c-4d correspond to values of the Reynolds number of 1000 and 5000 respectively. It is seen clearly that, on the left of the curved lines, the forced convection favors the secondary cell to detriment of the big one. Moreover, the forced flow favors the formation of another clockwise cell located in the right top corner. It is to underline that even for large values of Re, the open lines of the forced convection remain curved near the hot wall. Hence, it can be deduced that the effect of the suction mode is thermally stronger and dynamically weaker when compared to the injection mode.
In order to illustrate the performance of the suction and injection modes in the heat removal, variations versus the Reynolds number of the mean Nusselt number, Nu, along the hot wall are presented in Fig. 5a for different values of . In the case of the suction mode, a monotonous increase of Nu with Re is observed with a constant rate for the considered range of Re. For the injection mode, it can be noted that the increase of Nu with Re remains very limited as long as Re < 500. Then, a slight decrease of Nu with Re is observed up to a critical value, ReCR
1500. The decrease of the mixed convection effect, occurring in the transition phase toward the forced flow regime, is attributed to the appearance of the closed cell between the entire heated wall and the open lines and consequently the delaying of heat released by the hot wall towards outside through the open lines. Beyond this critical value of Re, the tendency is reversed; the evolution of Nu is then characterized by a monotonic increase with Re resulting from an enhanced thermal interaction between the heated wall and the dominant forced flow. This singularity is absent in the suction mode because the forced flow remains completely or partially in direct contact with the hot wall what involves a continuous increase in Nu with Re. For a fixed value of Re, the increase of the solid volume fraction up to 0.1 leads to a noticeable growing effect of the convection either for injection or suction case. This is due to the increase in effective thermal conductivity of the nanofluid with the increase in . It should be noted that, in comparison with the injection mode, the suction mode enhances more the heat transfer and consequently permits a better cooling within the cavity for all values of Re, ranging from 100 to 5000, either in case of a cavity filled with pure fluid (water) or with nanofluid. Moreover, this thermal performance of the suction mode is more important in mixed convection mode (moderate values of Re).
With respect to the injection mode, the enhancement of heat transfer achieved by the suction mode is illustrated in Fig. 5b by presenting the parameter E = [(Nusuction Nuinjection) / Nuinjection]
100. Hence, the curve indicates that the heat transfer enhancement presents a maximum for a critical value of Re = 1500. Quantitatively, for = 0 and Re = 1500, passing from the injection mode to the suction one, Nu increases from 14.82 to 25.17 which corresponds to an enhancement of the heat transfer by about 70 %. For = 0.1, this enhancement turns around 59 %. For lower and higher values of Re, the heat transfer enhancement is reduced significantly and becomes limited (4 % for Re = 100 and 6 % for Re = 5000). The originality of our work relies on such an interesting result since the majority of previous works considered the injection mode to study the thermal performances of such ventilated systems.
In such problems, it is useful to pay a special attention to the evaluation of average temperature of the fluid inside the cavity. Thus, Fig. 6 displays the variations of this quantity against Re for various values of for both injection and suction modes. Particularly, in the injection case, the average temperature T decreases slightly with Re for low values of this latter because the predominance of natural convection favors the cooling of the cavity. For moderate values of Re, the mean temperature increases by increasing Re up to a critical value ranging in [1300-1600] which strongly depends on
a) (min = 0, max = 0.315) a) (min = 0, max = 0.298)
b) (min = 0, max = 0.320) b) (min = 0, max = 0.318)
c) (min = 0, max = 0.308) c) (min = -0.003, max = 0.307)
d) (min = -0.019, max = 0.290) d) (min = -0.019, max = 0.290)
the increase in the average temperature. Then, this tendency is reversed because the growing of Re is marked by a decrease of T ; this behavior is due to the forced convection predominant effect which drives out the heat towards the outside and thereafter contributes to the cooling of the cavity.
100 1000
10 15 20 25 30 35 40
Nu
Re 2000 5000
500 200
Injection
Suction
a)
0 10 20 30 40 50 60 70
100 1000
E (%)
Re
200 500 2000 5000
b)
Fig. 5. Variations, with Re, of the : a) average Nusselt number, Nu, for A = 2 and different values of in both injection and suction modes,
b) enhancement of heat transfer.
100 1000
0.04 0.06 0.08 0.10 0.12
Re
2000 5000 500
200
Injection
Suction
T
Fig. 6. Variations, with Re, of the mean temperature, T, for A = 2 and different values of
in both injection and suction modes.
For the other case (suction), the evolution of mean temperature T with Re follows a similar tendency as for the injection case with the presence of a maximum of this parameter for critical values of Re (around 1000). It is obvious from this figure that for a given value of Re, the average temperature increases when solid concentration increases, for the two modes of imposed flow, because the presence of nanoparticles leads to a good heat exchange by convection in the cavity and contributes consequently to an increase of the
average temperature. Also, it is interesting to observe that the suction mode leads to a better cooling of the cavity since the resulting values of T are lower in comparison with the injection mode. For reasons of clarity, it is noted that, for = 0.1 and Re = 1000, a reduction of about 25.87 % of T occurs when passing from the injection mode to the suction one.
4.2. Case 2: 1
A
4
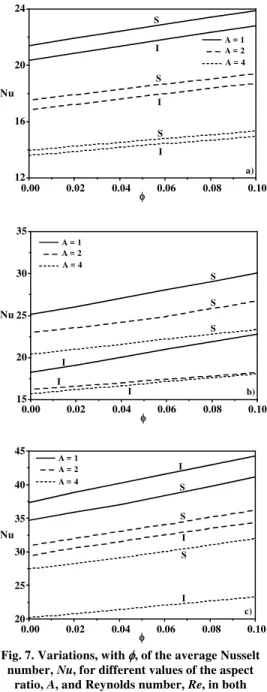
Variation of the average Nusselt number along the hot wall, Nu, with volume fraction of the nanoparticles, , using different aspect ratios, A, is presented in Figs. 7a-7c for various values of Re for both injection and suction modes. For Re = 100, Fig. 7a shows a linear increase of the average Nusselt number with for all values of A and for the two modes. Quantitatively, for the most favorable case obtained for A = 1, this enhancement of Nu turns about 11.6 % / 12 % for the suction / injection mode respectively. For a fixed value of , the increase of the aspect ratio, A, from 1 up to 4 leads to a noticeable decrease of the convection effect for either injection or suction case. It means that maximum rate of heat transfer occurs for a square enclosure while, its minimum occurs for tall enclosures. Hence, for = 0.1 and by increasing A from 1 to 4, Nu is reduced by about 35.9 % / 34.4 % for the suction / injection mode, respectively. Furthermore, it is found that the suction mode is more favorable to the heat transfer in comparison with the injection one for the all considered values of the aspect ratio A. By increasing Re to 1000, Fig. 7b shows that, qualitatively, the variation of Nu with has the same tendency as that presented in Fig. 7a. However, it is to underline that the rate of increase in Nu passing from injection mode to suction one is more pronounced for Re = 1000 in comparison with the case of Re = 100 for all values of A. This behavior explains that the mode of imposed flow affects the heat transfer dependently with Re. When the Reynolds number is increased up to Re = 5000, Fig. 7c shows that the variation of Nu with is characterized by a monotonous increase. For a fixed value of , when the cavity is elongated Nu drops. Also, the suction mode is favorable to the heat transfer with the exception of the case A = 1, for which the tendency is reversed and the injection mode becomes more favorable to the heat transfer.
5.
C
ONCLUSIONIn the present work a numerical study was carried out to examine laminar mixed convection of water-based Al2O3 nanofluids in a vented vertical cavity
nanoparticles, are more pronounced either in the injection or the suction mode. However, it is to be noted that the suction mode is more efficient than the injection mode by leading to more heat transfer across the cavity even with or without the presence of nanoparticles. Also, a better cooling of the cavity is reached with the suction mode since it involves lower values of the mean temperature in comparison with the injection mode. When varying A from 1 to 4, the enhancement of heat transfer, due to the presence of nanoparticles, is more pronounced at low aspect ratio than at high aspect ratio. A particular case occurs in A = 1 for higher value of Re where the injection mode is thermally more efficient in comparison with the suction mode.
12 16 20 24
0.00 0.02 0.04 0.06 0.08 0.10 Nu
A = 2 A = 1
A = 4
S I S
I
S
I
a)
15 20 25 30 35
0.00 0.02 0.04 0.06 0.08 0.10 Nu
A = 2 A = 1
A = 4
I
S
S
S
I
I b)
20 25 30 35 40 45
0.00 0.02 0.04 0.06 0.08 0.10 Nu
A = 2 A = 1
A = 4
S I
I S
S
I
c)
Fig. 7. Variations, with , of the average Nusselt number, Nu, for different values of the aspect
ratio, A, and Reynolds number, Re, in both injection and suction modes: a) Re = 100; b) Re =
1000 and c) Re = 5000.
R
EFERENCESAbbasian Arani, A. A., M. Mahmoodi and S. Mazrouei Sebdani (2014). On the cooling process of nanofluid in a square enclosure with linear temperature distribution on left wall. Journal of Applied Fluid Mechanics 7 (4), 591-601.
Abu-Nada, E. and A. J. Chamkha (2010). Mixed convection flow in a lid-driven inclined square enclosure filled with a nanofluid. Euro. J. Mechanics B/Fluids 29, 472-482.
Abu-Nada, E. and H. Oztop (2009). Effects of inclination angle on natural convection in enclosures filled with Cu-water nanofluid. Int. J. Heat Fluid Flow 30, 669-678.
Akbarinia, A. and A. Behzadmehr (2007). Numerical study of laminar mixed convection of a nanofluid in horizontal curved tubes. Appl. Therm. Eng. 27, 1327-1337.
Alinia, M., D. D. Ganji and M. G. Bandpy (2011). Numerical study of mixed convection in an inclined two sided lid driven cavity filled with nanofluid using two-phase mixture model. Int. Comm. Heat and Mass Transfer 38, 1428-1435.
Alloui, Z., P. Vasseur and M. Reggio (2011). Natural convection of nanofluids in a shallow cavity heated from below. Int. J. Thermal Sciences 50, 385-393.
Aminossadati, S. M. and B. Ghasemi (2009). Natural convection cooling of a localized heat source at the bottom of a nanofluid-filled enclosure. Euro. J. Mechanics B/Fluids 28, 630-640.
Aminossadati, S. M. and B. Ghasemi (2011). Natural convection of water–CuO nanofluid in a cavity with two pairs of heat source-sink. Int. Comm. Heat and Mass Transfer 38, 672-678.
Brinkman, H. C. (1952). The viscosity of concentrated suspensions and solution. J. Chem. Phys. 20, 571-581.
Eastman, J. A., S. U. S. Choi, S. Li, W. Yu and L. J. Thompson (2001). Anomalously increased effective thermal conductivities of ethylene glycol-based nanofluids containing copper nanoparticles. Appl. Phys. Lett. 78(6), 718-720.
Fazeli, S. A., S. M. H. Hashemi, H. Zirakzadeh and M. Ashjaee (2012). Experimental and numerical investigation of heat transfer in a miniature heat sink utilizing silica nanofluid. Superlattices and Microstructures 51, 247-264.
Hashemi, S. M. H., S. A. Fazeli, H. Zirakzadeh and M. Ashjaee (2012). Study of heat transfer enhancement in a nanofluid-cooled miniature heat sink. Int. Comm. Heat and Mass Transfer 39, 877-884.
Ho, C. J., W. K. Liu, Y. S. Chang and C. C. Lin (2010). Natural convection heat transfer of alumina-water nanofluid in vertical square enclosures: an experimental study. Int. J. Thermal Sciences 49, 1345-1353.
Jana, S., A. Salehi-Khojin and W. H. Zhong (2007). Enhancement of fluid thermal conductivity by the addition of single and hybrid nano-additives. Thermochimica Acta 462, 45-55.
Kahveci, K. (2010). Buoyancy driven heat transfer of nanofluids in a tilted enclosure. ASME J. Heat Transfer 132(6), 062501.
Kalteh, M., A. Abbassi, M. Saffar-Avval and J. Harting (2011). Eulerian-eulerian two-phase numerical simulation of nanofluid laminar forced convection in a microchannel. Int. J. Heat and Fluid Flow 32, 107-116.
Mahmoodi, M. (2011). Numerical simulation of free convection of nanofluid in a square cavity with an inside heater. Int. J. Thermal Sciences 50, 2161-2175.
Mahmoudi, A. H., M. Shahi and F. Talebi (2010). Effect of inlet and outlet location on the mixed convective cooling inside the ventilated cavity subjected to an external nanofluid. Int. Comm. Heat and Mass Transfer 37, 1158-1173.
Maiga, S. E. B., S. J. Palm, C. T. Nguyen, G. Roy and N. Galanis (2005). Heat transfer enhancement by using nanofluids in forced convection flows. Int. J. Heat Fluid Flow 26, 530-546.
Maxwell-Garnett, J. C. (1904). Colours in metal glasses and in metallic films. Philos. Trans. R. Soc. London, Ser. A, 203, 385-420.
Oğüt, E. B. (2009). Natural convection of water-based nanofluids in an inclined enclosure with a heat source. Int. J. Thermal Sciences 48, 2063-2073.
Patel, H. E., T. Pradeep, T. Sundararajan, A. Dasgupta, N. Dasgupta and S. K. Das (2005).
Convection model for thermal conductivity of nanofluid. Pramana-J. Phys. 65, 863-869.
Santra, A. K., S. Sen and N. Chakraborty (2009). Study of heat transfer due to laminar flow of copper-water nanofluid through two isothermally heated parallel plates. Int. J. Thermal Sciences 48, 391-400.
Shahi, M., A. H. Mahmoudi and F. Talebi (2010). Numerical study of mixed convective cooling in a square cavity ventilated and partially heated from the below utilizing nanofluid. Int. Comm. Heat and Mass Transfer 37, 201-213.
Sheikhzadeh, G. A., A. Arefmanesh, M. H. Kheirkhah and R. Abdollahi (2011). Natural convection of Cu–water nanofluid in a cavity with partially active side walls. Euro. J. Mechanics B/Fluids 30, 166-176.
Sheikhzadeh, G. A., N. Hajialigol, M. Ebrahim Qomi and A. Fattahi (2012). Laminar mixed convection of Cu-water nano-fluid in twosided lid-driven enclosures. Journal of Nanostructures 1, 44-53.
Sourtiji, E., S. F. Hosseinizadeh, M. Gorji-Bandpy and D. D. Ganji (2011). Effect of water-based Al2O3 nanofluids on heat transfer and pressure
drop in periodic mixed convection inside a square ventilated cavity. Int. Comm. Heat and Mass Transfer 38, 1125-1134.
Woods, L. C. (1954). A note on the numerical solution of fourth order differential equations. Aero. Quart 5, 176-184.
Xie, H. Q., H. Lee, W. Youn and M. Choi (2003). Nanofluids containing multiwalled carbon nanotubes and their enhanced thermal conductivities. J. Appl. Phys. 94(8), 4967-4971.
Zabihi, K., F. Gholamian and S. I. Vasefi (2013). Experimental and numerical investigation of Al2O3-water nanofluid inside a triangular tube.
World Applied Sciences Journal 22(5), 601-607.