www.biogeosciences.net/12/3607/2015/ doi:10.5194/bg-12-3607-2015
© Author(s) 2015. CC Attribution 3.0 License.
Heterotrophic prokaryote distribution along a 2300 km transect in
the North Pacific subtropical gyre during a strong La Niña
conditions: relationship between distribution and
hydrological conditions
M. Girault1, H. Arakawa2, A. Barani3, H. J. Ceccaldi3, F. Hashihama2, and G. Gregori3
1Kanagawa Academy of Science and Technology, LISE 4C-3, 3-25-13 Tonomachi Kawasaki-ku, Kawasaki-shi,
Kanagawa 210-0821, Japan
2Department of Ocean Sciences, Tokyo University of Marine Science and Technology, 5-7 Konan 4, Minato-ku,
Tokyo 108-8477, Japan
3Aix-Marseille Université, Mediterranean Institute of Oceanography MIO UM 110, Université de Toulon, CNRS/INSU, IRD,
13288, Marseille, CEDEX 09, France
Correspondence to:M. Girault (girault.bmi@gmail.com; gerald.gregori@univ-amu.fr) Received: 8 October 2014 – Published in Biogeosciences Discuss.: 14 November 2014 Revised: 1 May 2015 – Accepted: 5 May 2015 – Published: 10 June 2015
Abstract.The spatial distribution of heterotrophic prokary-otes was investigated during the Tokyo–Palau cruise in the western part of the North Pacific subtropical gyre (NPSG) along a north–south transect between 33.60 and 13.25◦N.
The cruise was conducted in three different hydrological ar-eas identified as the Kuroshio region, the subtropical gyre area and the transition zone. Two eddies were crossed along the transect: one cold-core cyclonic eddy and one warm-core anticyclonic eddy and distributions of the heterotrophic prokaryotes were recorded. By using analytical flow cy-tometry and a nucleic acid staining protocol, heterotrophic prokaryotes were discriminated into three subgroups depend-ing on their nucleic acid content (low, high and very high nu-cleic acid contents labelled LNA, HNA and VHNA, respec-tively). Statistical analyses performed on the data set showed that LNA, mainly associated with low temperature and low salinity, were dominant in all the hydrological regions. In contrast, HNA distribution seemed to be associated with tem-perature, salinity, Chlaand silicic acid. A latitudinal increase in the HNA / LNA ratio was observed along the north–south transect and was related to higher phosphate and nitrate con-centrations. However, the opposite relationship observed for the VHNA / HNA ratio suggested that the link between nu-cleic acid content and oligotrophic conditions is not linear, underlying the complexity of the biodiversity in the VHNA,
HNA and LNA subgroups. In the Kuroshio Current, it is sug-gested that the high concentration of heterotrophic prokary-otes observed at station 4 was linked to the path of the cold cyclonic eddy core. In contrast, it is thought that low con-centrations of heterotrophic prokaryotes in the warm core of the anticyclonic gyre (Sta. 9) are related to the low nu-trient concentrations measured in the seawater column. Our results showed that the high variability between the various heterotrophic prokaryote cluster abundances depend both on the mesoscale structures and the oligotrophic gradient.
1 Introduction
for different forms of inorganic nitrogen and phosphorus has been clearly demonstrated both in laboratory experiments and in the open ocean (Currie and Kalff, 1984; Vadstein, 1998; Thingstad et al., 1998). Moreover, several studies have reported that dissolved organic compounds can be an alterna-tive nutrient source for some nutrient-stressed phytoplankton (Duhamel et al., 2010; Girault et al., 2013a). The common utilization of the inorganic and/or organic matter, such as dissolved organic phosphorus, could lead to a tight coupling between the heterotrophic prokaryotes and photoautotrophs along an oligotrophic gradient. However, the relationship be-tween heterotrophic prokaryote abundance and oligotrophic conditions is unclear, especially in terms of mesoscale struc-tures such as eddies (Baltar et al., 2010; Lasternas et al., 2013). The differences within the same type of mesoscale circulation reported in the literature highlights that the re-lationship between heterotrophic prokaryotes and photoau-totrophs can be dependent on the identification of the differ-ent microorganisms making up the community (Girault et al., 2013b).
In this study, using analytical flow cytometry combined with fluorescent dyes, we were able to identify three differ-ent subgroups among the bulk of heterotrophic prokaryotes: a group characterized by a very high nucleic acid content (VHNA), another by a high nucleic acid content (HNA), and finally a group with a low nucleic acid content (LNA). Pre-vious studies have reported that the more active microorgan-isms seem to have the higher nucleic acid contents (Gasol et al., 1999; Lebaron et al., 2001). Complementary results have suggested that heterotrophic prokaryote activities are influ-enced by environmental parameters especially under olig-otrophic conditions (Zubkov et al., 2001; Grégori et al., 2001, 2003a; Nishimura et al., 2005; Sherr et al., 2006; Bouvier et al., 2007). Using the basis of these previous reports, the olig-otrophic conditions investigated in the western part of the NPSG during the Tokyo–Palau Cruise enabled us to exam-ine the relationship between different groups of heterotrophic prokaryotes, as defined by different nucleic acid contents, and their environmental conditions.
Investigations into the heterotrophic prokaryote distribu-tion in the western part of the NPSG are scarce and mostly restricted to the Kuroshio Current or the area near the Japan shelf during El Niño events (Mitbavkar et al., 2009; Kataoka et al., 2009; Kobari et al., 2011). In contrast, the Tokyo– Palau cruise was conducted during a strong La Niña condi-tion and over a large latitudinal gradient to include various seawater masses. In this work, we studied the extent to which abundance and distribution of various heterotrophic prokary-otic groups, defined by flow cytometry (VHNA, HNA, LNA) were influenced by phytoplankton distribution and envi-ronmental variables. The relationships between each het-erotrophic prokaryote group and two different mesoscale ed-dies (one anticyclonic and one cyclonic) were also examined in order to identify any modification in organism distribution
which could be related to the oligotrophic conditions found during the cruise.
2 Materials and methods
2.1 Study area and sample collection
This study was conducted from 17 January to 8 Febru-ary 2011 on board research training vesselShinyo Maru dur-ing the Tokyo–Palau cruise. Samples were collected in the western part of the NPSG between 33.60 and 13.25◦N along
the 141.5◦E transect (Fig. 1). Twelve stations (Sta.) were
sampled using 2.5 L Niskin bottles mounted on a rosette frame equipped with the Conductivity–Temperature–Depth (CTD) and in situ fluorometer system. Seawater was sampled without replicates at several depths between the surface and 200 m. Due to bad weather conditions, the seawater samples between Stations 1 and 4 were collected only at the surface (3 m) using a single Niskin bottle. At these 4 stations, Ex-pendable Conductivity/Temperature/Depth profiling systems (XCTD) were used to measure temperature and salinity. The Brunt-Väisäla buoyancy frequency (N2) was calculated us-ing the exact thermodynamic expression reported by Kus-ing et al. (2012) (Eq. 1).
N2=g2 dρ
dp− 1 cs2
, (1)
where dρ
dp is the vertical gradient of in situ density (ρ). The acceleration (g) due to the gravity was assumed to be con-stant during the Tokyo–Palau cruise (g=9.81) and the speed of sound (cs)was calculated depending on the depth, salinity,
and temperature according to Del Grosso (1974). The mixed layer depths were estimated as the depths at which the max-imum stratification occurred (i.e. a maxmax-imum of N2at each station). The irradiance was monitored at five stations (5, 7, 9, 11, 12) using a Profiling Reflectance Radiometer (PRR 600 Biospherical Instrument®). The depth of the euphotic layer was estimated as the depth of 1 % of photosynthetically ac-tive radiation at noon.
Figure 1.Map of the sea level anomaly (cm) in the west part of the North Pacific subtropical gyre. The sampling stations (black crosses) were separated depending on temperature and salinity into 3 areas: Kuroshio region (Stations 1–4), subtropical gyre (Sta-tions 5–8) and the transition zone (Sta(Sta-tions 9–12).
2.3 Nutrient analyses
Nutrient samples were collected from Niskin bottles, imme-diately put into cleaned plastic tubes in the dark, plunged into liquid nitrogen and stored in the deep freezer (−60◦C) un-til analyses. The highly sensitive colorimetric method incor-porating the AutoAnalyzer II (SEAL Analytical) and Liq-uid WavegLiq-uide Capillarity Cells (World precision Instru-ments), was used to determine nutrient concentrations (ni-trate+nitrite, soluble reactive phosphorus and silicic acid) according to the methods listed in Hashihama et al. (2009) and Hashihama and Kanda (2010). Seawater collected at the surface of the western part of NPSG, which had been pre-served for > 1 year, was used as nitrate+nitrite blank water. The blank water was analyzed using the chemiluminescent method described in Garside (1982). The detection limits for nitrate+nitrite, soluble reactive phosphorus and silicic acid were 3, 3 and 11 nM, respectively. Because soluble reac-tive phosphorus consists mainly of orthophosphate and nitrite
was not substantially detectable, soluble reactive phosphorus and nitrate+nitrite are hereafter referred to as phosphate and nitrate.
The nutrient fluxes into the surface mixed layer were cal-culated using the equationKdNutdz whereKis the local ver-tical diffusivity, Nut is the concentration in nutrients (phos-phates, nitrates or silicic acid) and dNutdz the vertical nutri-ent gradinutri-ent. To compensate for irregular sampling depths among the stations, the nutrient profiles were linearly inter-polated onto the 1 m grid. Then, vertical nutrient gradients were calculated between sequential depth bins (Painter et al., 2013). This method has the advantage of showing the nutri-ent flux from a particular part of the water column. Due to the lack of an Acoustic Doppler Current Profiler (ADCP) on the ship, the local vertical diffusivity (K) was estimated us-ing the literature (Table 1). Among theKvalues reported in the oligotrophic conditions, a vertical diffusion coefficient of 0.5 cm2s−1was chosen as a standard value (Table 1).
2.4 Chlorophyllaand flow cytometry analyses
The depth of the deep chlorophyll a maximum was deter-mined from fluorescence profiles using the pre-calibrated in situ fluorometer. To measure chlorophyll a concentration, 250 cm3of seawater was filtrated through Whatman® nucle-opore filters (porosity∼0.2 µm) using a low vacuum pres-sure (< 100 mm of Hg). Filters were then immersed into tubes containing N,N-dimethylformamide (DMF) and stored in the dark at 4◦C until analyses on shore. Chlorophyllawas
anal-ysed using a Turner Designs fluorometer pre-calibrated with pure Chlapigment (Suzuki and Ishimaru, 1990).
Samples for heterotrophic prokaryotes were collected from the Niskin bottles and pre-filtered onto disposable 100 µm porosity nylon filters to prevent clogging of any in the flow cytometer. Seawater aliquots of 1.8 cm3 were fixed with 2 % (w/v final dilution) formaldehyde solution, quickly frozen in liquid nitrogen and stored in the deep freezer onboard (−60◦C) until analysis at the flow cytom-etry core facility PRECYM of the Mediterranean Institute of Oceanology (http://precym.mio.osupytheas.fr). In the PRE-CYM, samples were thawed at room temperature and stained using SYBR Green II (Molecular Probes®) methods detailed
in Marie et al. (1999), Lebaron et al. (1998) and modified by Grégori et al. (2003b). The analyses were performed on a FACSCalibur flow cytometer (BD Biosciences®) equipped
run-Table 1.Literature estimates of vertical turbulent diffusivity rates obtained using different methods in the oligotrophic condition. NA indicates information not mentioned.
Domain Location Depth (m) Diffusivity (cm2s−1) Reference
North Pacific subtropical gyre
22◦N–158◦W 35–44◦
N, 150–170◦ W 10–40◦N
22◦N–158◦W
300–500 NA 0–1000
Euphotic
0.1–0.5 0.2–0.4 0.3 1–2
Christian et al. (1997) White and Berstein (1981) Van Scoy and Kelley (1996) Emerson et al. (1995) Pacific Ocean 20◦S–20◦N
20–60◦N
125 100
0.5 1.8
Li et al. (1984) Li et al. (1984) Tropical North
Pacific Ocean
5–10◦N, 90◦E
10–15◦N, 85◦E NANA 0.05–0.160.44–1.10 King and Devol (1979)King and Devol (1979) Subtropical North
Atlantic
25◦N, 28◦W 28.5◦N, 23◦W 31◦N, 66◦W
300 100–400 < 100
0.12–0.17 0.37 0.35
Ledwell et al. (1998) Lewis et al. (1986) Ledwell et al. (2008)
Figure 2.Vertical profiles of the Brunt-Väisäla buoyancy frequency (N2) calculated from the temperature–salinity measurements. The white circles display the thermocline depth and the black triangles display the depths of 1 % of photosynthetically active radiation (limit of the euphotic zone).
time of the flow cytometer was 2 min and the flow rate set to 50 µL min−1 (corresponding to the “Med” flow rate of the flow cytometer). Trucount™calibration beads (Becton Dick-inson Biosciences) were also added to the samples just prior to analysis as an internal standard to monitor the instrument stability and accurately determine the volume analyzed. Fol-lowing the staining of the nucleic acid with SYBR Green II, heterotrophic prokaryotes, excited at 488 nm, were recorded and enumerated according to their right angle light scatter intensity (SSC) which relates to the cell size and their green fluorescence intensity (515–545 nm) which relates to the nu-cleic acid content. As already widely described in the lit-erature, several heterotrophic prokaryote groups can be op-tically resolved by flow cytometry depending on their av-erage green fluorescence intensities related to their nucleic acid content: in this study, a group of cells with a lower green fluorescence corresponding to heterotrophic prokary-otes with a lower nucleic acid content (LNA), a group of cells displaying a higher green fluorescence corresponding to a higher nucleic acid content (HNA) and a last group of cells with the highest green fluorescence intensity corre-sponding to the highest nucleic acid content (VHNA) (Sup-plement Fig. S1). The overlap between the stained
phyto-plankton, in particularProchlorococcusandSynechococcus, and the heterotrophic prokaryotes (in terms of green fluo-rescence and side scatter intensity) was resolved by using red fluorescence (induced by the chlorophyll) to discriminate and identify the photoautotrophs (Sieracki et al., 1995). The heterotrophic prokaryote abundances were also expressed for each cluster (LNA, HNA and VHNA) in terms of carbon biomass using a conversion factor of 15 fg C cell−1 (Caron
et al., 1995). The carbon biomass was integrated between the surface and the 200 m depth in order to better charac-terise the upper water column. Although this study focuses on the distribution of the heterotrophic prokaryotes, ultra-phytoplankton was also investigated during the Tokyo–Palau project. Briefly, the ultraphytoplankton was sampled thanks to Niskin bottles and filtrated through a 100 µm mesh size. 4.5 cm−3of subsamples preserved with 0.5 cm−3of a 20 %
formaldehyde solution (i.e., 2 % final concentration) were put into 5 cm−3Cryovials tubes. Similar to the heterotrophic
was discriminated in this study into five flow cytometry clus-ters (Synechococcus,Prochlorococcus, Picoeukaryotes, Na-noeukaryotes and Nanocyanobacteria-like) as described in Girault et al. (2013b).
2.5 Statistical analysis
To analyse the multivariate data set, principal component analyses (PCA) and redundancy analysis (RDA) were per-formed using the R software (vegan package) and the Biplot macro for Excel® (Lipkovich and Smith, 2002). PCA was performed in order to qualitatively identify the relationships between heterotrophic prokaryotes and the environmental variables (Pearson, 1901). Possible links between each het-erotrophic prokaryote subgroup and their environmental vari-ables were quantitatively examined using the RDA. For the RDA, the data set was log10 (x+1)-transformed to correct for the large differences in scale among the original variables. A Monte Carlo test was used in order to test the significance of the RDA results. Partial RDAs were also carried out to evaluate the effects of each explanatory variable set on the heterotrophic prokaryote composition (Liu, 1997). The first RDA was performed on the whole data set by taking into account the heterotrophic prokaryotes as one single group. Additional partial RDAs were performed for each subgroup (LNA, HNA, and VHNA). The environmental variables in the additional partial RDAs were classified into three inter-correlated variable groups, namely: the depth-related param-eters (phosphate, nitrate, depth), spatial-related paramparam-eters (temperature and salinity) and the phytoplankton-related pa-rameters (Chl a and silicic acid). This decision was made considering the results of the PCA (environmental variables were separated into three groups).
3 Results
3.1 Sampling sites and ultraphytoplankton distribution The cruise took place along a north–south transect in the western part of the NPSG (141.5◦E) during a strong La Niña
climatic event. According to the temperature–salinity dia-gram presented in the study made by Girault et al. (2013b), three main areas corresponding to the Kuroshio region (Sta. 1–4), the subtropical gyre (Sta. 5–8) and the transi-tion zone (Sta. 9–12) were discriminated (Fig. 1). Separa-tion between the transiSepara-tion zone and the subtropical gyre was made using the salinity front observed south of sta-tion 8. The discriminasta-tion between the Kuroshio area and the subtropical gyre seawater masses was confirmed by com-paring the Tokyo–Palau data set and the studies of Sekine and Miyamoto (2002) and Kitajima et al. (2009). The cruise crossed two main eddies identified in this study as a cold-core cyclonic eddy (C), and a warm-core anticyclonic eddy (A) (Fig. 1). Eddy C (31◦N, 141◦E) is located in the Kuroshio
region and eddy A (20.5◦N, 142◦E) in the transition zone.
Thanks to the satellite data and daily surface currents of the bulletin of the Japanese coast guard, the creation of the cold-core structure was explained by the instability in the mean-der of the Kuroshio Current between 9 and 12 July 2010. The cold core was continuously reported all along the cruise. The distribution of the ultraphytoplankton assemblages ob-served during the Tokyo–Palau cruise was reported in detail in the study of Girault et al. (2013b). Briefly, ultraphyto-plankton was characterized by a heterogeneous distribution of its phytoplankton groups associated with the complex dis-tribution of the various seawater masses met during the cruise (including salinity front, subtropical countercurrent, eddies). Among the phytoplankton communitiesProchlorococcus
nu-merically dominated the ultraphytoplankton assemblages in the samples collected in the stratified oligotrophic areas such as the subtropical gyre area and the transition zone. Pi-coeukaryotes, Nanoeukaryotes andSynechococcusalso con-stituted a significant part of the carbon biomass in the region depleted in phosphate and nitrate. The role of the cold-core eddy C was reported at the surface where the highest concen-tration of Nanoeukaryotes in the surface sample was found in the very core of the cyclonic eddy (Sta. 3) and where, theSynechococcusoutnumbered theProchlorococcus abun-dance in the path of the cold-core cyclonic eddy (Sta. 4). The Nanocynaobacteria-like group was reported to be controlled by the frontal system observed at station 9 rather than the concentration of inorganic nutrients.
3.2 Stratification of seawater masses and vertical nutrient fluxes
The Brunt-Väisäla buoyancy frequencies calculated from the CTD data set are characterized by low N2 values
(< 2×10⁻⁴s−2)from the surface down to the 90 m depth (Fig. 2). Below this depth, the vertical distribution of N2was more irregular and reached the maximum 1.09×10⁻³s−2at station 11 (90 m). Figure 2 also shows that the depth of the N2maximum (thermocline depth) tended to be shallower in the southernmost part of the transect (Sta. 11, 85 m to Sta. 11, 90 m) underlying the strengthening of the upper thermocline when the heat flux at the surface is positive and wind mixing is low in the south part of the transect. Along the latitudi-nal transect, two particular values of the thermocline depths were found at station 3 (145 m) and at station 9 (140 m) cor-responding to the cyclonic and anticyclonic eddies, respec-tively. Moreover, excepted at stations 3 and 9, the first in-creases of N2(> 2×10⁻⁴s−2)from the surface to the 200 m
between the euphotic layer and the thermocline depths was 34±11 m.
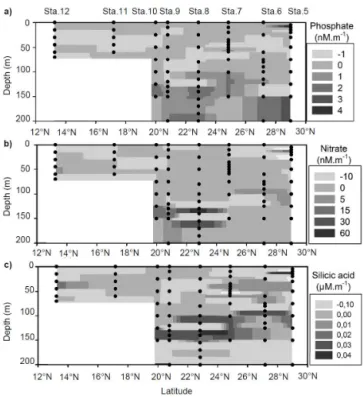
Figure 3 shows the vertical gradient of nutrients (phos-phates, nitrates and silicic acid). The vertical phosphate pro-files were characterized by a very low gradient (< 1 nM m−1)
in the upper 100 m from Stations 6 to 12. Both positive and negative gradients were observed and no specific distribution between them was found. Under the depth of 100 m, higher phosphate gradients (> 3 nM m−1)were found and defined
the phosphacline depths as displayed in Fig. 4 of the study made by Girault et al. (2013b). Nitrates showed that verti-cal profiles closely corresponded to phosphates with nega-tive or posinega-tive values lower than 5 nM m−1and higher
gra-dient below 100 m. The vertical distribution of the silicic acid gradient was more complex and moderate gradients ranging from 0.01 to 0.02 µM m−1were observed in the upper 100 m
depth at stations 5, 6, 7, and 12. Similar to phosphates and nitrates, the highest gradients of silicic acid (0.04 µM m−1)
were found below a 100 m depth from stations 6 to 10. Tak-ing into account all the panels of Fig. 3, station 8 showed a particular pattern between 100 and 160 m depths where two superimposed high gradients were observed. The depths of these high gradients were found to be similar for phos-phates and silicic acid (100–115 and 130–155 m) but the vertical profile of nitrates gradient showed a slightly lower depth (130–140 and 155–170 m). By using a vertical diffu-sion coefficient of 0.5 cm2s−1, the nutrient fluxes were
cal-culated from stations 5 to 11 (Table 2). Phosphate fluxes into the surface mixed layer were negative at Stations 5 and 6 (−0.52 and−1.34 µmol m−2d−1, respectively) and positive from stations 7 to 11. The positive phosphate fluxes were maximum at station 7 (9.43 µmol m−2d−1) and decreased
to reach 1.38 µmol m−2d−1 at station 11. The percentages
of diffuse flux per day relative to the standing stock in the mixed layer were particularly low and varied from −0.03 (Sta. 6) to 0.76 % (Sta. 8). Nitrate fluxes into the mixed layer were positive and highly variable along the transect (∼0 to 81.3 µmol m−2d−1). The percentage of daily diffuse supply
relative to the pool reflects this result and varied from ∼0 (Sta. 7 and 10) to 432 % (Sta. 8). The silicic acid fluxes were globally higher than the phosphate and nitrate fluxes calcu-lated in the mixed layer (up to 571.1 µmol m−2d−1; Sta. 9).
The daily diffuse supply relative to the mixed layer pool was low and spread from 0.002 (Sta. 5) to 0.48 % (Sta. 9).
3.3 Distribution of the heterotrophic prokaryotes After staining with the SYBR green II fluorescent dye, three clusters of heterotrophic prokaryotes were character-ized by their different green fluorescence mean intensi-ties (Fig. S1). In the surface samples of the Kuroshio re-gion the average concentrations of LNA, HNA and VHNA were 8.71×10⁵±3.8×10⁵, 3.27×10⁵±1.4×10⁵ and 2.64×10⁵±1.2×10⁵cells cm−3, respectively. In the sub-tropical area the average concentrations of LNA, HNA and
Figure 3. Vertical nutrient gradient (dNutrient / dz) of Phos-phate(a), Nitrate(b)and Silicic acid(c), between stations 5 and 12. The black dots display the sample depths and the names of the stations are indicated in the upper axes.
VHNA were 6.01×10⁵±1.2×10⁵, 2.97×10⁵±1.4×10⁵ and 1.84×10⁵±6.4×10⁴cells cm−3, respectively. In the transition zone the average concentrations of LNA, HNA and VHNA were 5.18×10⁵±1.8×10⁵, 4.38×10⁵±1.6×10⁵ and 1.15×10⁵±6.2×10⁵cells cm−3, respectively (Fig. S2). Despite the high variability between the concentrations along the north-south transect, the distribution of the three het-erotrophic prokaryote groups was characterized by a com-mon maximum at station 4 and a minimum at station 9. At station 4 the concentrations of LNA, HNA and VHNA were 1.39×10⁶, 5.03×10⁵ and 4.35×10⁵cells cm−3, re-spectively. In contrast, the concentrations of LNA, HNA and VHNA at station 9 were 2.07×10⁵, 1.6×10⁵ and 5.07×10⁴cells cm−3, respectively. To a lesser extent, high concentrations of LNA (9.13×10⁵cells cm−3) and HNA (3.62×10⁵cells cm−3)were identified at the northernmost station of the Kuroshio region at station 1.
Table 2.Phosphate, nitrate and silicic acid diffusive fluxes into the surface mixed layer and the importance of supply term relative to the standing pool size.
Station Latitude Mixed layer Phosphate flux Daily diffusive Nitrate flux Daily diffusive supply Silicic acid flux Daily diffusive supply depth (m) (µmol m−2d−1) supply relative to pool (%) (µmol m−2d−1) relative to pool (%) (µmol m−2d−1) relative to pool (%)
5 28.98 141 −0.52 −0.01 3.63 0.01 2.25 0.002
6 27.16 136 −1.34 −0.03 12.88 0.04 54.09 0.03
7 24.83 109 9.43 0.69 0 0 142.21 0.21
8 22.83 101 7.78 0.76 81.3 432 351.36 0.39
9 20.78 140 6.48 0.68 13.91 5.7 571.1 0.48
10 19.98 95 1.38 0.16 0 0 0.006 0.01
Figure 4.Vertical concentration (cells cm−3)of LNA, HNA, and VHNA heterotrophic prokaryotes interpolated along the transect during the Tokyo–Palau Cruise. The black dots are the depths sam-pled.
numerically dominated the other clusters from stations 5 to 12 (Fig. S3). The latitudinal contribution of the LNA clus-ter to the total heclus-terotrophic prokaryotes in clus-terms of carbon biomass varied from 47 % (Sta. 9) to 63 % (Sta. 6). Contri-bution of the HNA cluster is characterized by a low percent-age at stations 5 and 6 (22 and 16 %, respectively) and a near constant contribution between station 7 and the southernmost station 12 (33±2 %;n=6). The contribution of the VHNA cluster was nearly constant from stations 5 to 9 (19±2 %; n=5). Then, it reached the lower values in the transition zone (14 % at Sta. 10, 5 % at Sta. 11, and 12 % at Sta. 12).
Figure 5a displays the ratios of HNA / LNA concentration depending on depth. In the Kuroshio region, ratios are low and varied from 0.29 (Sta. 2) to 0.44 (Sta. 3). In the subtrop-ical gyre area, the ratios varied from 0.16 (Sta. 5, 70 m) to
Figure 5. Ratios of the abundances between the heterotrophic prokaryote clusters according to depth.(a)shows the ratio of the abundances of HNA / LNA clusters while (b) shows the ratio of abundances of VHNA / HNA clusters. The white circles are sta-tions 1, 2, 3, and 4. The white triangles and the squares are stasta-tions 5 and 6, respectively. The grey circles, triangles, and squares charac-terize stations 7, 8 and 9, respectively. The black squares, circles and triangles are stations 10, 11, and 12, respectively.
Table 3.List of observations from Stations 1 to 11 and their classification into six clusters according to the principal component analysis (PCA).
PCA Cluster Observations Latitude (◦N) Station Depth (m)
1 1 33.6 1 0
1 2 33 2 0
1 3 31.6 3 0
1 4 31 4 0
2 5,6,7,8,9,10,11,12,13 28.6 5 0,40,60,70,78,80,100,120,140 2 15,16,17,18,19,20,21,22,23 27.1 6 0,25,60,75,80,90,100,115,125
2 32,33,34 24.5 7 75,90,101
2 40,41 22.5 8 110,125
2 55 20.5 9 200
3 14 28.6 5 160
3 24 27.1 6 150
3 42,43,44 22.5 8 135,150,165
3 54 20.5 9 160
3 61 19.6 10 125
4 25,26,27,28,29,30,31 24.5 7 0,10,25,40,58,59,60
4 35,36,37,38,39 22.5 8 0,25,50,75,95
5 45,46,47,48,49,50,51,52,53 20.78 9 0,25,50,75,100,120,130,140
5 59,60,62 19.6 10 75,100,150
6 56,57,58 19.6 10 0,25,50
6 63,64,65,66 17.2 11 0,30,45,60
100 m. Figure 5b shows the ratio of VHNA / HNA concen-trations depending on depth. In the Kuroshio region the ratio varied from 0.53 (Sta. 3) to 1.46 (Sta. 2). In the subtropical gyre area, the ratio varied from 0.10 (Sta. 7, 58 m) to 1.93 (Sta. 9, 175 m). In the transition zone the ratio varied from 0.10 (Sta. 12, 70 m) to 1.47 (Sta. 12, 180 m). The average of the VHNA / HNA ratio (0.37±0.35) in the transition zone was the lowest of the three sampled regions (0.78±0.44 in the subtropical gyre; 0.88±0.41 in the Kuroshio region).
3.4 Statistical analysis
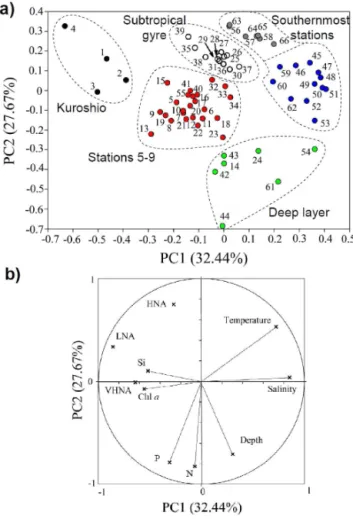
Results of the Principal Component Analysis (PCA) and the Redundance Analysis (RDA) are shown in Figs. 6 and 7, re-spectively. The correlation circle of the PCA displays the first two principal components (PC1 and PC2) which accounted for 32.44 and 27.67 % of the total inertia, respectively. The third and fourth principal components are not shown due to the low inertia exhibited (11 and 8 % of the total inertia, re-spectively) and the lack of any clear ecological understand-ing. Silicic acid, Chla, VHNA and LNA were differentiated from temperature and salinity by PC1, while PC2 mainly differentiated depth, nitrate, and phosphate (negative coordi-nates) from the HNA clusters (positive coordinate). Using hi-erarchical classification the sampling depths were separated into six different clusters (Table 3 and Fig. 6). Cluster 1 char-acterized all the stations located in the Kuroshio region. Clus-ter 2 corresponded to samples collected at the edge of the subtropical gyre and contains the deepest sample collected at station 9 (200 m), the station in the anticyclone eddy in the
transition zone. Samples in cluster 3 were collected below a depth of 125 m where nitrate and phosphate concentrations were higher than for surface samples. This cluster was de-fined as the deep layer group. Cluster 4 samples were col-lected in the centre of the subtropical gyre (Stations 7 and 8), where heterotrophic prokaryote concentrations were at their maximum in the seawater column. Cluster 5 represented the samples collected in the anticyclonic eddy where a marked salinity has been reported (Girault et al., 2013b). Located in the transition zone, at the southernmost stations the sixth and last cluster group was characterized by the highest salinity and temperature values. This last cluster (blue dots in Fig. 6a) is distinguished from the deep layer group (cluster 3, green dots) by the low nutrient concentrations measured in the up-per layer.
clus-Figure 6.Hierarchical clustering illustrated for the first two princi-pal components of the principrinci-pal component analysis performed with the data collected from stations 1 to 11(a). According to the clas-sification (Table 1) the sampling depths (numbers) were discrimi-nated into 6 clusters: one characterizes the Kuroshio region (clus-ter 1, black), another incorporates stations 5 to 9 (clus(clus-ter 2, red), a third one the deep layer (cluster 3, green) and the last three clusters characterize the subtropical gyre (cluster 4, white) and the southern-most stations (5, blue and 6, dark grey). The circle(b)shows the first two dimensions of the principal component analysis. The environ-mental variables taken into consideration are temperature, salinity, depth, nitrate (N), phosphate (P), silicic acid (Si), and chlorophylla
(Chla).
ter. RDA suggested two main correlations between the LNA cluster and the phytoplankton-related variables (Chl a and silicic acid) and the HNA cluster with the depth-related vari-ables (nutrients such as nitrate and phosphate and depth).
To confirm and quantify these possible correlations, four partial RDAs were also performed: one partial RDA using all the heterotrophic prokaryotes at once and one additional par-tial RDA for each heterotrophic prokaryote subgroup (LNA, HNA and VHNA). Results of the partial RDA performed on all the heterotrophic prokaryotes showed that among the six environmental variables measured during the cruise, salinity and temperature statistically contribute for 24 and 7.5 % of
Figure 7.Correlation plot of the redundancy analysis (RDA) on the relationships between the environmental variables and the three subgroups of heterotrophic prokaryotes observed during the cruise (LNA, HNA, VHNA). Chla, N, P, and Si stand for chlorophylla, nitrate, phosphate, and silicic acid, respectively.
the variation of the heterotrophic prokaryotes, respectively. To a lesser extent, phosphate alone explained 3.5 % of the variability, whereas Chla, nitrate, depth and silicic acid ex-plained only 1.8, 1.7, 1.7 and 0.86 %, respectively. The par-tial RDAs performed either on LNA, or HNA, or VHNA indicated that environmental parameters can explain 60, 55 and 27 % of the total variance, respectively (Table 4). Par-tial RDA results showed that the spaPar-tial related parameters alone can explain up to 31 % of the variation in the het-erotrophic prokaryote distribution. The depth-related param-eters explained between 6 and 8 % of the variance and fi-nally the phytoplankton-related group explained a maximum 4 % of the variance in the LNA heterotrophic prokaryotes. As far as the HNA cluster is concerned, the joint variation of the spatial- and phytoplankton-related parameters explained 22 % of the variance.
4 Discussion
Table 4.Partial redundancy analysis performed on each heterotrophic prokaryote cluster optically resolved by flow cytometry: low nucleic acid content (LNA), high nucleic acid content (HNA) and very high nucleic acid content (VHNA). According to the PCA results, Chlaand silicic acid are the phytoplankton-related variables. Temperature and salinity are the spatial-related variables. Nitrate, phosphate and depth are the depth-related variables. Negative values characterized the lack of any correlation between heterotrophic prokaryote clusters and the variables tested.
LNA HNA VHNA
Total explained variance 60 % 55 % 27 %
Joint variation Phytoplankton-related and spatial- and depth-related 6 % −1% −1%
Partial joint variation
Spatial-related and phytoplankton-related −1 % 22 % −4 %
Spatial- and depth-related 9 % 1 % 5 %
Depth-related and phytoplankton-related 3% 1% 0%
Unique variation
Phytoplankton-related 4 % 1 % 1 %
Depth-related 8 % 8 % 6 %
Spatial-related 31 % 23 % 20 %
the latitude (Fig. 5). As a latitudinal partition of the ultra-phytoplankton assemblages was also reported in the same region as described in the study of Girault et al. (2013b), heterotrophic prokaryotes-phytoplankton interactions are ex-pected, as already observed in some oligotrophic conditions (Gasol and Duarte, 2000; Gomes et al., 2015). However, “pure” phytoplankton-related parameters such as a bottom-up control of the VHNA, HNA, and LNA distributions only accounted for a small fraction (1–4 %) of the explained vari-ations and significantly differed from some previous exper-iments conducted in oligotrophic conditions (Sherr et al., 2006; Bouvier et al., 2007; Van Wambeke et al., 2011). The lack of important correlation between such phytoplankton-related parameters and heterotrophic prokaryotes should be nuanced by the high percentage (22 %) of the partial joint variation (spatial- and phytoplankton-related parameters) found for the HNA cluster. It highlighted that phytoplankton-related variables were less important for VHNA and LNA than HNA. This variability may indicate that the species in the HNA cluster better interacted with the phytoplankton than those in the LNA or VHNA clusters. This is in agree-ment with a study of Gasol et al. (1999). This interaction can be reinforced by the predominant role of the temperature, confirmed by the statistical analysis. Indeed, temperature is known to control the activity of heterotrophic prokaryotes in the NPSG (White et al., 2012). Consequently, the partial RDA evidenced and quantified that: (i) the LNA distribution is mainly explained by temperature and salinity and (ii) HNA distribution is mainly explained by an association of vari-ables (temperature, salinity, Chl a, and silicic acid) rather than a single environmental factor.
The choice of the association of Chla and silicic acid in the phytoplankton-related cluster was motivated by the PCA and RDA results. Considering the Chla concentration as a proxy of phytoplankton biomass, evidences of local Si de-pletion associated with blooms of diatoms was reported in
the Kuroshio Current area (Hashihama et al., 2014). This study also pointed out that large phytoplankton can be in part controlled by the availability of the silicic acid in this very region. However, the effect of silicic acid on phytoplankton over a larger scale was unexpected, such as the lowest con-centrations of phosphate and nitrate reported in the euphotic layer of the western part of the NPSG area (Hashihama et al., 2009, 2014; Girault et al., 2013b). Moreover, Si : N : P stoi-chiometry identified nitrogen and/or phosphorus to be poten-tial limiting factors during the Tokyo–Palau cruise. As far as the smaller phytoplankton sizes are concerned, the nature and the importance of silicic acid uptakes are still controversial. It is the case in this cruise especially when low concentra-tions of large silicified organisms were measured. However, a high efficient uptake of silicic acid in the NPSG explained by a regeneration mechanism initiated from the marine bac-terial assemblages and/or Si-bioaccumulation in some strains ofSynechococcuscould in part explain the statistical associ-ation of Chla-Silicic acid as found in this study and already described in the literature (Bidle and Azam, 1999; Baines et al., 2012; Krause et al., 2012).
4.2 Nutrient fluxes and their biological relevance in a stratified system
Al-though the partial RDA showed that the “pure” depth-related variables poorly explained the total heterotrophic prokary-otes variance (6–8 %), the sum of their joint effect can ex-plain more than 26 % of the total variation in the LNA dis-tribution, underlying the differences in nutrient utilisation and requirements at the subgroup levels. From the perspec-tive of nutrients these results also suggested that LNA clus-ter was less abundant than HNA under low phosphate and nitrate conditions (Fig. 4). This is in contrast with the hy-pothesis proposed for severely P-limited environments which suggests that inorganic phosphorus can exert more severe physiological constraints on the growth of HNA than LNA (Nishimura et al., 2005; Wang et al., 2007). However, it is important to note that both LNA and HNA clusters are likely to include different strains of microorganisms includ-ing species adapted to the warm, which have been shown to have lower minimal P cell quotas (Hall et al., 2008). The link between these warm-adapted species and the cell nu-cleic acid content is however still unclear and depends on the type of environment (Andrade et al., 2007; Van Wanbeke et al., 2011). According to Andrade et al. (2007), the varia-tion in the HNA / LNA ratio observed suggests that low nu-trient conditions favoured HNA cells over LNA cells. This result along with the statistical analysis performed in this study may suggest that HNA species are more warm-adapted than LNA in the subtropical gyre and transition zone. De-crease of the VHNA / HNA ratio also suggests that the nu-merically dominant species with high nucleic acid content (HNA) might be more warm-adapted than the cells with the highest nucleic acid content (VHNA). These contrasting re-sults highlight the complex and non linear link between the cell nucleic acid contents and the various ecological mean-ings as reported in Bouvier et al. (2007) and Van Wanbeke et al. (2009).
As the PCA and RDA analyses did not integrate the nu-trient supplies from the mixed layer, a theoretical estimation of the nutrient inputs was calculated using the Brunt-Väisäla buoyancy frequencies (Tables 1 and 2). The results obtained should obviously be taken with caution, especially for ni-trates due to the importance of diazotrophy and to episodic dust deposition not negligible in the NPSG (Wilson, 2003; Kitajima et al., 2009; Maki et al., 2011). Moreover, the oscil-lation of positive and negative values in phosphate-depleted conditions also pointed out the approximation linked to the limit of detection of the phosphate concentration (3 nM) in the oligotrophic upper layer. At the cruise scale, the compar-ison between phosphate or silicic acid fluxes and the mixed layer integrated concentration of nutrients suggested that the daily diffuse fluxes were of minor importance to resupply nutrients to the surface. Both phosphate, nitrogen and sili-cic acid diffuse fluxes were in the range of values reported in oligotrophic conditions (Gasol et al., 2009; Painter et al., 2014). This result emphasizes the important role of the mi-crobial loop to sustain the growth of organisms in the western part of the NPSG. At the local scale (Sta. 8), signature of the
subtropical counter current (STCC) was also evidenced by the nutrient fluxes despite no noticeable pattern of observed buoyancy frequency. Due to the various locations of high gra-dients, utilisation of nutrients was not uniform and indicated that nitrate from the bottom layer could support the growth in the vicinity of the STCC layer. The vertical nitrate input appeared to be important because the association of nitra-cline with thermonitra-cline mathematically maximized the daily flux related to the standing pool. Although, Fig. 4 did not evidence particular distribution of heterotrophic prokaryotes close to the STCC layer, integrated heterotrophic prokaryote abundance and carbon biomass of HNA in the subtropical gyre area were maximum at station 8 (Fig. S3). This result is also observed for the ultraphytoplankton distribution where high concentrations were found at this very station (Girault et al., 2013b). In contrast to the low nutrient fluxes observed at the cruise scale, relationships between the STCC and mi-crobial food web via the nutrients fluxes appeared to be an important mechanism to sustain the ecosystem in the very subtropical pacific gyre area.
4.3 Distribution of heterotrophic prokaryotes and eddies
been purposed to explain the variability in microorganisms as demonstrated by Nencioli et al. (2008). This scenario did match well with the Tokyo–Palau data set, where the cold core of the cyclonic eddy moved to the north-west between December and the sampling time of the cruise. The path of the cold core cyclonic eddy could explain the possible de-crease in the nutrient uptake from the bottom layer at sta-tion 4 and lead to an oligotrophic system dominated by re-generation processes. The high abundance of heterotrophic prokaryotes measured at the edge of the cyclonic eddy could be explained by the high activity in the microbial loop. This activity can be in part enhanced by a more efficient verti-cal exchange of seawater masses at the periphery rather than at the centre of the eddy (Stapleton et al., 2002; Klein and Lapeyre, 2009). Similarly, the numerical dominance of Syne-chococcus, observed only once in the surface samples during the cruise, may be the result of the change in trophic condi-tions (Girault et al., 2013b).
In contrast to the frontal structures reported in the lit-erature (Arístegui and Montero, 2005; Baltar et al., 2009; Lasternas et al., 2013), the second eddy (A) located between the subtropical gyre and the transition zone was characterized by the lowest concentrations of heterotrophic prokaryotes found during the cruise. These low concentrations were no-ticeable for all the clusters (LNA, HNA and VHNA) and sug-gested that the anticyclonic eddy did not enhance nor limit one particular heterotrophic prokaryote cluster between the surface and the bottom of the thermocline (Fig. 4). The high increase in VHNA and LNA compared to HNA, below the thermocline were uncommon in the meso- and bathypelagic zones of oligotrophic areas where the concentration of HNA and LNA decreased significantly with depth (Van Wambeke et al., 2011; Yamada et al., 2012). Among the environmen-tal variables apt to influence the ratio of the heterotrophic clusters, increase in nutrient concentrations associated with the sloppy feeding mechanism may partially lead to the high abundance of VHNA observed at the bottom of the euphotic layer, as previously reported by Thyssen et al. (2005). The sloppy feeding hypothesis is ecologically coherent because the limit of the euphotic layer was not coupled with the ther-mocline, underlying that a part of the organic material pro-duced in surface could be transported below the euphotic layer by vertical migration of organisms, improving the graz-ing activity.
5 Conclusions
This study along a 2300 km transect in the North Pacific subtropical gyre area during strong La Niña conditions showed that the heterotrophic prokaryote distribution is cor-related with three different seawater masses identified as (i) the Kuroshio, (ii) the subtropical gyre and (iii) the Tran-sition zone. A latitudinal increase in the HNA / LNA ratio was found along the equatorward oligotrophic gradient and
suggested different relationships between the various het-erotrophic clusters and the environmental variables measured in situ during the cruise. The statistical analyses highlighted that the majority of the heterotrophic prokaryote distribu-tion is explained by temperature and salinity. Nutrients and phytoplankton-related variables had different influences de-pending on the LNA, HNA and VHNA clusters. LNA dis-tribution is mainly correlated with temperature and salinity while HNA distribution is mainly explained by an association of variables (temperature, salinity, Chl a and silicic acid). During the cruise, two eddies (one cyclonic and one anti-cyclonic) were crossed. The vertical distributions of LNA, HNA and VHNA were investigated. Based on the current surface map and the microorganism distribution, it is reason-able to form the hypothesis that the high concentration of het-erotrophic prokaryotes observed at station 4 was linked to the path of the cold cyclonic eddy core. In contrast, in the warm core of the anticyclonic eddy, lower heterotrophic prokaryote concentrations are suggested to be linked to the low nutrient concentrations. Results described in this study highlight the high variability of each heterotrophic prokaryote cluster de-fined by their nucleic acid content (LNA, HNA, and VHNA) with regard to the mesoscale structures and the oligotrophic gradient observed in situ within the area of the North Pacific subtropical gyre.
The Supplement related to this article is available online at doi:10.5194/bg-12-3607-2015-supplement.
Acknowledgements. We thank Akira Noda, crew members of the research training vesselShinyo Maruof the Tokyo University of Marine Science and Technology, (TUMSAT) for their cooperation at sea. We appreciated the English correction of the manuscript made by Tracy L. Bentley. We thank Yuta Nakagawa and Shinko Kinouchi for their help during the cruise. We are grateful to the PRECYM Flow Cytometry Platform of the Mediterranean Institute of Oceanography (MIO) for the flow cytometry analyses. We also thank the Société franco-japonaise d’Océanographie for its support in shipping the samples from Japan to France.
Edited by: G. Herndl
References
Andrade, L., Gonzalez, A. M., Rezende, C. E., Suzuki, M., Valentin, J. L., and Paranhos, R.: Distribution of HNA and LNA bacterial groups in the Southwest Atlantic Ocean, Braz. J. Microbiol., 38, 330–336, 2007.
Arístegui, J. and Montero, M. F.: Temporal and spatial changes in plankton respiration and biomass in the Canary Islands region: the effect of mesoscale variability, J. Marine Syst., 54, 65–82, 2005.
Baines, S. B., Twining, B. S., Brzezinski, M. A., and Nelson, D. M.: An unexpected role for picocyanobacteria in the marine silicon cycle, Nat. Geosci., 5, 886–891, 2012.
Baltar, F., Arístegui, J., Montero, M. F., Espino, M., Gasol, J. M., and Herndl, G. J.: Mesoscale variability modulates seasonal changes in the trophic structure of nano- and picoplankton com-munities across the NW Africa-Canary Islands transition zone, Prog. Oceanogr., 83, 180–188, 2009.
Baltar, F., Arístegui, J., Gasol, J. M., Lekunberri, I., and Herndl, G. J.: Mesoscale eddies: hotspots of prokaryotic activity and differ-ential community structure in the ocean, ISME J., 4, 975–988, 2010.
Bidigare, R. R., Benitez-Nelson, C., Leonard, C. L., Quay, P. D., Parsons, M. L., Foley, D. G., and Seki, M. P.: Influence of a cyclonic eddy on microheterotroph biomass and carbon export in the Lee of Hawaii, Geophys. Res. Lett., 30, 1318, doi:10.1029/2002GL016393, 2003.
Bidle, K. D. and Azam, F.: Accelerated dissolution of diatom silica by marine bacterial assemblages, Nature, 397, 508–512, 1999. Bouvier, T., del Giorgio, P. A., and Gasol, J. M.: A comparative
study of the cytometric characteristics of high and low nucleic– acid bacterioplankton cells from different aquatic ecosystems, Environ. Microbiol., 9, 2050–2066, 2007.
Caron, D. A., Dam, H. G., Kremer, P., Lessard, E. J., Madin, L. P., Malone, T. C., Napp, J. M., Peele, E. R., Roman, M. R., and Youngbluth, M. J.: The contribution of microorganisms to partic-ulate carbon and nitrogen in surface waters of the Sargasso Sea near Bermuda, Deep-Sea Res. Pt. I, 42, 943–972, 1995. Christian, J. R., Lewis, M. R., and Karl, D. M.: Vertical fluxes
of carbon, nitrogen, and phosphorus in the North Pacific Sub-tropical Gyre near Hawaii, J. Geophys. Res., 102, 15667–15677, 1997.
Currie, D. J. and Kalff, J.: Can bacteria outcompete phytoplankton for phosphorus? A chemostat test, Microb. Ecol., 10, 205–216, 1984.
Del Grosso, V. A.: New equation for the speed of sound in natural waters with comparisons to other equations, J. Acoust. Soc. Am., 56, 1084–1091, 1974.
Duhamel, S., Dyhrman, S. T., and Karl, D. M.: Alkaline phos-phatase activity and regulation in the North Pacific Subtropical Gyre, Limnol. Oceanogr., 55, 1414–1425, 2010.
Emerson, S., Quay, P. D., Stump, C., Wilbur, D., and Schudlich, R.: Chemical tracers of productivity and respiration in the subtropi-cal Pacific Ocean, J. Geophys. Res., 100, 15873–15887, 1995. Garside, C.: A chemiluminescent technique for the determination of
nanomolar concentrations of nitrate and nitrite in seawater, Mar. Chem., 11, 159–167, 1982.
Gasol, J. M. and Duarte, C. M.: Comparative analyses in aquatic microbial ecology: how far do they go?, FEMS Microbiol. Ecol., 31, 99–106, 2000.
Gasol, J. M., Zweifel, U. L., Peters, F., Fuhrman, J. A., and Hågström, A.: Significance of size and nucleic acid content het-erogeneity as measured by flow cytometry in natural planktonic bacteria, Appl. Environ. Microb., 65, 4475–4483, 1999.
Gasol, J. M., Vázquez-Domínguez, E., Vaqué, D., Agustí, S., and Duarte, C. M.: Bacterial activity and diffuse nutrient supply in the oligotrophic central Atlantic Ocean, Aquat. Microb. Ecol., 56, 1–12, 2009.
Girault, M., Arakawa, H., and Hashihama, F.: Phosphorus stress of microphytoplankton community in the western subtropical North Pacific, J. Plankton Res., 35, 146–157, 2013a.
Girault, M., Arakawa, H., Barani, A., Ceccaldi, H. J., Hashihama, F., Kinouchi, S., and Gregori, G.: Distribution of ultraphyto-plankton in the western part of the North Pacific subtropi-cal gyre during a strong La Niña condition: relationship with the hydrological conditions, Biogeosciences, 10, 5947–5965, doi:10.5194/bg-10-5947-2013, 2013b.
Gomes, A., Gasol J. M., Estrada, M., Franco-Vidal, L., Díaz-Pérez, L., Ferrera I., Anxelu, and Morán, X.: Heterotrophic bacterial responses to the winter–spring phytoplankton bloom in open wa-ters of the NW Mediterranean, Deep-Sea Res. Pt. I, 96, 59–68, 2015.
Grégori, G., Citterio, S., Ghiani, A., Labra, M., Sgorbati, S., Brown, S., and Denis, M.: Resolution of viable and membrane compro-mised bacteria in fresh and marine waters based on analytical flow cytometry and nucleic acid double staining, Appl. Environ. Microb., 67, 4662–4670, 2001.
Grégori, G., Denis, M., Lefevre, D., and Romano, J. C.: Viability of heterotrophic bacteria in the Bay of Marseilles, C. R. Biol., 326, 739–750, 2003a.
Grégori, G., Denis, M., Sgorbati, S., and Citterio, S.: Resolution of viable and membrane-compromised free bacteria in aquatic envi-ronments by flow cytometry, Curr. Protoc. Cytom., 23, 11.15.1– 11.15.7, 2003b.
Hall, E. K., Neuhauser, C., and Cotner, J.: Toward a mechanistic understanding of how natural bacterial communities respond to changes in teperature in aquatic ecosystems, ISME J., 2, 471– 481, 2008.
Hashihama, F., Furuya, K., Kitajima, S., Takeda, S., Takemura, T., and Kanda, J.: Macro-scale exhaustion of surface phosphate by dinitrogen fixation in the western North Pacific, Geophys. Res. Lett., 36, L03610, doi:10.1029/2008GL036866, 2009.
Hashihama, F. and Kanda, J.: Automated colorimetric determina-tion of trace silicic acid in seawater by gas-segmented continu-ous flow analysis with a liquid waveguide capillary cell, La Mer, 47, 119–127, 2010.
Hashihama, F., Kanda, J., Maeda, Y., Ogawa, H., and Furuya, K.: Selective depressions of surface silicic acid within cyclonic mesoscale eddies in the oligotrophic western North Pacific, Deep-Sea Res. Pt. I, 90, 115–124, 2014.
Kataoka, T., Hodoki, Y., Suzuki, K., Saito, H., and Higashi, S.: Tempo-spatial patterns of bacterial community composition in the western North Pacific Ocean, J. Marine Syst., 77, 197–207, 2009.
Kitajima, S., Furuya, K., Hashihama, F., Takeda, S., and Kanda, J.: Latitudinal distribution of diazotrophs and their nitrogen fix-ation in the tropical and subtropical western North Pacific, Lim-nol. Oceanogr., 54, 537–547, 2009.
King, F. D. and Devol, A. H.: Estimates of vertical eddy diffu-sion through the thermocline from phytoplankton nitrate uptake rates in the mixed layer of the estern tropical Pacific, Limnol, Oceanogr., 24, 645–651, 1979.
Klein, P. and Lapeyre G.: The oceanic vertical pump induced by mesoscale and submesoscale turbulence, Annu. Rev. Mar. Sci., 1, 351–375, 2009.
Kobari, T., Hijiya, K., Minowa, M., and Kitamura, M.: Depth dis-tribution, biomass and taxonomic composition of subtropical mi-crobial community in southwestern Japan, South Pacific Studies, 32, 31–43, 2011.
Krause, J. W., Brzezinski, M. A., Villareal, T. A., and Wilson, C.: Increased kinetic efficiency for silicic acid uptake as a driver of summer diatom blooms in the North Pacific subtropical gyre, Limnol. Oceanogr., 57, 1084–1098, 2012.
Landry, M. R., Brown, S. L., Rii, Y. M., Selph, K. E., Bidigare, R. R., Yang E. J., and Simmons, M. P.: Depth-stratified phy-toplankton dynamics in Cyclone Opal, a subtropical mesoscale eddy, Deep-Sea Res. Pt. II, 56, 1348–1359, 2008.
Lasternas, S., Piedeleu, M., Sangrà, P., Duarte, C. M., and Agustí, S.: Forcing of dissolved organic carbon release by phytoplank-ton by anticyclonic mesoscale eddies in the subtropical NE At-lantic Ocean, Biogeosciences, 10, 2129–2143, doi:10.5194/bg-10-2129-2013, 2013.
Lebaron, P., Parthuisot, N., and Catala, P.: Comparison of blue nu-cleic acid dyes for flow cytometric enumeration of bacteria in aquatic systems, Appl. Environ. Microb., 64, 1725–1730, 1998. Lebaron, P., Servais, P., Agogue, H., Courties, C., and Joux, F.: Does
the high nucleic acid content of individual bacterial cells allow us to discriminate between active cells and inactive cells in aquatic systems?, Appl. Environ. Microb., 67, 1775–1782, 2001. Ledwell, J. R., Watson, A. J., and Laws, C. S.: Mixing of a tracer in
the pycnocline, J. Geophys. Res., 103, 21499–21529, 1998. Ledwell, J. R., Mc Gillicuddy Jr., D. J., and Anderson, L. A.:
Nu-trient flux into an intense deep chlorophyll layer in a mode-water eddy, Deep-Sea Res. Pt. II, 55, 1139–1160, 2008.
Lewis, M. R., Harrison, G., Oakey, N. S., Herbert, and D., Platt T.: Vertical nitrate fluxes in the oligotrophic ocean, Science, 234, 870–873, 1986.
Li, Y.-H., Peng, T.-H., Broecker, W. S., and Göte Östlund, H.: The average vertical mixing coefficient for the oceanic thermocline, Tellus, 36, 212–217, 1984.
Lipkovich, L. I. and Smith, E. P.: Biplot and singular value decom-position macros for Excel®, J. Stat. Softw., 7, 1–15, 2002. Liu, Q.: Variation partitioning by partial redundancy analysis
(RDA), Environmetrics, 8, 75–85, 1997.
Maki, T., Ishikawa, A., Kobayashi, F., Kakikawa, M., Aoki, K., Mastunaga, T., Hasegawa H., and Iwasaka, Y.: Effects of Asian dust (KOSA) deposition event on bacterial and microalgal com-munities in the Pacific Ocean, Asian J. Atmos. Environ., 5, 157– 163, 2011.
Marie, D., Brussaard, C. P. D., Thyrhaug, R., Bratbak, G., and Vaulot, D.: Enumeration of marine viruses in culture and natural samples by flow cytometry, Appl. Environ. Microb., 65, 45–52, 1999.
Mitbavkar, S., Saino, T., Horimoto, N., Kanda, J., and Ishimaru T.: Role of environment and hydrography in determining the picoplankton community structure of Sagami Bay, Japan, J. Oceanogr., 65, 195–208, 2009.
Nencioli, F., Dickey, T. D., Kuwahara V. S., Black W., Rii, Y. M., and Bidigare, R. R.: Physical dynamics and biological implica-tions of a mesoscale cyclonic eddy in the Lee of Hawaii: Cyclone Opal observations during E-Flux III, Deep-Sea Res. Pt. II, 55, 1252–1274, 2008.
Nishimura, Y., Kim, C., and Nagata, T.: Vertical and seasonal vari-ations of bacterioplankton subgroups with different nucleic acid contents: possible regulation by phosphorus, Appl. Environ. Mi-crob., 71, 5828–5836, 2005.
Painter, S. C., Patey, M. D., Forryan, A., and Torres-Valdes, S.: Evaluating the balance between vertical diffusive nitrate supply and nitrogen fixation with reference to nitrate uptake in the east-ern subtropical North Atlantic Ocean, J. Geophys. Res.-Oceans, 118, 5732–5749, doi:10.1002/jgrc.20416, 2013.
Painter, S. C., Henson, S. A., Forryan, A., Steigenberger, S., Klar, J., Stinchcombe, M. C., Rogan, N., Baker, A. R., Achterberg, E. P., and Moore, C. M.: An assessment of the vertical diffu-sive flux of iron and other nutrients to the surface waters of the subpolar North Atlantic Ocean, Biogeosciences, 11, 2113–2130, doi:10.5194/bg-11-2113-2014, 2014.
Pearson, K.: On lines and planes of closest fit to systems of points in space, Philos. Mag., 2, 559–572, 1901.
Rii, Y. M., Brown Susan, L., Nencioli, F., Kuwahara, V., Dickey, T., Karl, D. M., and Bidigare, R. R.: The transient oasis: Nutrient-phytoplankton dynamics and particle export in Hawaiian lee cy-clones, Deep-Sea Res. Pt. II, 55, 1275–1290, 2008.
Rooth, C. and Ostlund, H. G.: Penetration of tritium into the At-lantic thermocline, Deep-Sea Res., 19, 481–492, 1972.
Seki, M. P., Polovina, J. J., Brainard, R. E., Bidigare, R. R., Leonard, C. L., and Foley, D. G.: Biological enhancement at cyclonic ed-dies tracked with goes thermal imagery in hawaiian waters, Geo-phys. Res. Lett., 28, 1583–1586, 2001.
Sekine, Y. and Miyamoto, S.: Influence of Kuroshio flow on the horizontal distribution of north Pacific intermediate water in the Shikoku basin, J. Oceanogr., 58, 611–616, 2002.
Sherr, B., Sherr, E., and Longnecker, K.: distribution of bacterial abundance and cell-specific nucleic acid content in the Northeast Pacific Ocean, Deep-Sea Res. Pt. I, 53, 713–725, 2006. Sieracki, M. E., Haugen, E. M., and Cucci, T. L.: Overestimation
of heterotrophic bacteria in the Sargasso Sea: direct evidence by flow and imaging cytometry, Deep-Sea Res. Pt. I, 42, 1399–1409, 1995.
Sprintall, J. and Roemmich, D., Characterizing the structure of the surface layer in the Pacific Ocean, J. Geophys. Res., 104, 23297– 23311, 1999.
Stapleton, N. R., Aicken, W. T., Dovey, P. R., and Scott, J. C.: The use of radar altimeter data in combination with other satellite-sensors for routine monitoring of the ocean: case study of the northern Arabian sea and Gulf of Guam, Can. J. Remote Sens., 28, 567–572, 2002.
Suzuki, R. and Ishimaru, T.: An improved method for the determination of phytoplankton chlorophyll using N,N-Dimethylformamide, J. Oceanogr. Soc. Japan, 46, 190–194, 1990.
Thingstad, T. F., Zweifel, U. L., and Assoulzadegan, F. R.: P-limitation of heterotrophic bacteria and phytoplankton in the north- west Mediterranean, Limnol. Oceanogr., 43, 88–94, 1998. Thyssen, M., Lefèvre, D., Caniaux, G., Ras, J., Fernández, C. I., and Denis, M.: Spatial distribution of heterotrophic bacteria in the northeast Atlantic (POMME study area) during spring 2001, J. Geophys Res., 110, C07S16, doi:10.1029/2004JC002670, 2005. Vadstein, O.: Evaluation of competitive ability of two heterotrophic planktonic bacteria under phosphorus limitation, Aquat. Microb. Ecol., 14, 119–127, 1998.
Vaillancourt, R. D., Marra, J., Seki, M. P., Parsons, M. L., and Bidi-gare, R. R.: Impact of a cyclonic eddy on phytoplankton commu-nity structure and photosynthetic competency in the subtropical North Pacific Ocean, Deep-Sea Res. Pt. I, 50, 829–847, 2003. Van Scoy, K. A. and Kelley, D. E.: Inferring vertical diffusivity from
two decades of tritium penetration, EOS, Trans. AGU, 77, Ocean Sci. Meet. Suppl. OS40, 1996.
Van Wambeke, F., Ghiglione, J.-F., Nedoma, J., Mével, G., and Raimbault, P.: Bottom up effects on bacterioplankton growth and composition during summer-autumn transition in the open NW Mediterranean Sea, Biogeosciences, 6, 705–720, doi:10.5194/bg-6-705-2009, 2009.
Van Wambeke, F., Catala, P., Pujo-Pay, M., and Lebaron, P.: Ver-tical and longitudinal gradients in HNA-LNA cell abundances and cytometric characteristics in the Mediterranean Sea, Biogeo-sciences, 8, 1853–1863, doi:10.5194/bg-8-1853-2011, 2011.
Wang, H., Smith, H. L., Kuang, Y., and Elser, J. J.: Dynamics of stoichimotric bacteria-algae interactions in the epilemnion, Siam J. Appl. Math., 68, 503–522, 2007.
White, A. E., Watkins-Brandt, K. S., Engle, M. A., Burkhardt, B., and Paytan, A.: Characterization of the rate and temperature sen-sitivities of bacterial remineralization of dissolved organic phos-phorus compounds by natural populations, Front. Microbio., 3, 276, doi:10.3389/fmicb.2012.00276, 2012.
White, W. and Bernstein, R.: Large-scale vertical eddy diffusion in the main pycnocline of the central North Pacific, J. Phys. Oceanogr., 11, 434–441, 1981.
Wilson, C.: Late Summer chlorophyll blooms in the oligotrophic North Pacific Subtropical Gyre, Geophys. Res. Lett., 30, 1942, doi:10.1029/2003GL017770, 2003.
Yamada, N., Fukuda, H., Ogawa, H., Saito, H., and Suzumura, M.: Heterotrophic bacterial production and extracellular enzymatic activity in sinking particulate matter in the western North Pacific Ocean, Front. Microbio., 3, 379, doi:10.3389/fmicb.2012.00379, 2012.