Composition, Buoyancy Regulation and Fate of Ice Algal
Aggregates in the Central Arctic Ocean
Mar Ferna´ndez-Me´ndez1,2*, Frank Wenzho¨fer1,2, Ilka Peeken3,4, Heidi L. Sørensen5,6, Ronnie N. Glud5,6,7,8, Antje Boetius1,2,4
1HGF-MPG Group for Deep Sea Ecology and Technology, Alfred-Wegener-Institut Helmholtz-Zentrum fu¨r Polar- und Meeresforschung, Bremerhaven, Germany,2 HGF-MPG Group for Deep Sea Ecology and Technology, Max Planck Institute for Marine Microbiology, Bremen, Germany,3Polar Biological Oceanography, Alfred-Wegener-Institut Helmholtz-Zentrum fu¨r Polar- und Meeresforschung, Bremerhaven, Germany,4MARUM, Center for Marine Environmental Sciences, University of Bremen, Bremen, Germany,5Nordic Centre for Earth Evolution, University of Southern Denmark, Odense, Denmark,6Greenland Climate Research Centre, Nuuk, Greenland,7Marine Biogeochemistry, Scottish Association for Marine Science, Oban, United Kingdom,8Arctic Research Centre, University of Aarhus, Aarhus, Denmark
Abstract
Sea-ice diatoms are known to accumulate in large aggregates in and under sea ice and in melt ponds. There is recent evidence from the Arctic that such aggregates can contribute substantially to particle export when sinking from the ice. The role and regulation of microbial aggregation in the highly seasonal, nutrient- and light-limited Arctic sea-ice ecosystem is not well understood. To elucidate the mechanisms controlling the formation and export of algal aggregates from sea ice, we investigated samples taken in late summer 2011 and 2012, during two cruises to the Eurasian Basin of the Central Arctic Ocean. Spherical aggregates densely packed with pennate diatoms, as well as filamentous aggregates formed byMelosira arcticashowed sign of different stages of degradation and physiological stoichiometries, with carbon to chlorophyllaratios ranging from 110 to 66700, and carbon to nitrogen molar ratios of 8–35 and 9–40, respectively. Sub-ice algal aggregate densities ranged between 1 and 17 aggregates m22, maintaining an estimated net primary production of 0.4–40 mg C m22d21, and accounted for 3–80% of total phototrophic biomass and up to 94% of local net primary production. A potential factor controlling the buoyancy of the aggregates was light intensity, regulating photosynthetic oxygen production and the amount of gas bubbles trapped within the mucous matrix, even at low ambient nutrient concentrations. Our data-set was used to evaluate the distribution and importance of Arctic algal aggregates as carbon source for pelagic and benthic communities.
Citation:Ferna´ndez-Me´ndez M, Wenzho¨fer F, Peeken I, Sørensen HL, Glud RN, et al. (2014) Composition, Buoyancy Regulation and Fate of Ice Algal Aggregates in the Central Arctic Ocean. PLoS ONE 9(9): e107452. doi:10.1371/journal.pone.0107452
Editor:Kay C. Vopel, Auckland University of Technology, New Zealand
ReceivedMay 19, 2014;AcceptedAugust 18, 2014;PublishedSeptember 10, 2014
Copyright:ß2014 Ferna´ndez-Me´ndez et al. This is an open-access article distributed under the terms of the Creative Commons Attribution License, which permits unrestricted use, distribution, and reproduction in any medium, provided the original author and source are credited.
Data Availability:The authors confirm that all data underlying the findings are fully available without restriction. All data are available in the public repository PANGAEA. http://doi.pangaea.de/10.1594/PANGAEA.832345.
Funding:HLS and RNG were supported by the Commission for Scientific Research in Greenland (KVUG;GCRC6507), the European Research Council through an Advanced Grant (ERC-2010-AdG20100224), the Danish National Research Foundation (DNRF53) and the Danish Council for Independent Research (12-125843). This study was supported by the European Research Council Advanced Investigator grant 294757 to AB. Additional support came from the Helmholtz Association and the Max Planck Society. The funders had no role in study design, data collection and analysis, decision to publish, or preparation of the manuscript.
Competing Interests:The authors have declared that no competing interests exist.
* Email: [email protected]
Introduction
In the Arctic Ocean, sea ice and water column microbial communities both contribute to photosynthetic production, but the relative importance of the pelagic versus the sympagic communities depends on season and geographical region [1]. Depending on light availability, the ice-algal growth season begins in April, and ends in September [2]. The total amount of productivity and standing stock formed seasonally in the water below the ice in the Central Arctic is constrained by light, as well as nutrient availability in the euphotic zone. Annual production in the ice-covered Central Arctic is estimated to be 9–10 g C m22 yr21, which is very low even compared to other oligotrophic oceans [3,4]. Previous investigations before 1997 have indicated a significant annual contribution by sea-ice algae to total photosyn-thetic productivity, on the order of 4–57% [3,5,6]. The wide range (0–10 g C m22yr21) of sea ice primary production rates including the Arctic shelves is due to a very high spatial variability [3].
Sub-ice algae can accumulate substantial biomass in the Central Arctic basins, at times exceeding 80% of the standing stock [5]. They offer an additional food source to planktonic grazers in early spring [6] and in late autumn when other food sources are scarce [7,8]. Also their contribution to carbon export from surface waters can be substantial (1–9 g C m22yr21) [9,10]. Ice algae comprise pennate diatoms such as Nitzschia sp., Pseudonitzschia sp.,
Cylindrothecasp.,Entomoneissp., andNaviculasp., which inhabit the ice pores and brine channels of first year (FYI) and multiyear ice (MYI) (e.g., [11–13]). The endemic sub-ice diatom,Melosira arctica, has a hybrid strategy, growing attached to the underside of ice-floes, of both FYI and MYI, forming filamentous strands of several meters length below the ice [14–17]. Different types of large sub-ice algal aggregates (up to 15 cm in diameter) have been observed in the Central Arctic since its first exploration in the 19th century, but due to sampling difficulties still little is known about their physiology, traits and adaptations [18–21]. More recently, floating algal aggregations formed mainly by sea-ice pennate
diatoms have been observed in melting FYI north of Svalbard and in the Fram Strait [8,22].
Planktonic diatoms tend to collide and aggregate in nutrient depleted waters after a bloom due to mucus secretion during senescence [23,24] and in general, sedimenting diatom aggregates contribute significantly to the marine biological carbon pump [25,26]. Sea-ice algae are known to produce large amounts of extracellular polymeric substances for attachment and cryoprotec-tion [27–29]. This may support their aggregacryoprotec-tion in summer when the ice cracks and melts, and when nutrients become limiting [23]. Algal aggregates eventually sink into deeper water column layers as a consequence of ice break up and melting [9,15]. Freshly deposited algal aggregates have been observed at the seafloor of the shelves [30] and central deep basins of the Arctic [9], indicating their rapid sedimentation at the end of the summer along the receding ice edge and in the event of substantial under-ice melt.
Many questions remain about aggregate formation, decay, grazing and sinking, as well as their contribution to carbon fluxes in the Central Arctic. Due to the rapid warming of the Arctic leading to a decrease in sea-ice extent and thickness [31,32] and an increase in the amount of light transmitted through the ice [33], both sea-ice and pelagic phototrophic communities are expected to change with respect to composition and distribution [34,35], productivity [36,37], and life cycle [2,9,38]. A better understand-ing of the factors regulatunderstand-ing sea-ice productivity, aggregate formation and sinking of sea-ice algae is important for future estimates of the Arctic carbon and nitrogen cycling. By combining field observations with simple experiments, this study examines the relevance of sea-ice algal aggregation for carbon and nitrogen turnover and reservoirs, as well as the processes regulating buoyancy versus sinking. Our data are used to assess the potential importance of algal aggregates for the export of organic matter from the surface ocean to the deep sea.
Materials and Methods
Sampling area
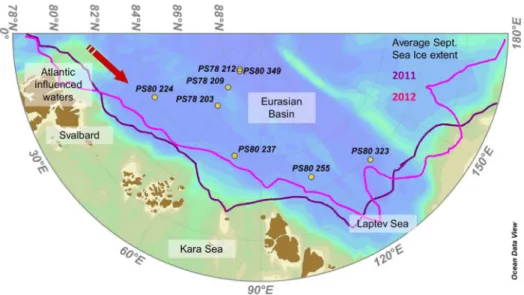
Samples were collected during two cruises to international waters of the Central Arctic Ocean with RV Polarstern in August-September 2011 and 2012 (PS78/3 and PS80/3 respectively) between 81u559–87u569N and 31u79–131u79E (Fig. 1). Six stations were in international waters and no specific permissions were required for these locations. For the two stations in the Russian exclusive economic zone, the diplomatic permissions for sampling were obtained from the responsible authorities. The field study did not involve endangered or protected species. Data was submitted to PANGAEA (http://doi.pangaea.de/10.1594/PANGAEA. 832345).
Replicates of two different algal aggregate types dominated either by pennate diatoms or byMelosirawere sampled at eight ice stations (Fig. 1). For each station the ice type (MYI or FYI) and the melt pond coverage were assessed [39]. Temperature and salinity of melt ponds containing aggregates were measuredin situ
using a hand-held conductivity meter (315i with TetraCon electrode cell, WTW GmbH, Weilheim in Oberbayern, Ger-many). Irradiance reaching the aggregates was calculated using the light attenuation coefficients of 1.5 m21 for sea ice, 10 m21for
snow [40] and 0.1 m21 for Atlantic influenced Arctic seawater
(based on data from the first expedition, PS78/3), and the daily average total incoming photosynthetically active radiation (PAR) measured with a pyranometer (Kipp&Zonen, Delft, Netherland) mounted on the ship.
Chemical composition of aggregates
Several aggregates (between 2 and 20) were sampled at each station together with some ambient water using a manually operated vacuum pump, when found in melt ponds (Fig. 2A), or a plastic ladle, when found in ice cracks. In general aggregates were pooled and homogenized to be able to measure a wide range of biological parameters on standardized subsamples. On two occasions individual aggregates were sampled at stations PS80/ 3_224 and PS80/3_349 for specific experiments. When classified according to their species composition, pennate diatom aggregates where sampled 6 times and Melosira arctica filaments 5 times (Table 1). Aggregate slurry was filtered through a pre-combusted GF/F filter (0.7mm pore size, Whatman, Kent, United Kingdom)
and analyzed with an elemental analyzer (EA3024-IRMS, EuroVetorSpA, Milan, Italy) to determine particulate organic carbon (POC) and particulate organic nitrogen (PON). POC was used to normalize all parameters to carbon mass. For pigment analysis 1–200 ml of the algal slurry (equivalent to 0.1–3 mg C) were filtered through GF/F filters, immediately frozen in liquid nitrogen, and stored at280uC. Chlorophyllaand phaeopigments were measured using high-performance liquid chromatography (HPLC) as described in [41]. The analytical error for the POC, PON and Chl a measurements was generally below 2%. For transparent exopolymers (TEP), 1–20 ml of the algal slurry (equivalent to 0.01–2.6 mg C) were filtered in triplicate on to 0.4mm pore size polycarbonate filters (Nuclepore, Whatman, Kent, United Kingdom), stained with Alcian Blue and stored at2
20uC. TEP concentration was measured with the colorimetric method according to [42] and transformed to carbon equivalents as described in [43]. Occasional dilution prior to filtration was accounted for using measured blank values of the dilution water. For dissolved organic carbon (DOC) 10 ml of the algal slurry (equivalent to 0.07–1.3 mg C) were filtered in triplicate through combusted GF/F filters and the filtrate collected in pre-combusted glass vials. The DOC concentration was determined by high temperature catalytic oxidation with a Shimadzu TOC-VCPN analyzer (Shimadzu Scientific Instruments, Kyoto, Japan). Samples were acidified in the auto-sampler and analyzed directly. Nutrients (phosphate, silicate, and nitrate) were measured in seawater, ice and aggregate slurries in an air-conditioned lab container with standard photometric method using a Technicon TRAACS 800 continuous flow auto analyzer (Technicon Corpo-ration) according to established methods [44].
Microscopy of aggregates
bacterial cells were counted per filter, using an Axiophot HBO50 (Carl Zeiss, Jena, Germany) microscope. Triplicate filters were counted per sample and the average error was 15%. The percentage of POC contained in the prokaryotic biomass was calculated using the carbon conversion factor of 0.03 pg C per cell specific for Arctic bacteria [47].
Biomass and primary production in water column, sea ice and aggregates
Although green-brownish sub-ice algal aggregates were ob-served at all ice stations [9], for logistic reasons we were only able to sample sufficient material at three stations. Here depth-integrated biomass and net primary production (NPP) were
Figure 1. Map of the Arctic Eurasian Basin with sampling stations.Yellow dots represent ice stations where algal aggregates were observed (Expedition PS78/3 took place in summer 2011 and PS80/3 in summer 2012). The purple line corresponds to the September monthly average sea ice extent in 2011 and the pink line in 2012 (Source: http://nsidc.org/data/seaice_index/).
doi:10.1371/journal.pone.0107452.g001
Figure 2. Distribution of aggregates in melt ponds.Degraded pennate aggregates in cryoconite holes at the bottom of a partially open melt pond at station PS78/3_212 (A).Melosirafilaments hanging from newly formed ice covering an open melt pond at station PS80/3_349 (B). Spherical floating aggregates below sea ice at station PS80/3_237 (Image taken with the ROV Ronja (Courtesy Alfred Wegener Institute Helmholtz Center for Marine and Polar Research (AWI)) (C). DegradedMelosirafilaments trapped at the bottom of a partially open melt pond at station PS80/3_224 (D). Scale bar = 20 cm.
doi:10.1371/journal.pone.0107452.g002
Arctic Algal Aggregates
calculated for sea ice and water column (PS80/3_224, PS80/ 3_237 and PS80/3_349) and compared to the integrated sub-ice algal aggregates per m22.
Sea-ice algal biomass was determined by cutting a representa-tive ice core at each station in 10–20 cm slices, melting them in filtered seawater (200 mL of 0.2mm filtered seawater were added
per cm of ice [48]) and filtering them through GFF filters to determine Chla and POC as for the aggregate slurry. For the phytoplankton community in the water below the ice, samples were taken with Niskin bottles disposed in a rosette attached to the Conductivity-Temperature-Depth sensor (CTD) at discrete depths, the water was filtered, and Chlaand POC was analyzed as above. Water column phytoplankton biomass was integrated over the euphotic zone (1% incoming irradiance) while sea-ice algal biomass accounted for the ice thickness (Table 2).
Depth-integrated NPP was estimated from 14C uptake rates [8,49]. All aggregate samples were homogenized before spiking the slurry with 14C bicarbonate 0.1mCi mL21 final concentration (NaH14CO3solution 52 mCi mmoL21specific activity, Moravek
Biochemicals, Brea, California, USA). Temperature was main-tained stable at 21.3uC with a thermo bath (Julabo GmbH, Seelbach, Germany). Three clear bottles with 10 mL each were incubated in the light and one in the dark. The estimated error of the method from the triplicates incubated in the light was 15% on average. Floating aggregate slurries collected at station PS80/ 3_224 and PS80/3_237 were incubated at 50mmol photons m22s21, which was a typical mid-day in situ value. Aggregate slurries from station PS80/3_349, as well as sea ice and water column of all stations were incubated under a range of irradiances (0, 8, 25, 50 and 90mmol photons m22s21) during 24 hours to calculate thein situNPP from photosynthesis vs irradiance curves (PE curves). Using this incubation time NPP is assessed (gross PP minus respiration) [50]. The PE curve was obtained after fitting the data with the equation from [51] using MATLAB. Only regressions with R2.0.5 were retained.In situNPP was calculated applying the irradiance measurements at the ice station to the PE curve equation.
To quantify the aggregated biomass and calculate NPP per area, aggregate abundance was quantified from scaled images. At stations PS80/3_224 (Aggregate P4) and PS80/3_237 (Aggregate P5) mean aggregate abundance under the ice was estimated from images taken by the upward looking camera of a Remotely Operated Vehicle (ROV) as described in [8]. At station PS80/ 3_349, Melosira filamentous biomass (Aggregate M5) was estimated from scaled images of the open melt pond (Fig. 2B). The aggregates were photographed with a waterproof camera (Lumix DMC-TS1). The diameter size range used to calculate the aggregate volume, assuming spherical shape, was determined from
in situobservations of ,10 aggregates per station before mixing them to form slurry. Thus, the up scaled values in this study represent local estimates for spatial scales of 1–10 m. This approach is different from that of [8] where the mean aggregate diameter was calculated from the ROV dives and used for up scaling to the dimensions of the ice floe. For spherical aggregates, thein situmeasured diameter size range used in this study was 3– 10 cm, while in [8] the mean diameter for the floe scale used was determined to be 0.8–1 cm. For the filamentous aggregates the measured length was 10–30 cm and the observed shape was cylindrical. The minimum and the maximum aggregated biomass per m2 was calculated by multiplying the average volume of aggregates (n = 10) by the number of aggregates observed per m2 and by the carbon concentration of the aggregate per volume (mg C m23). The aggregate NPP per m2was calculated similarly, by multiplying the total aggregate volume per m2by the measured carbon fixation rate. Chlawas estimated from the C:Chlaratio measured in the algal slurry from the same aggregate type. A similar procedure was used for the C:N ratios. Since aggregates showed a very patchy distribution, these calculations reflect local estimates at the sampling spot and cannot be directly up scaled to the Arctic-wide ice-cover.
Table 1.Algal aggregate types and their degradation stages.
Aggregate type Pennate spherical Melosirafilaments
Environment Below ice Melt Pond Below ice Melt Pond
Number of samples n = 2 n = 4 n = 2 n = 3
Size (cm) 3–15 1–15 1–30 2–15
Abundance (Agg m22) 0.8–5.1 0.1–600 17 9–200
Color Green-brownish White-yellowish Green-brownish White-yellowish
POC (mg C L21) 24–110 9–86 11–130 7–49
PON (mmol N mg POC21) 8–10 2–8 3–9 2–9
C:N molar 8–11 11–35 9–28 10–40
Chla(mg Chlamg POC21) 5–9 0.01–2 3–5 0.2–1.2
C:Chla 110–210 500–66700 200–340 850–4600
DOC (mmol DOC mg POC21) 7–9 7–11 5–17 7–35
TEP (mg C mg POC21) 0.5–2.5 4–170 2–8 4–17
TEP:POC 0.0005–0.002 0.004–0.17 0.002–0.008 0.004–0.02
NPP (mg C (mg POC)21d21) 0.001–0.01 0.001 0.002–0.155 0.002–0.014
Bacteria (cells mg POC21) 3.9E
+08–1.5E+09 6.3E+07–6.0E+08 5.6E+08 7.36E+07–6.1E+08
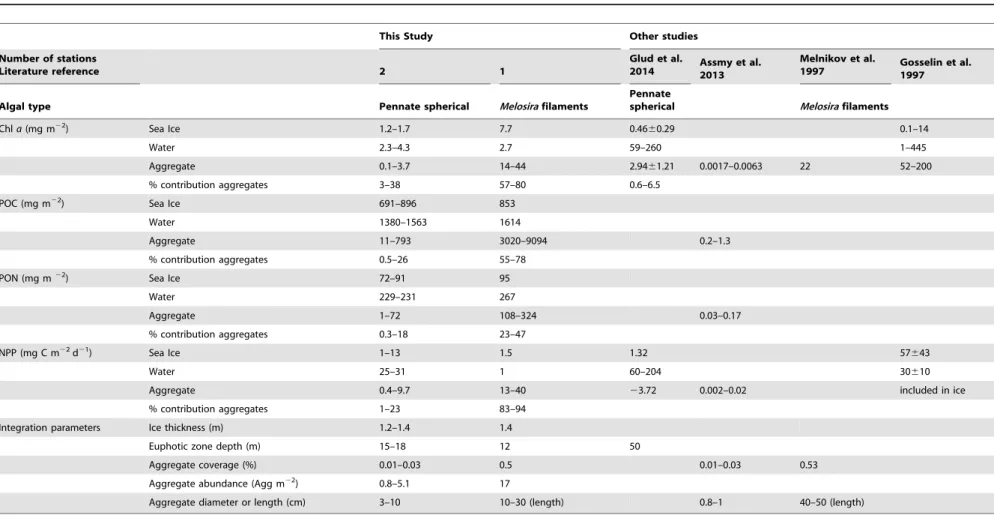
Table 2.Local areal estimates of fresh sub-ice algal aggregates per aggregate type compared to sea ice and water column at the same location and other studies.
This Study Other studies
Number of stations
Literature reference 2 1
Glud et al.
2014 Assmy et al.2013
Melnikov et al.
1997 Gosselin et al.1997
Algal type Pennate spherical Melosirafilaments
Pennate
spherical Melosirafilaments
Chla(mg m22) Sea Ice 1.2–1.7 7.7 0.4660.29 0.1–14
Water 2.3–4.3 2.7 59–260 1–445
Aggregate 0.1–3.7 14–44 2.9461.21 0.0017–0.0063 22 52–200
% contribution aggregates 3–38 57–80 0.6–6.5
POC (mg m22) Sea Ice 691–896 853
Water 1380–1563 1614
Aggregate 11–793 3020–9094 0.2–1.3
% contribution aggregates 0.5–26 55–78
PON (mg m22) Sea Ice 72–91 95
Water 229–231 267
Aggregate 1–72 108–324 0.03–0.17
% contribution aggregates 0.3–18 23–47
NPP (mg C m22d21) Sea Ice 1–13 1.5 1.32 57
643
Water 25–31 1 60–204 30610
Aggregate 0.4–9.7 13–40 23.72 0.002–0.02 included in ice
% contribution aggregates 1–23 83–94
Integration parameters Ice thickness (m) 1.2–1.4 1.4
Euphotic zone depth (m) 15–18 12 50
Aggregate coverage (%) 0.01–0.03 0.5 0.01–0.03 0.53
Aggregate abundance (Agg m22) 0.8–5.1 17
Aggregate diameter or length (cm) 3–10 10–30 (length) 0.8–1 40–50 (length)
doi:10.1371/journal.pone.0107452.t002
Arctic
Algal
Aggregates
PLOS
ONE
|
www.ploson
e.org
5
September
2014
|
Volume
9
|
Issue
9
|
Oxygen, carbon and nitrogen turnover ofMelosira arctica
aggregates
On 18 September 2012, station PS80/3_349 (87u56.019N, 61u 13.049E), a piece of ice from the frozen surface of an open melt pond was retrieved with algal aggregates attached (Fig. 2B). These were kept in a glass beaker with 800 mL of ambient seawater, at simulatedin situconditions: low light (8mmol photons m22s21)
and cold temperature (0uC). The initial temperature of the melt pond water collected for the experiment was21uC. After 12 h in the cold lab-container (0uC) under low light intensity (8mmol photons m22s21), the water reached 0uC and the piece of ice started melting. The vertical position of the aggregates was followed over time and as a function of the salinity gradient and the light intensity, to assess their buoyancy at different environ-mental conditions. In parallel, sub-samples of the algal slurry from the same type of aggregate were incubated under different conditions to assess oxygen, carbon and nitrogen fluxes.
Five sub-samples were incubated under different light intensities to estimate NPP from 14C uptake rates, as described above. In addition, oxygen concentration was followed in the same vials using fiber optic oxygen sensors (FireStingO2, PyroScience GmbH, Aachen, Germany). Oxygen sensitive sensor spots were glued to the interior of the glass vials previous to the experiment. The sensor spots contain an oxygen quenchable fluorophore (oxygen sensitive dye) which changes its fluorescence properties according to the oxygen concentration [52]. After a two point calibration at the temperature of the experiment, in air saturated and oxygen free seawater, oxygen concentration was measured in each vial prior to the experiment, after 2, 7, 17 and 28 h of incubation. NPP was calculated from the slope between oxygen concentration at each time point (regression R2.0.93) and a photosynthetic quotient of 1.25 was used to convert the oxygen exchange to carbon equivalents [53].
To measure the nitrate uptake, a 50 mL slurry sub-sample was incubated at 50mmol photons m22s21and nitrate was measured initially and after 1 and 4 days. In parallel, 18 subsamples of the algal slurry were incubated in 12 mL exetainers (Labco Inc., Buckinghamshire, England) to measure the denitrification and nitrification potential. Subsamples of the slurries were spiked either with15NO3, with15NH4+or with a mixture of14NO3and15NH4+
(final concentration 50mmol L21), using a modified version of the method described in [54]. One sub-sample of each treatment was placed at 50mmol photons m22s21, while the remaining
sub-samples were placed in darkness. The gradual O2 consumption
was followed in both set ups using the optode system described above. Anoxic conditions were reached after two days in the dark. The first time series was ended immediately by injecting 100mL
ZnCl2 into the exetainers, while the remaining samples were
terminated as the oxygen level reached 67, 35, and 0%, after 0.8, 1.2 and 2 days respectively. The isotopic composition of the N2
was measured using a gas chromatograph coupled to an isotope ratio mass spectrometer through a ConFlo-III interphase [55]. Calculations for denitrification rates were done according to [56]. The remaining sample volume was subsequently filtered through disposable, 0.45mm filters and concentrations of ammonium, nitrate and nitrite (NOx) were determined [57,58].
Results
Sea ice and melt pond observations
During August and September 2011 and 2012, FYI in a late melting stage was the dominant ice type at seven of the eight ice stations investigated (Table S1 and Table S2). Sea-ice thickness was between 0.7 and 2 m and melt pond coverage ranged between
10 and 50%. Only one MYI floe could be sampled during both cruises. The melt ponds sampled along the eight ice stations, had different depths (0.3–1 m), salinities (0–32), were open or closed to the seawater below them, and varied in ice cover. In partially open melt ponds at stations PS78/3_212 (Fig. 2A) and PS80/3_224 (Fig. 2D), a steep salinity gradient with 0 at the surface and values of 28–30 at the bottom (,0.4 m depth) was measured. Closed melt ponds at stations PS78_203, PS78/3_209, PS80/3_224 and PS80/3_255 had a steep salinity gradient too, but the maximum salinity at the bottom (0.3–0.6 m depth) was generally lower than in open melt ponds (Table S1 and S2). Aggregates were located either at the bottom of the melt pond where the salinity was highest or frozen within the ice cover (Fig. 2B).
Types of algal aggregates and their degradation stages
By macroscopic and microscopic observations of the diatom composition (Fig. 3), two different types of algal aggregates were identified: (1) spherical aggregates floating under the ice or trapped in melt ponds, mainly composed of pennate diatoms (Nitzschiasp.,
Naviculasp.,Fragilariopsis sp., andEntomoneissp.) (Table S1), and (2) hanging filamentous strings, mainly composed of the centric diatomMelosira arctica(Table S2).
Both the pennate and centric diatom aggregates were present in different degradation stages (Fig. 3). Their characteristics are summarized in Table 1. Fresh, green-brownish aggregates of both types were found below the sea ice, either floating or attached to the ice (Fig. 2B), while degraded, yellow-whitish aggregates were usually found at the bottom of melt ponds in cryoconite holes (Fig. 2A). Microscopic observations confirmed that the green-brownish aggregates were formed by diatoms with healthy-looking chloroplasts in their cytoplasm (bright green under the light microscope and occupying almost the entire cytoplasm), while the yellow and white aggregates contained a high proportion of empty frustules (Fig. 2). Green-brownish aggregates generally occurred where nutrient concentrations were above 2mmol L21 nitrate, 0.2mmol L21phosphate, and 2mmol L21silicate at the bottom of
melt ponds or below the ice.
White-yellowish aggregates had higher C:N molar and C:Chla
mass ratios than green-brownish aggregates (Table 1). The highest Chla values were encountered in dark green-brown aggregates (Fig. 3A), and the lowest values were observed in aggregates with white coloration (Fig. 3B). The stickiness of the aggregates is reflected in the TEP:POC ratio (0.001–0.17), that was highest in aggregates found in melt ponds where the nutrients were low (nitrate,0.2mmol L21, phosphate,0.02mmol L21and silicate,
2mmol L21) (M1 and M4, Table S2). In general, degraded
aggregates contained more TEP than fresh aggregates (Table 1). Bacterial abundance in the aggregate slurries spanned two orders of magnitude, from 6.36107to 1.56109cells mg POC21, making up 0.2–20% (Median of 1.2%) of the POC. Greenish-brownish aggregates hosted one order of magnitude more bacteria than white-yellowish aggregates. The DOC concentrations of the algal aggregates ranged between 5 and 35mmol DOC mg POC21 (Table 1), making up 4–30% of the total carbon (sum of POC and DOC). This corresponds to an average of 295mmol L21DOC in
amphi-pods were observed in some spherical pennate aggregates. However, no such grazers were observed on green-brownish
Melosira arcticafilaments.
Contribution of algal aggregates to system scale phototrophic biomass and primary production
Due to their patchy distribution and inaccessibility, green-brownish sub-ice aggregates could only be sampled at three stations although they were observed with the ROV at all eight stations investigated. Yellow-whitish aggregates reached highest abundances in melt ponds (stations PS78/3_212 (Fig. 2A) and PS80/3_224 (Fig. 2D)).
Table 2 compares the integrated phototrophic biomass of sea ice (1.2–1.4 m thickness), water column euphotic zone (12–18 m depth), and the two different types of aggregates investigated, including previous observations on pennate diatom [8,22] and
Melosira based aggregates [5,14]. Under-ice ROV surveys revealed a high degree of horizontal patchiness in aggregate abundance below the ice (Fig. 2C). Locally, spherical floating aggregates reached an abundance of 0.8–5.1 aggregates m22and a diameter of 3–10 cm, containing 0.1–3.7 mg Chlam22, which corresponded to 3–38% of total phototrophic biomass. Melosira arcticafilaments observed in autumn 2012 were 10–30 cm long and reached abundances of 17 aggregates m22 with 14–44 mg Chl a m22, corresponding to 57–80% of total phototrophic biomass.
At the sampled sites, floating aggregates contributed with 0.5– 26% (pennate), and 55–78% (Melosira)to the particulate organic carbon pool of the integrated euphotic zone (Table 2). Pennate-diatom aggregates showed Chla/CPE values similar to the sea-ice algae at the same station, whileMelosirafilaments showed Chla/ CPE values similar to the pelagic communities. In general the C:N ratios of green-brownish aggregates (8–28) were higher than the values for the phytoplankton (,5) and the sea-ice algae (6–8). Green-brownishMelosiraaggregates showed higher C:N ratios (9– 28) than all pennate aggregates (8–11). In white-yellowish
aggregates C:N ratios were generally higher (11–35 in pennate and 10–40 inMelosiraaggregates).
Regarding in situ NPP per m2, spherical floating aggregates showed similar NPP as the corresponding integrated value for sea ice, and 50% of the value for the depth-integrated water columns euphotic zone (15–18 m) (Table 2). In contrast, up scaledMelosira arcticafilaments reached NPP rates one order of magnitude higher than the values of the integrated water columns euphotic zone (12 m) and the sea ice in late September (Table 2). The daily average irradiance received below the icein situat stations PS80/ 3_224 and 237, where pennate aggregates were found, was 99 and 52mmol photons m22s21, respectively. Hence, in situ NPP of aggregates at station 224 may be underestimated, since the incubation performed at 50mmol photons m22s21.
For theMelosira arcticafilaments found at station PS80/3_349, both carbon uptake and oxygen production were monitored in homogenized algal slurries at different light intensities. The fitted PE curve of the carbon uptake (R2= 0.986), showed a photosyn-thetic maximum (Pmax) of 3.7 mg C L21d21, an initial slope of
120mg C L21d21 (mmol photons m22s21)21 and no photo-inhibition at irradiances lower than 90mmol photons m22s21 (Fig. 4). Carbon uptake could be quantified even at the lowest irradiance (8mmol photons m22s21). However, no net oxygen production took place at this irradiance, rather oxygen was consumed (Fig. 4). At light levels above 20mmol photons m22s21, oxygen production was detected.
Buoyancy test
Besides the observations of floating aggregates in the laboratory, some aggregates were observed floating below the ice, others at the pycnocline in open melt ponds and also coming up to the surface through bore holes in the ice. To investigate the causes of buoyancy, a simple test was performed with intact aggregates (n = 4) anchored to newly formed ice from station PS80/3_349, composed of a mixture ofMelosira arctica,Cylindrothecasp., and
Nitzschiasp. (Fig. 3C and G, Fig. 5A) (M5 in Table S2). Once the
Figure 3. Representative types of aggregates observed.Macroscopic images of the aggregates (A–D) and their microscopic composition (E– H). Fresh spherical floating aggregates below the ice formed by pennate diatoms (A and E). Degraded aggregate trapped in a closed melt pond formed by dead pennate diatoms with empty frustules (B and F). Filaments hanging from newly formed ice over an open melt pond formed by
Melosira arcticacells that contain green chloroplasts (C and G). Degraded aggregate formed mainly by deadMelosira arcticacells trapped at the bottom of a partially open melt pond (D and H). Scale bar = 5 cm (A), 2 cm (B), 10 cm (C and D), and 20mm (E–H).
doi:10.1371/journal.pone.0107452.g003
Arctic Algal Aggregates
ice had melted, the four intact algal aggregates remained floating at the surface (Fig. 5B). It was then observed that air bubbles of different sizes (0.01 to 0.7 cm) were trapped in the mucous matrix of the floating aggregates (Fig. 5B bottom). To test if these air bubbles were responsible for the aggregates buoyancy, the bubbles of one aggregate were physically removed. The aggregate devoid of bubbles sunk to the bottom of the beaker, regardless of the stable salinity gradient formed due to the ice melt (Fig. 5C). After 24 hours, the remaining aggregates also sank to the bottom of the beaker (Fig. 5D). To test if photosynthetically produced oxygen was the source of the aggregate bubbles, we increased the light intensity reaching the sunken aggregates in the beaker. After increasing the irradiance to 50mmol photons m22s21 for 48 h,
the sunken aggregates formed bubbles and regained their buoyancy (Fig. 5E), indicating that photosynthetically produced oxygen might be responsible for the gas bubble formation.
Oxygen and carbon turnover in algal aggregates
TheMelosiraslurry showed a bulk oxygen consumption rate of 0.1360.02 mmol O2L21d21at low irradiance (8mmol photons
m22s21). Non-invasive measurements with microsensors on one pennate-diatom also showed net oxygen consumption with almost anoxic conditions (10–120mmol L21Oxygen) in the center of the aggregate (see Fig. S1).
Assuming a 1:1.25 ratio of CO2production to O2respiration we
transformed the oxygen consumption rate mentioned above into carbon respiration rate. Dividing the POC measured in each sample (Table S2) by the carbon respiration rate, we estimated the carbon turnover in theMelosiraslurry. The turnover of particulate carbon at low irradiance (8mmol photons m22s21) would be 8–11
days. Net oxygen consumption and carbon remineralization occurred at lower light intensities in the Melosira algal slurry than in the compact pennate-diatom aggregate. Floating green-brownish aggregates incubated for 4–5 days at low irradiances lost
Figure 4. Photosynthesis vs Irradiance curve ofMelosira arcticaalgal slurry (M5).Carbon uptake measured with the14C radioactive isotope method (green circles) and oxygen production or consumption using optodes (purple diamonds) of the algal aggregate slurry from theMelosira arcticaaggregate used for the buoyancy experiment (Fig. 5). The threshold irradiance for oxygen production is around 20mmol photons m22s21. Oxygen rates have been transformed to carbon equivalents using the photosynthetic quotient of 1.25 to improve the visualization of the two different methods used to measure NPP.
doi:10.1371/journal.pone.0107452.g004
Figure 5. Buoyancy test.(A) A piece of ice with several attached filamentous algal aggregates was kept in a glass beaker at simulatedin situ
conditions. (B) Once the ice disappeared it was observed that air bubbles were trapped in the mucous matrix of the floating aggregates. (C) Despite the salinity gradient, one of the aggregates sank when the air bubbles were removed. (D) 24 h later all algal aggregates had sunk. (E) Only when increasing the light intensity, some of the algal aggregates were able to produce enough oxygen to regain buoyancy. Scale bar = 2 cm.
their buoyancy and became net heterotrophic. Oxygen production in both aggregate types was probably light regulated. However, this observation is based on single measurements, with the two respective types of aggregates. Further experiments are needed to fully conclude that light-regulated oxygen production is respon-sible for aggregate buoyancy.
Nitrogen cycling inMelosira aggregates
Nitrate and ammonium concentrations were monitored in parallel in theMelosiraalgal slurry sample incubated underin situ
representative light conditions (50mmol photons m22s21). During the first 24 h, the nitrate consumption rate was 0.94mmol N L21 and the ammonium consumption 2.47mmol N L21.
Denitrifica-tion and nitrificaDenitrifica-tion potential was measured in slurry samples spiked with labeled nitrate and ammonium, respectively (15NO3
and 15NH4+). During light, nitrate was produced at a rate of
1.760.001mmol L21d21and ammonium was consumed at a rate
of 1.660.003mmol L21d21. In the dark, nitrate was produced at lower rates (0.4–0.5mmol L21d21) and high net ammonification rates were measured (1.5–5.8mmol L21d21). A potential for denitrification could be detected (2–5 nmol L21d21) under anoxic conditions. Aggregates appeared to be hot spots for nitrogen cycling with potential for ammonification, nitrification and denitrification, and the rates seemed to be regulated by ambient light availability.
Discussion
Aggregate formation, distribution and degradation
Different types of aggregations of algae have been described in Arctic sea ice, mostly by observations made during summer, below pack ice [8,14,15,21,22]. At the end of the productive season, floating sub-ice algal aggregates tend to accumulate in dom-shape structures below the ice or in half open melts ponds or cracks. They have a very patchy distribution that seems to be governed by ice topography.
Based on our measurements and a synthesis of previous studies, we propose a conceptual model for aggregate formation and degradation in the Arctic (Fig. 6). This concept is based on the current trends of thinning sea-ice and higher melt pond coverage [60,61], but it only applies to the current situation and not to the Arctic ecosystem of three decades ago and it remains unclear if and for how long it can be projected into the future. Considering an average ice thickness of 1–2 m, light for photosynthesis is available to ice algae already in April-May, and single cells of sea-ice algae that have survived the winter darkness [62,63] can grow in the brine channels of the ice matrix [3] (Fig. 6.1). In summer, ice melting from the top and the bottom releases diatoms into ice cracks, melt ponds and the water column, respectively [8,21,22] (Fig. 6.2). Since sea-ice diatoms produce high concentrations of transparent exopolymers in the ice [27,64] they tend to aggregate under moderate turbulence and shear, creating algal flocs [65,66]. Newly formed melt ponds are usually shallow, light blue, have low salinity, and contain little visible life [67,68]. As melt ponds grow in depth during summer, the freshwater pool increases and sea-ice algae living at the bottom of the ponds or in pond water are gradually exposed to higher irradiances, lower salinity, and less nutrients (Fig. 6.3). Since sea-ice algae are adapted to low light [69,70], low temperature and high salinity [48,71], these new conditions could trigger the exudation of polysaccharides that create a mucous matrix around the cells [72], thereby increasing their stickiness and their predisposition to aggregation. This is probably the case for pennate diatom species growing in the ice as single cells and aggregating after their release during ice melt.
However, the centric diatom Melosira arctica, grows forming chains and excretes high amounts of mucus that contribute to the formation of filament-shaped aggregates [73]. Nutrient depletion can also increase diatom exopolymer exudation [23,28,74], contributing to aggregation. In autumn 2011, we observed many previous ponds, which had opened to the underlying seawater, allowing an exchange of phytoplankton species between seawater and the sea ice habitat (Fig. 6.4A), for example at station PS78/ 3_212 (Fig. 2A, Table S1). Around mid-September ice-melt stops and melt ponds close again when their surface and bottom refreezes (Fig. 6.4B). Mostly white-yellowish, apparently degraded aggregates were found in this type of closed melt pond in late autumn (Fig. 3B). Some diatoms, such asMelosira arctica, build up dense biomass accumulations despite nutrient constrains, that can be exported to the deep sea upon rapid melting of the sea ice [9,75]. Probably the attachment to the lower part of the ice enables them to harvest nutrients from a wider area while drifting over large distances. Some of them can maintain buoyancy throughout summer and can then be refrozen into the newly formed ice in early autumn (Fig. 6.5) [68].
Relevance of sea-ice algal aggregates for Arctic carbon and nitrogen fluxes
The spatial and temporal patchiness remains a challenge when estimating the importance of algal aggregates for ecosystem productivity and carbon flux [8,30]. Assmy et al., 2013 measured rather small Chlaconcentrations (2–6mg Chlam22) when up scaling the contribution of the observed aggregates to the area of the entire ice floe. Here we assessed the standing stock and productivity at a local scale, for two different types of sea-ice algal aggregates. Our study took place at the end of the summer, when nutrient depletion limits pelagic productivity. During this period, we found that algal aggregates contributed significantly to total biomass at a local scale in and below the sea-ice.
The estimates of Chl areported here for spherical aggregates formed by pennate diatoms (Table 2) is within the range of values reported earlier (2.961.2 mg Chl a m22; Fram Strait, [22]).
Locally, higher Chl a values were reached by Melosira arctica
filamentous aggregates in late September, contributing 57–80% to total phototrophic biomass when phytoplankton activity is reduced in the water column (Table 2). Also these values fall in the range of values previously reported for this type of Melosira sub-ice assemblage associated with MYI (22 mg Chlam22[14]) or FYI (52–200 mg Chl a m22 [5]). This suggests that ice algal aggregations could be a relevant food source in a wider area partly for under-ice zooplankton and for nekton at the end of the season and potentially also in winter, before the aggregates freeze into the ice [8,76,77]. In contrast, forMelosiraaggregates, grazing has only rarely been observed [13] and much of their biomass may sink out earlier in the season [9,15,30]. Observations of regionally widespread algal falls to the seafloor indicate that algal aggregates are not only locally relevant as hot spots of microbial activity, but may also contribute substantially to total carbon export [9].
Similar conclusions as to the relative contribution to biomass are reached using the POC values of the aggregates compared to the total sympagic or pelagic community. The contribution to total PON at a local scale was lower (0.3–18%) for pennate aggregates than forMelosirafilaments (23–47%). The overall relatively low mass ratios of C:Chlaof 110 and 212 for green-brownish pennate and centric diatom aggregates, respectively, indicate a healthy algal community. However, compared to the water column C:N ratio of 5–6, the green-brownish aggregates had an elevated C:N ratio (8–11 and 9–28 for green-brownish pennate and centric diatom aggregates, respectively). The white-yellowish aggregates
Arctic Algal Aggregates
containing many empty frustules even reached ratios of 40. This suggests an important contribution of exudate-carbon to the aggregates.
Pennate aggregates can contribute 1–23% to total in situ
integrated NPP at a local scale, andMelosira arcticafilaments as much as 83–94% of the total NPP north of 80uN in mid-September, when very little production is taking place in the water column or in the sea-ice. Melosira filaments can be more productive than the integrated euphotic zone in and below the ice in the Central Arctic (Table 2). However, aggregate slurries may overestimate NPP, due to the reduction of light adsorption by dilution compared to the naturally densely packed aggregates, hence the total contribution of intact aggregates is likely lower [22]. Indeed, intact spherical aggregates incubated for some days in the laboratory under low light conditions appear to be net heterotrophic (Fig. S1).
Another aspect of the contribution of sea-ice algal aggregates to carbon fluxes in the Arctic Ocean is the contribution to particle export. Diatom aggregates can substantially enhance carbon flux from the pelagic realm to the benthos [24–26]. In the Arctic, sea-ice algae are main contributors of the vertical export flux in summer [10,78]. In 2012 the direct export of sea-ice algal
aggregates was observed in relation to sea ice melt [9]. It was estimated that their contribution to the total carbon flux could reach 85% and from our results we can estimate that their contribution to the particulate nitrogen sinking flux potentially would be around 47% of the PON present at the end of the productive season. Considering the already low nutrient concen-trations of the Central Arctic surface waters, such an export could only be sustained on decadal scales, if more nutrients would be mixed in, e.g. by increasing wind mixing, or by increasing transport from the Arctic shelves [79]. Due to their relevance at least for standing stock and export flux, it is important to better understand the mechanisms of sea-ice aggregate formation, buoyancy regulation and sedimentation.
Buoyancy regulation
Adaptations of phytoplankton cells to control buoyancy include the formation of gas vacuoles, lipid accumulation, ion exchange and morphological features like hairs and spines [24,80,81]. In the Arctic Ocean, the observation of algal aggregates floating below the pycnocline was previously explained by accumulation at vertical density gradients [8,19,21]. However, in our experiment the aggregates sank after physical removal of air bubbles trapped
Figure 6. Conceptual model of the mechanisms responsible for the formation and fate of the different types of algal aggregates.(1) In early spring ice algal growth starts before that of phytoplankton. (2) In summer as the sea ice melts and nutrients become limiting, some sea-ice algae are released to the water column or grow into the water column. Due to their stickiness and the under-sea-ice turbulence they form aggregates. (3) In late summer melt ponds grow in depth and the sea-ice algae that are still in the ice are gradually exposed to very low salinities, high irradiances, and nutrient depletion making them accumulate and degrade in the pond. Depending on the environmental conditions, some sub-ice aggregates sink and others remain floating. (4) In early autumn, the melt ponds can either open completely allowing some phytoplankton species to come into the melt pond, or they can refreeze again, becoming second year ice. (5) In autumn those melt ponds that were open to the seawater freeze again, trapping the floating aggregates that were not grazed in the newly formed ice.
in the mucous matrix (Fig. 5). The salinity gradients might determine where aggregates accumulate, but density gradients were not the buoyancy regulating mechanisms per se. Both pennate and centric diatom-formed aggregates studied here showed gas bubbles trapped in the aggregates mucous matrix, which seem to be a relevant mechanism for aggregates to stay afloat. Previous physiological studies with another centric diatom have shown a correlation between increased light input and reduced sinking rates [81]. The results from our experiment that the sunken aggregates can regain buoyancy in situations favorable for photosynthesis, i.e. by increased light intensity, suggests that the balance between oxygen production by photosynthesis and consumption by respiration was the key factor for buoyancy regulation in the aggregates we investigated. Since aggregates are not closed systems, the rate of oxygen production plus the impeded diffusion across the mucus matrix of the aggregate minus oxygen consumption by the sea-ice algae themselves, bacteria and zooplankton, will determine the amount of gas available to maintain buoyancy [22]. However, further experiments are needed to confirm this hypothesis.
Other factors affecting buoyancy are the density of the aggregate. Diatoms exudates have been observed to be positively buoyant and to facilitate the attachment of bacteria to the aggregate [82]. Therefore, TEP do not only play an important role in aggregation but could also be important in buoyancy regulation. The TEP:POC ratios presented in this study (0.001–0.2) were generally lower than the ones reported for land fast sea ice in spring (0.08–0.72) [82], but in the same range reported for other marine diatom aggregates (,0.25; [83]) and higher than the TEP:POC ratios measured in the water column surrounding the aggregates.
Fate of the sea ice algal aggregates
Detrimental conditions to the aggregate community such as very low salinity from melt water, seawater warming, high grazing pressure, or nutrient depletion will eventually lead to buoyancy loss, degradation and sinking [9,15]. This could result in their accumulation at the bottom of melt ponds, or export to the sea floor [9,30]. White-yellowish aggregates of high TEP:POC, C:Chl
aand C:N ratios indicating substantial degradation of algal cells [43] were often found trapped in melt ponds where nutrients were depleted. Green-brownish aggregates contained more bacteria than white-yellowish, degraded aggregates, following the general correlation between bacterial abundance and Chl aobserved in the ocean [84], suggesting that labile carbon supplies from the algae to the bacteria are still present in green-brownish aggregates at the end of the season. Despite the fact that bacterial abundances per carbon weight were in the lower range of values published for Antarctic sea-ice [82], they were still two orders of magnitude higher (107–109cells mg POC21) than in the ambient water (105– 107 cells mg POC21) suggesting that aggregates are a rich substrate for bacteria. The higher concentrations of DOC in the aggregates compared to the average DOC concentrations of Arctic surface seawater [59] indicate that algal aggregates might be a source of DOC, in which carbon is rapidly remineralized.
Net heterotrophic conditions were measured in floating sea-ice algal aggregates during summer indicating a rapid decomposition of the algal biomass in the aggregates ([22] and this study, also see Figure S1, Table S1, and Table S2). Moreover, observations of photosynthetically active diatom cells in aggregates exported to the deep-sea [9] and subsequent oxygen depletion in the seafloor suggest rapid sedimentation and microbial remineralization of the aggregates. Nitrate production matched the ammonium consump-tion in theMelosiraaggregate slurry, suggesting that nitrification
might take place as well under photosynthetic conditions at high light intensities. This means that decaying algal aggregates could be sources of nitrate to the surrounding seawater in an otherwise nitrogen-limited system. Previously it has been speculated that internal nutrient regeneration by bacterial remineralization inside aggregates can support growth of at least a fraction of the algal population [85,86]. Denitrification, revealed by N2 production,
may occur in the anoxic center of intact aggregates [87], but the potentials encountered inMelosiraalgal slurry were low (0.002– 0.005mmol L21d 21). This could indicate that the aggregates might remove considerable amounts of carbon and nitrogen from surface waters by export. Using the aggregate carbon export of 9 g C m22estimated previously for 2012 (Boetius et al. 2013), and the
median C:N ratio of 10 of the fresh aggregates (n = 4), approximately 45% of carbon fixed as new production since last winter and 36% of surface nitrogen consumed by sea-ice algae and surface water phytoplankton was exported to depths.4000 m.
In conclusion, we suggest that pennate diatom and Melosira arctica-based ice-algal aggregates contribute substantially to nutrient and carbon cycling and export in the Arctic. Preliminary experiments suggest that their buoyancy is regulated by photo-synthetically-produced oxygen. With the current trend of warming of the Arctic causing sea ice retreat as well as thinning of the ice cover that increases drift speed, it is likely that sea-ice algae can grow faster and earlier in the season harvesting nutrients from a wider area of surface waters, but will more often meet unfavorable conditions during summer, e.g. nutrient limitation, freshening and melting of their habitat favoring aggregate formation and degradation. The advantages of the formation of aggregates compared to the single-cell or short-chain life style of pelagic sea ice algae is uncertain. Aggregation into large clumps and filaments may protect diatom species such asMelosira arctica from high irradiances. Trapping of gas bubbles in the aggregates enhancing floatation and eventually serving entrapment into the ice in late autumn might be another advantage. The intense nitrogen cycling observed in the aggregates indicates that they could play a role in nutrient cycling in the oligotrophic Arctic Ocean. It remains methodologically difficult, but important for a better understand-ing of carbon and nutrient budgets as well as for the ecology of the Arctic Ocean, to quantify temporal and regional variations in aggregate formation, distribution and fate on the ecosystem scale.
Supporting Information
Figure S1 Oxygen profile inside degrading pennate diatom aggregate (P5).Oxygen microprofiles (n = 3) measured using an oxygen microoptode (FireStingO2, PyroScience GmbH, Aachen, Germany) in a 5 cm diameter spherical pennate-diatom aggregate incubated in a beaker in the lab for 3 days at 50mmol
photons m22s21 and 21.3uC. Oxygen microprofiles across the water-aggregate interface were measured with steps of 0.5 mm and since the original spherical diatom aggregate started to flatten the diffusive oxygen uptake (DOU, mmol m22d21) was calculated using Fick’s first law of diffusion DOU = D0 (dC/dz), where D0
(cm22s21) is the molecular diffusion coefficient in water, C (mmol L21) is the solute concentration, and z (cm) is the depth within the
aggregate. The total oxygen consumption rate of the aggregate was calculated integrating the diffusive flux over the entire aggregate surface area [88]. Using a typical pennate-diatom aggregate size of 5 cm in diameter and a spherical shape (Volume of one aggregate = 0.06 L) the corresponding O2consumption rate
of a degrading pennate aggregate is 1.860.2 mmol O2L21d21
(n = 3). (TIFF)
Arctic Algal Aggregates
Table S1 Characteristics of pennate algal aggregates and sea ice stations investigated.
(DOCX)
Table S2 Characteristics of Melosira algal aggregates and sea ice stations investigated.
(DOCX)
Acknowledgments
We are most grateful to the crew of RV Polarstern and to our colleagues on board for their excellent cooperation during both Arctic cruises (PS78/3 and PS80/3). In particular we would like to thank Christian Katlein and Marcel Nicolaus for their under-ice images of the aggregates, and Christiane Uhlig, Anique Stecher, Hauke Flores, Catherine Lalande, Karl Attard and Judith Piontek for their help during the sampling. We also
thank Karel Bakker for the nutrient measurements and Dieter Janssen, Claudia Burau and Boris Koch for the DOC measurements. The technical support of Erika Allhusen, Christiane Lorenzen, Sandra Murawski and Mirja Meiners is also greatly appreciated. We are as well grateful to Eva-Maria No¨thig for the water column particulate carbon values and Kristin Hardge for help with microscopic identification. Fruitful discussions with Philipp Assmy and Victor Smetacek contributed to the development of the ideas presented in this study.
Author Contributions
Conceived and designed the experiments: MFM FW HLS RNG AB. Performed the experiments: MFM FW HLS. Analyzed the data: MFM FW IP HLS. Contributed reagents/materials/analysis tools: MFM FW IP HLS RNG AB. Contributed to the writing of the manuscript: MFM AB RG.
References
1. Stein R, Macdonald RW (2004) The Organic Carbon Cycle in the Arctic Ocean. 1st ed. Springer-Verlag Berlin Heidelberg GmbH.
2. Leu E, Søreide JEE, Hessen DOO, Falk-Petersen S, Berge J (2011) Consequences of changing sea-ice cover for primary and secondary producers in the European Arctic shelf seas: Timing, quantity, and quality. Prog Oceanogr 90: 18–32. doi:10.1016/j.pocean.2011.02.004.
3. Legendre L, Horner R, Ackley SF, Dieckmann GS, Gulliksen B, et al. (1992) Ecology of sea ice biota: 2. Global significance. Polar Biol 12: 429–444. doi:10.1007/BF00243113.
4. Hill VJ, Matrai PA, Olson E, Suttles S, Steele M, et al. (2013) Synthesis of integrated primary production in the Arctic Ocean: II. In situ and remotely sensed estimates. Prog Oceanogr 110: 107–125. doi:10.1016/j.pocean. 2012.11.005.
5. Gosselin M, Levasseur M, Wheeler PA, Horner RA, Boothg BC (1997) New measurements of phytoplankton and ice algal production in the Arctic Ocean. Deep Sea Res Part II 44: 1623–1644. doi:10.1016/S0967-0645(97)00054-4. 6. Soreide J, Leu E, Berge J, Graeve M, Falk-Petersen S, et al. (2010) Timing of
blooms, algal food quality andCalanus glacialisreproduction and growth in a changing Arctic. Glob Chang Biol 16: 3154–3163. doi:10.1111/j.1365-2486.2010.02175.x.
7. Bradstreet MSW, Cross WE (1982) Trophic relationships at high Arctic ice edges. Arctic 35: 1–12.
8. Assmy P, Ehn JK, Ferna´ndez-Me´ndez M, Hop H, Katlein C, et al. (2013) Floating ice-algal aggregates below melting Arctic sea ice. PLoS One 8: e76599. doi:10.1371/journal.pone.0076599.
9. Boetius A, Albrecht S, Bakker K, Bienhold C, Felden J, et al. (2013) Export of algal biomass from the melting Arctic sea ice. Science 339: 1430–1432. doi:10.1126/science.1231346.
10. Fahl K, No¨thig E-M (2007) Lithogenic and biogenic particle fluxes on the Lomonosov Ridge (central Arctic Ocean) and their relevance for sediment accumulation: Vertical vs. lateral transport. Deep Sea Res Part I 54: 1256–1272. doi:10.1016/j.dsr.2007.04.014.
11. Riedel A, Michel C, Poulin M, Lessard S (2003) Taxonomy and abundance of microalgae and protists at a first-year sea ice station near Resolute Bay, Nunavut Spring to Early Summer 2001.
12. Michel C, Ingram R, Harris L (2006) Variability in oceanographic and ecological processes in the Canadian Arctic Archipelago. Prog Oceanogr 71: 379–401. doi:10.1016/j.pocean.2006.09.006.
13. Quillfeldt C Von, Hegseth EN, Sakshaug E, Johnsen G, Syvertsen EE (2009) Ice algae. In: Sakshaug E, Johnsen G, Kovacs KM, editors. Ecosystem Barents Sea. Trondheim, Norway: Tapir Aacademic Press. pp. 285–302.
14. Melnikov IA (1977) The Arctic Sea Ice ecosystem. Amsterdam: Gordon and Breach Science Publishers.
15. Gutt J (1995) The occurrence of sub-ice algal aggregations off northeast Greenland. Polar Biol 15: 247–252. doi:10.1007/BF00239844.
16. Melnikov IA, Kolosova EG, Welch HE, Zhitina LS (2002) Sea ice biological communities and nutrient dynamics in the Canada Basin of the Arctic Ocean. Deep Sea Res Part I Oceanogr Res Pap 49: 1623–1649. doi:10.1016/S0967-0637(02)00042-0.
17. Poulin M, Underwood GJC, Michel C (2014) Sub-ice colonialMelosira arctica in Arctic first-year ice. Diatom Res 29: 1–9. doi:10.1080/0269249X. 2013.877085.
18. Gran H (1904) Diatomaceae from the ice-floes and plankton of the Arctic Ocean. Sci Res North Polar Exped 11: 1–74.
19. Nansen F (1906) Protozoa on the ice-floes of the North Polar Sea. Sci Res Norw North Polar Exped 1893–1896 5: 1–22.
20. Horner RA, Syvertsen EE, Thomas DP, Lange C (1988) Proposed Terminology and Reporting Units for Sea Ice Algal Assemblages. Polar Biol 8: 249–253. doi:10.1007/BF00263173.
21. Syvertsen EE (1991) Ice algae in the Barents Sea: types of assemblages, origin, fate and role in the ice-edge phytoplankton bloom. Proc Pro Mare Symp Polar Mar Ecol: 277–287.
22. Glud RN, Rysgaard S, Turner G, McGinnis DF, Leakey RJ (2014) Biological and physical induced oxygen dynamics in melting sea-ice of the Fram Strait. Limnol Oceanogr 59: 1097–1111. doi:10.4319/lo.2014.59.4.1097.
23. Kiorboe T, Andersen K, Dam H (1990) Coagulation efficiency and aggregate formation in marine phytoplankton. Mar Biol 107: 235–245. doi:10.1007/ BF01319822.
24. Smetacek VS (1985) Role of sinking in diatom life-history cycles: ecological, evolutionary and geological significance. Mar Biol 84: 239–251. doi:10.1007/ BF00392493.
25. Alldredge AL, Silver MW (1988) Characteristics, dynamics and significance of marine snow. Prog Oceanogr 20: 41–82. doi:10.1016/0079-6611(88)90053-5. 26. Jackson GA, Waite AM, Boyd PW (2005) Role of algal aggregation in vertical
carbon export during SOIREE and in other low biomass environments. Geophys Res Lett 32: L13607. doi:10.1029/2005GL023180.
27. Krembs C, Eicken H, Junge K, Deming JW (2002) High concentrations of exopolymeric substances in Arctic winter sea ice: implications for the polar ocean carbon cycle and cryoprotection of diatoms. Deep Sea Res Part I 49: 2163–2181. doi:10.1016/S0967-0637(02)00122-X.
28. Abdullahi AS, Underwood GJC, Gretz MR (2006) Extracellular matrix assembly in Diatoms (Bacillariophyceae). Environmental effects on polysaccha-ride synthesis in the model diatom,Phaeodactylum tricornutum. J Phycol 42: 363–378. doi:10.1111/j.1529-8817.2006.00193.x.
29. Aslam SN, Cresswell-Maynard T, Thomas DN, Underwood GJC (2012) Production and characterization of the intra- and extracelullar carbohydrates and polymeric substances (EPS) of three sea-ice diatom species, and evidence for a cryoprotective role for EPS. J Phycol 48: 1494–1509. doi:10.1111/jpy.12004. 30. Ambrose WG, Quillfeldt C Von, Clough LM, Tilney PVR, Tucker T (2005) The sub-ice algal community in the Chukchi sea: large- and small-scale patterns of abundance based on images from a remotely operated vehicle. Polar Biol 28: 784–795. doi:10.1007/s00300-005-0002-8.
31. Rothrock DA, Yu Y, Maykut GA (1999) Thinning of the Arctic sea-ice cover. Geophys Res Lett 26: 3469–3472. doi:10.1029/1999GL010863.
32. Stroeve JC, Serreze MC, Holland MM, Kay JE, Malanik J, et al. (2012) The Arctic’s rapidly shrinking sea ice cover: a research synthesis. Clim Change 110: 1005–1027. doi:10.1007/s10584-011-0101-1.
33. Nicolaus M, Katlein C, Maslanik J, Hendricks S (2012) Changes in Arctic sea ice result in increasing light transmittance and absorption. Geophys Res Lett 39: 1– 6. doi:10.1029/2012GL053738.
34. Li WKW, McLaughlin FA, Lovejoy C, Carmack EC (2009) Smallest algae thrive as the Arctic Ocean freshens. Science 326: 539. doi:10.1126/ science.1179798.
35. Carmack EC, Lovejoy C, Comeau M, Li WKW (2011) Arctic Ocean microbial community structure before and after the 2007 record sea ice minimum. PLoS One 6: e27492. doi:10.1371/journal.pone.0027492.
36. Slagstad D, Ellingsen IHH, Wassmann P (2011) Evaluating primary and secondary production in an Arctic Ocean void of summer sea ice: an experimental simulation approach. Prog Oceanogr 90: 117–131. doi:10.1016/ j.pocean.2011.02.009.
37. Brown ZW, Arrigo KR (2012) Contrasting trends in sea ice and primary production in the Bering Sea and Arctic Ocean. ICES J Mar Sci 69: 1180– 1193. doi:10.1093/icesjms/fss113.
38. Ji R, Jin M, Varpe Ø, Jil R, Varpe O (2013) Sea ice phenology and timing of primary production pulses in the Arctic Ocean. Glob Chang Biol 19: 734–741. doi:10.1111/gcb.12074.
39. Nicolaus M, Katlein C, Maslanik JA, Hendricks S (2012) Sea ice conditions during the POLARSTERN cruise ARK-XXVI/3 (TransArc) in 2011. PANGAEA. doi:doi:10.1594/PANGAEA.803312.
40. Perovich DK (1996) The Optical Properties of Sea Ice. Cold Reg Res Eng Lab Monograph: 1–31.
42. Engel A (2009) Determination of marine gel particles. In: Wurl O, editor. Practical Guidelines for the Analysis of Seawater. CRC Press. p. 18. 43. Engel A, Passow U (2001) Carbon and nitrogen content of transparent
exopolymer particles (TEP) in relation to their Alcian Blue adsorption. Mar Ecol Prog Ser 219: 1–10. doi:10.3354/meps219001.
44. Damm E, Helmke E, Thoms S, Schauer U, No¨thig E-M, et al. (2010) Methane production in aerobic oligotrophic surface water in the central Arctic Ocean. Biogeosciences 7: 1099–1108. doi:10.5194/bg-7-1099-2010.
45. Hobbie JE, Daley RJ, Jasper S (1977) Use of nuclepore filters for counting bacteria by fluorescence microscopy. Appl Environ Microbiol 33: 1225–1228. 46. Meyer-Riel L (1983) Benthic response to sedimentation events during autumn to
spring at a shallow water station in the Western Kiel Bight. Mar Biol 77: 247– 256. doi:10.1007/BF00395813.
47. Gradinger R, Friedrich C, Spindler M (1999) Abundance, biomass and composition of the sea ice biota of the Greenland Sea pack ice. Deep Sea Res Part II 46: 1457–1472. doi:10.1016/S0967-0645(99)00030-2.
48. Thomas DN, Dieckmann GS (2010) Sea Ice. Thomas DN, Dieckmann GS, editors West Sussex: Wiley-Blackwell.
49. Steemann Nielsen E (1952) The use of radio-active carbon (C14) for measuring organic production in the sea. J Cons Int Explor Mer 18: 117–140. 50. Peterson BJ (1980) Aquatic primary productivity and the14
C-CO2method: a history of the productivity problem. Ecology 11: 359–385. doi:10.1146/ annurev.es.11.110180.002043.
51. Gallegos CL, Platt T, Harrison WG, Irwin B (1983) Photosynthetic parameters of arctic marine phytoplankton: vertical variations and time scales of adaptation. Limnol Oceanogr 28: 698–708.
52. Klimant I, Ku¨hl M, Glud RNN, Holst G (1997) Optical measurement of oxygen and temperature in microscale: strategies and biological applications. Sensors Actuators B 39: 29–37. doi:10.1016/S0925-4005(97)80168-2.
53. McMinn A, Hegseth EN (2006) Sea ice primary productivity in the northern Barents Sea, spring 2004. Polar Biol 30: 289–294. doi:10.1007/s00300-006-0182-x.
54. Rysgaard S, Glud RN (2004) Anaerobic N2production in Arctic sea ice. Limnol Oceanogr 49: 86–94.
55. Dalsgaard T, Thamdrup B, Farı´as L, Peter Revsbech N (2012) Anammox and denitrification in the oxygen minimum zone of the eastern South Pacific. Limnol Oceanogr 57: 1331–1346. doi:10.4319/lo.2012.57.5.133.
56. Thamdrup B, Dalsgaard T (2002) Production of N2 through anaerobic ammonium oxidation coupled to nitrate reduction in marine sediments. Appl Environ Microbiol 68: 1312–1318. doi:10.1128/AEM.68.3.1312-1318.2002. 57. Bower C, Holm-Hansen T (1980) A salicylate-hypochlorite method for
determining ammonia in seawater. Can J Fish Aquat Sci 37: 794–798. 58. Braman RS, Hendrix SA (1989) Nanogram nitrite and nitrate determination in
environmental and biological materials by vanadiumv(III) reduction with chemiluminescence detection. Anal Chem 91: 2715–2718.
59. Wheeler PA, Gosselin M, Sherr E, Thibault D, Kirchman DL, et al. (1996) Active cycling or organic carbon in the central Arctic Ocean. Nature 380: 697– 699. doi:10.1038/380697a0.
60. Maslanik JA, Fowler C, Stroeve J, Drobot S, Zwally J, et al. (2007) A younger, thinner Arctic ice cover: increased potential for rapid, extensive sea-ice loss. Geophys Res Lett 34: L24501. doi:10.1029/2007GL032043.
61. Ro¨sel A, Kaleschke L (2012) Exceptional melt pond occurrence in the years 2007 and 2011 on the Arctic sea ice revealed from MODIS satellite data. J Geophys Res 117: 1–8. doi:10.1029/2011JC007869.
62. Sherr EB, Sherr BF, Wheeler PA, Thompson K (2003) Temporal and spatial variation in stocks of autotrophic and heterotrophic microbes in the upper water column of the central Arctic Ocean. Deep Sea Res Part I Oceanogr Res Pap 50: 557–571. doi:10.1016/S0967-0637(03)00031-1.
63. Bachy C, Lo´pez-Garcı´a P, Vereshchaka A, Moreira D (2011) Diversity and vertical distribution of microbial eukaryotes in the snow, sea ice and seawater near the north pole at the end of the polar night. Front Microbiol 2: 1–12. doi:10.3389/fmicb.2011.00106.
64. Juhl AR, Krembs C, Meiners KM (2011) Seasonal development and differential retention of ice algae and other organic fractions in first-year Arctic sea ice. Mar Ecol Prog Ser 436: 1–16. doi:10.3354/meps09277.
65. Riebesell U, Schloss I, Smetacek V (1991) Aggregation of algae released from melting sea ice: implications for seeding and sedimentation. Polar Biol 11: 239– 248. doi:10.1007/BF00238457.
66. Kiorboe T, Hansen JLS (1993) Phytoplankton aggregate formation: observations of patterns and mechanisms of cell sticking and the significance of exopolymeric material. J Plankton Res 15: 993–1018. doi:10.1093/plankt/15.9.993. 67. Eicken H, Krouse HR, Kadko D, Perovich DK (2002) Tracer studies of
pathways and rates of meltwater transport through Arctic summer sea ice. J Geophys Res 107: 8046. doi:10.1029/2000JC000583.
68. Lee SH, McRoy CPP, Joo HM, Gradinger R, Cui X, et al. (2011) Holes in progressively thinning Arctic sea ice lead to new ice algae habitat. Oceanography 24: 302–308. doi:10.5670/oceanog.2011.81.
69. Cota GF (1985) Photoadaptation of high Arctic ice algae. Nature 315: 219–222. 70. Manes SS, Gradinger R (2009) Small scale vertical gradients of Arctic ice algal photophysiological properties. Photosynth Res 102: 53–66. doi:10.1007/s11120-009-9489-0.
71. Arrigo K, Sullivan CW (1992) The influence of salinity and temperature covariation on the photophysiological characteristics of antarctic sea ice microalgae. J Phycol 28: 746–756. doi:10.1111/j.0022-3646.1992.00746.x. 72. Mari X, Burd A (1998) Seasonal size spectra of transparent exopolymeric
particles (TEP) in a coastal sea and comparison with those predicted using coagulation theory. Mar Ecol Prog Ser 163: 63–76. doi:doi:10.3354/ meps163063.
73. Dickie G (1852) Notes on the algae. In: Sutherland PC, editor. Journal of a Voyage in Baffin’s Bay and Barrow Straits in the years 1850–1851. (Longman, Brown, Green, and Longmans, London), Vol. II. pp. cxci–cc.
74. Wood MA, Van Valen LM (1990) Paradox lost? On the release of energy rich compounds by phytoplankton. Mar Microb Food Webs 4: 103–116. 75. Lalande C, Bauerfeind E, No¨thig E-M, Beszczynska-Mo¨ller A (2013) Impact of a
warm anomaly on export fluxes of biogenic matter in the eastern Fram Strait. Prog Oceanogr 109: 70–77. doi:10.1016/j.pocean.2012.09.006.
76. Poltermann M (2001) Arctic sea ice as feeding ground for amphipods – food sources and strategies. Polar Biol 24: 89–96. doi:10.1007/s003000000177. 77. Mundy C, Michel G, Jens KE, Claude B, Poulin M, et al. (2011) Characteristics
of two distinct high-light acclimated algal communities during advanced stages of sea ice melt. Polar Biol 34: 1869–1886. doi:10.1007/s00300-011-0998-x. 78. Zernova VV, No¨thig E-M, Shevchenko VP, Schevschenko VP (2000) Vertical
microalga flux in the northern Laptev Sea (From the data collected by the yearlong sediment trap). Oceanology 40: 850–858.
79. Watanabe E, Onodera J, Harada N, Honda MC, Kimoto K, et al. (2014) Enhanced role of eddies in the Arctic marine biological pump. Nature 5: 3950. doi:10.1038/ncomms4950.
80. Smayda TJ (1970) The suspension and sinking of phytoplankton in the sea. Oceanogr Mar Biol Annu Rev 8: 353–414.
81. Waite AM, Thompson PA, Harrison PJ (1992) Does energy control the sinking rates of marine diatoms? Limnol Oceanogr 37: 468–477. doi:10.4319/ lo.1992.37.3.0468.
82. Riedel A, Michel C, Gosselin M (2006) Seasonal study of sea-ice exopolymeric substances on the Mackenzie shelf: implications for transport of sea-ice bacteria and algae. Aquat Microb Ecol 45: 195–206. doi:10.3354/ame045195. 83. Piontek J, Ha¨ndel N, Langer G, Wohlers J, Riebesell U, et al. (2009) Effects of
rising temperature on the formation and microbial degradation of marine diatom aggregates. Aquat Microb Ecol 54: 305–318. doi:10.3354/ame01273. 84. Li WKH, Head EJH, Harrison WG (2004) Macroecological limits of
heterotrophic bacterial abundance in the ocean. Deep Sea Res I 51: 1529– 1540. doi:10.1016/j.dsr.2004.06.012.
85. Simon M, Grossart H-P, Schweitzer B, Ploug H (2002) Microbial ecology of organic aggregates in aquatic ecosystems. Aquat Microb Ecol 28: 175–211. doi:10.3354/ame028175.
86. Huston AL, Deming JW (2002) Relationships between microbial extra–cellular enzymatic activity and suspended and sinking particulate organic matter: seasonal transformations in the North Water. Deep Sea Res I 49: 22–23. doi:10.1016/S0967-0645(02)00186-8.
87. Lehto N, Glud R, Nordi G, Zang H, Davison W (2014) Anoxic microniches in marine sediments induced by aggregate settlement: Biogeochemical dynamics and implications. Biogeochemistry 119: 307–327. doi:10.1007/s10533-014-9967-0.
88. Iversen MH, Ploug H (2010) Ballast minerals and the sinking carbon flux in the ocean: carbon-specific respiration rates and sinking velocity of marine snow aggregates. Biogeosciences 7: 2613–2624. doi:10.5194/bg-7-2613-2010.
Arctic Algal Aggregates

![Table 2 compares the integrated phototrophic biomass of sea ice (1.2–1.4 m thickness), water column euphotic zone (12–18 m depth), and the two different types of aggregates investigated, including previous observations on pennate diatom [8,22] and Melosira](https://thumb-eu.123doks.com/thumbv2/123dok_br/18409043.359556/7.918.144.777.92.405/integrated-phototrophic-thickness-different-aggregates-investigated-including-observations.webp)

