A comparison of velocity measurements from the CUTLASS
Finland radar and the EISCAT UHF system
J. A. Davies, M. Lester, S. E. Milan, T. K. Yeoman
Department of Physics and Astronomy, University of Leicester, University Road, Leicester, LE1 7RH, UK
Received: 26 October 1998 / Revised: 25 January 1999 / Accepted: 26 January 1999
Abstract. The CUTLASS Finland radar, which com-prises an integral part of the SuperDARN system of HF coherent radars, provides near continuous observations of high-latitude plasma irregularities within a ®eld-of-view which extends over some four million square kilometres. Within the Finland radar ®eld-of-view lie both the EISCAT mainland and EISCAT Svalbard incoherent scatter radar facilities. Since the CUTLASS Finland radar commenced operation, in February 1995, the mainland EISCAT UHF radar has been run in common programme 1 and 2 modes for a total duration exceeding 1000 h. Simultaneous and spatially coincident returns from these two radars over this period provide the basis for a comparison of irregularity drift velocity and F-region ion velocity. Initial comparison is limited to velocities from four intervals of simultaneous radar returns; intervals are selected such that they exhibit a variety of velocity signatures including that character-istic of the convection reversal and a rapidly ¯uctuating velocity feature. Subsequent comparison is on a statis-tical basis. The velocities measured by the two systems demonstrate reasonable correspondence over the veloc-ity regime encountered during the simultaneous occur-rence of coherent and incoherent scatter; dieoccur-rences between the EISCAT UHF measurements of F-region ion drift and the irregularity drift velocities from the Finland radar are explained in terms of a number of contributing factors including contamination of the latter by E-region echoes, a factor which is investigated further, and the potentially deleterious eect of discrep-ant volume and time sampling intervals.
Key words. Ionosphere (ionospheric irregularities; plasma convection).
1 Introduction
Coherent scatter of radio waves o ®eld-aligned irreg-ularities in the ionosphere, as reviewed by for example Fejer and Kelly (1980) and Haldoupis (1989), provides measurements of the drift speed of the plasma irregu-larities along the radar look direction. VHF and UHF coherent radars, for example STARE (Greenwaldet al., 1978), SABRE (Nielsen et al., 1983) and COSCAT (McCrea et al., 1991), whose operating frequencies are signi®cantly greater than the ionospheric plasma fre-quency can, at high-latitude, only satisfy the orthogo-nality condition necessary for coherent backscatter in the E-region. For HF coherent radars, such as those which form the SuperDARN chain of auroral radars (e.g. Greenwald et al., 1995), orthogonality can be achieved in both the E- and F-regions due to the refractive nature of radio wave propagation in the 3 to 30 MHz frequency band, although this, and the eect of group retardation, results in increased diculty in determining the exact location of the scattering region. Electromagnetic radiation at HF frequencies is also subject to the eect of D-region absorption; such attenuation, being directly related to the plasma con-centration, is especially pronounced during times of highly energetic particle precipitation.
Early work, in which VHF coherent scatter observa-tions of the irregularity drift speed in the high-latitude E-region were compared to E´ B velocities measured with rocket borne probes (Cahill et al., 1978) and observations of F-region ion drift by the Chananika incoherent scatter radar (Eckland et al., 1977), was interpreted by its authors as demonstrating the equiv-alence of convective drift and the motion of small-scale irregularities in the E-region. The situation was made more complex after experimental and theoretical work on wave heating of the E-region electrons by St-Maurice
et al. (1981), Wickwar et al. (1981) and Schlegel and St-Maurice (1981). Subsequent work by Nielsen and
Schlegel (1983, 1985) and, more recently, Haldoupis and Schlegel (1990), in which the authors compared F-region plasma velocity measurements from the EISCAT UHF incoherent scatter radar to irregularity drift speed measurements from the STARE VHF radar, revealed that the phase velocity of the E-region irregularities was, in fact, limited in magnitude to near the ion-acoustic speed which, in general, lies within the range 400 to 600 m s)1. The phenomenon of phase velocity satura-tion encountered in the E-region is generally thought not to occur at F-region altitudes. Theoretical work suggests that the high-latitude F-region irregularities are generated by mechanisms with low phase velocities and that the motion of the irregularities is determined by the ambient plasma ¯ow (e.g. Ossakow and Chaturvedi, 1979; Keskinen and Ossakow, 1983).
Comparisons have also previously been performed between HF measurements of irregularity drift velocity in the F-region and observations of F-region plasma velocity. Villain et al. (1985) compared F-region irreg-ularity drift velocities from the SAFARI experiment, comprising two coherent HF radars, with simultaneous measurements of the ion vector velocity measured in a meridional scanning mode by the EISCAT UHF system. In addition, observations of F-region irregu-larity drift velocity from the HF radar at Goose Bay have been compared to line-of-sight ion velocities measured at F-region altitudes by the incoherent scatter radar at Sondre Stromfjord (Ruohoniemi et al., 1987). The dual radar studies of both Villainet al.(1995) and Ruohoniemi et al. (1987) provided evidence of the equality of F-region ion plasma and irregularity drift velocities, to velocities approaching some 1000 m s)1. Baker et al. (1990) compared F-region drift velocity measurements from the DMSP-F9 satellite to irregu-larity drift velocity measurements from the HF coher-ent radar sited at Halley Bay in Antarctica; the authors also noted that the measured velocities exhibited a good correspondence to velocities approaching some 1500 m s)1.
Recently, Eglitis et al. (1998) compared the phase speed of ®eld-aligned irregularities observed by the CUTLASS Finland HF coherent scatter radar, part of the SuperDARN chain like those at Goose Bay and Halley Bay, with F-region ion velocities from the EISCAT UHF system. In contrast to that mentioned previously, in the work of Eglitis et al. (1998) coherent scatter was from ®eld-aligned irregularities arti®cially generated as a result of ionospheric modi®cation exper-iments using the heater at Tromsù. The results of Eglitis
et al. (1998) concurred with those of authors of similar work (Hedberget al., 1983; Hanuiseet al., 1986; Noble
et al., 1987) who had previously found that arti®cial ®eld-aligned irregularities drifted with the background plasma motion. The present study diers from that of Eglitis et al. (1998) in that F-region ion velocities observed with the EISCAT UHF radar are compared with the phase velocities of naturally occurring irregu-larities measured by the Finland element of the CUT-LASS radar system.
2 Experimental arrangement
As noted at the end of the previous section, this paper presents preliminary results of a comparison of observed velocities from EISCAT with those from the CUTLASS Finland radar. This section contains brief description of the two systems and the data sets therefrom.
CUTLASS: CUTLASS (The Co-operative UK Twin Located Auroral Sounding System), which comprises two HF coherent radars, one located at Hankasalmi in Finland and the other at Pykkvibñr in Iceland, forms the most easterly pair of the SuperDARN chain of HF coherent scatter radars which covers almost 180° in
longitude in the Northern Hemisphere and includes conjugate Antarctic stations (e.g. Greenwald et al., 1995). Although further discussion refers to the CUT-LASS Finland radar, which commenced operation in March 1995, much of the more general information is also applicable to the Iceland component of the CUTLASS system.
The Finland radar can operate at speci®c frequencies within the range 8 to 20 MHz, although the operating frequency is typically near 10 MHz corresponding to a scattering irregularity wavelength of 15 m. Phasing the 16 main antennas with respect to one another forms an antenna pattern in which the maximum gain has one of 16 azimuthal pointing directions separated by approx-imately 3.2°, distributed symmetrically about the
Fin-land radar boresite of)12°(i.e. west of north). Standard operation of the radar currently involves sounding sequentially on all 16 beams (numbered clockwise 0 to 15) with a dwell time of 7 s, giving a full scan of backscatter with an azimuthal coverage of over 50°
roughly ever 112 s; scans are, however, synchronised to start on two minute boundaries. 75 range gates are sampled (here numbered 0 to 74) along each beam with a pulse length of 300ls, corresponding to a gate length of 45 km, and a lag to the ®rst range of 1200ls (180 km). Other experiment modes can, however, in-volve more limited scans, in some cases limited to a single beam, reduced gate lengths of 30 or even 15 km or a modi®ed lag to ®rst range. Experiments have been run in which the dwell time on a beam is reduced to only 1 s. A multi-pulse scheme, comprising seven sub-pulses, is transmitted, allowing the power and spectral width of the backscattered signal to be estimated by a functional ®t to the decorrelation of the autocorrelation function within each range cell. The line-of-sight Doppler veloc-ity of the irregularities is determined by a least-squares ®t to the phase of the complex value of the auto-correlation function. An interferometer comprising four antennas allows the backscatter elevation to be deter-mined from the phase dierence between signals re-ceived at the main and interferometer arrays.
Finland. For the purpose of the present study, obser-vations from the two most frequently run EISCAT UHF common programmes, CP-1 and CP-2 (e.g. Rishbeth and Williams, 1985), are employed, in versions K and E respectively. Brief descriptions of these programmes are included.
In the EISCAT CP-1 mode, the beam from the UHF transmitter, of half-power beam width 0.6°, is aligned along the local F-region magnetic ®eld direction which is at an elevation of around 77°and a geographic azimuth
of 182°. In version K of CP-1, the remote site radars
intersect the transmitter beam at a single F-region altitude; previous versions, incidentally, included both F- and E-region tristatic intersection points. In CP-2, the transmitter performs a four position scan, one position of which is ®eld-aligned, another vertical and the remaining two, directed south-eastward. The dwell time for each position of the scan is 90 s, giving a total cycle time of 6 min. The remote site radars follow the transmitter beam scan, providing tristatic observations again at a single F-region altitude.
CP-1-K and CP-2-E comprise identical pulse schemes. A long pulse scheme is transmitted for low-altitude resolution F-region measurements, in addition to alternating code transmission for high-resolution observations at E-region altitudes. The long pulse measurements, which provide the basis of the present study, yield an altitude resolution of 22 km along the magnetic ®eld direction, from around 150 to 600 km altitude, although the actual signal gates overlap to some extent. Received signals are integrated over 5 s.
CP-1-K observations from each site were post-inte-grated at a temporal resolution of 2 min and CP-2-E observations were post-integrated over the dwell time at each scan position. Standard incoherent scatter analysis was performed, providing estimates of ion and electron temperature, plasma density and line-of-sight ion veloc-ity. Notwithstanding the ability to measure those ionospheric parameters which is standard amongst incoherent scatter radars, the unique tristatic nature of the EISCAT UHF radar allows the full ion vector velocity to be determined within the intersection volume of the three receiver beams.
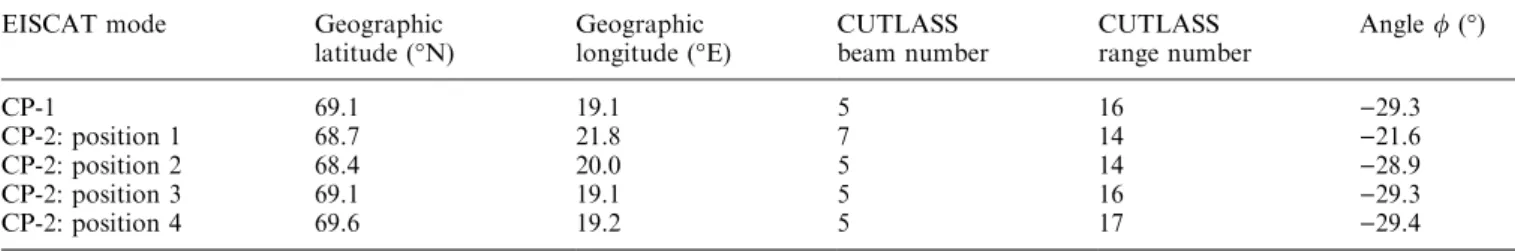
The locations in geographic co-ordinates, of the F-region tristatic volume for EISCAT CP-1 and the four pointing directions of CP-2 are contained within Table 1. The intersection volumes are also expressed in terms of their position within the CUTLASS Finland
radar ®eld-of-view. In order to calculate the Finland radar range cell corresponding to each of the EISCAT intersection volumes, some assumptions are made regarding the propagation of HF waves, the beams are assumed to travel in straight lines, i.e. refraction eects are neglected, and group retardation is ignored. Although a rigorous ray tracing technique would be necessary to identify accurately the location of the HF scattering region, arti®cial modi®cation experiments over Tromsù (e.g. Bond et al., 1997) do indicate that the position of the scattering region appears to be fairly well described. This concurs with the conclusion of Ruohoniemi et al. (1987) that the deviations from free space propagation are small ± far less than the length of a single range cell. For each EISCAT beam direction the value of/given in Table 1 represents the angle that the Finland radar beam makes to local geomagnetic north within that range cell, determined from the Interna-tional Geomagnetic Reference Field (IGRF) model; negative angles indicate a beam oriented west of magnetic north.
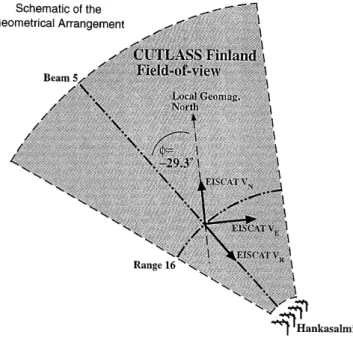
In order that true comparison be made between the velocities measured by the two systems, the component of the EISCAT ion velocity is resolved along the direction of the CUTLASS Finland radar beam within the range cell spatially coincident with the EISCAT tristatic observations. This is represented schematically, at least for CP-1 and the ®eld-aligned position of CP-2 (position 3), in Fig. 1. For ®eld-aligned UHF antenna pointing, the F-region intersection volume lies within range gate 16 of beam 5 of the Finland radar ®eld-of-view; in this range cell the CUTLASS beam is directed some 29.3°counter clockwise of local geomagnetic north (see Table 1).
For each pointing direction of the EISCAT radar, the component of the ion velocity resolved along the CUTLASS beam, VR, may be calculated, using the
appropriate value of /from Table 1, from the expres-sion
VR ÿVEsin/ÿVNcos/ 1
whereVN and VE indicate the ®eld-perpendicular
north-ward and eastnorth-ward components of the ion drift velocity, respectively.VRis de®ned such that it is in the same sense
as the CUTLASS velocities which are, by convention, positive towards the radar. It should also be noted that in resolving the EISCAT velocity along the CUTLASS beam, ®eld-parallel drifts can be neglected since
Table 1. Location of the F-region tristatic volume for EISCAT CP-1 and the four pointing directions of CP-2, in terms of both geographic co-ordinates and position within the CUTLASS Finland
radar ®eld-of-view. For each position,/represents the angle, within that range cell, made by the CUTLASS beam to local geomagnetic north, negative indicating a north-westwards oriented beam
EISCAT mode Geographic
latitude (°N)
Geographic longitude (°E)
CUTLASS beam number
CUTLASS range number
Angle/(°)
CP-1 69.1 19.1 5 16 )29.3
CP-2: position 1 68.7 21.8 7 14 )21.6
CP-2: position 2 68.4 20.0 5 14 )28.9
CP-2: position 3 69.1 19.1 5 16 )29.3
coherent scatter requires the radar wave vector to be near orthogonal to the magnetic ®eld.
Since the CUTLASS Finland radar commenced operation, in February 1995, the mainland EISCAT UHF radar has been run in common programme 1 and 2 modes for a total time exceeding some 1000 hours. During this 1000 h, however, coherent returns from the Finland radar are observed in the vicinity of the EISCAT site for a time totalling less than 4 h, a consequence of the limiting nature of HF propagation in the nearer ranges of the Finland system.
3 Results
Figures 2, 3 and 4 present EISCAT UHF and CUT-LASS Finland radar observations of velocity from four selected intervals which were selected as they exhibit a variety of dierent velocity signatures. It should be reiterated that the location of the EISCAT UHF radar within the CUTLASS Finland radar ®eld-of-view is by no means optimum for such a comparison as the nature of HF propagation severely limits Finland radar returns from the vicinity of EISCAT (Milanet al., 1997); this is indeed even more applicable to the location of EISCAT within the CUTLASS Iceland ®eld-of-view. In each of the following ®gures, EISCAT ion drift velocities where any of the three UHF receiver sites has a signal-to-noise
ratio of less than 2% have been excluded. Moreover, CUTLASS velocities deduced from spectra which are attributed to ground scatter (Milan et al., 1997) have been excluded and a power threshold of 3 dB has been applied to the data. Ground scatter is characterised by a combination of low line-of-sight velocity and low spectral width, roughly 50 m s)1 and 20 m s)1 respec-tively.
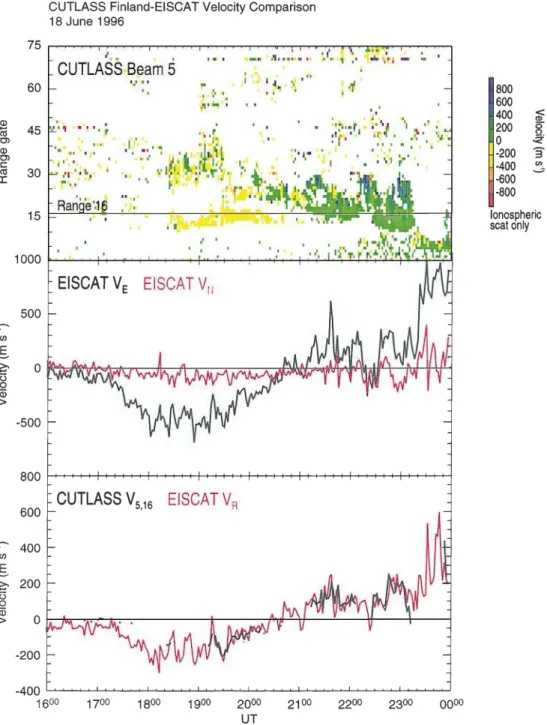
Figure 2 illustrates EISCAT and CUTLASS Finland velocity measurements from 1600 to 2400 UT on 18 June, 1996. During this interval, the CUTLASS Finland radar was operating in its standard mode, in which beam 5 is sounded for some 7 s out of the full scan of 2 min duration. The top panel of Fig. 2 illustrates irregularity drift velocities from the Finland radar as a function of both time and range gate along beam 5; positive velocities indicate motion towards the radar. The central panel presents time series of both the northward (VN: red line) and eastward (VE: black line)
®eld-perpendicular ion velocity components measured by EISCAT at the F-region tristatic altitude. The bottom panel illustrates the CUTLASS velocity coinci-dent with the location of the tristatic EISCAT measure-ments, beam 5, range 16 in the case of CP-1 (black line), and the component of the ion velocity resolved along the Finland beam (VR: red line); again positive velocities are
towards the Finland radar. As noted previously, CP-1-K observations are integrated at a temporal resolution of 2 min.
The variation of the F-region ion velocity measured by the EISCAT UHF radar during this interval (Fig. 2: central panel) illustrates observations in the vicinity of the nightside convection reversal with its characteristic transition of the zonal velocity component from west-ward to eastwest-ward ¯ow. The westwest-ward F-region ion velocity increases between 1600 and 1900 UT as the auroral zone moves over the EISCAT mainland site towards magnetic midnight (MLTUT+2 at Trom-sù). The large variations in both the zonal and meridional ion velocity in the post-magnetic midnight sector are associated with substorm activity. The CUT-LASS Finland radar observes coherent scatter, from ionospheric irregularities, in both the westward and eastward convection cells (top panel). Along beam 5, a narrow band of scatter centred around range gate 15 is observed between approximately 1900 and 2100 UT, characterised by velocities away from the Finland radar. A more latitudinally extended region of scatter, princi-pally associated with velocities towards the radar, is evident from 2000 UT. This region moves equatorward from around range gate 25 into the CP-1 viewing area sometime after 2120 UT. As beam 5 of the Finland radar is oriented counter clockwise of local geomagnetic north, westward and eastward velocities would be manifested as motion away from and towards the Finland radar, respectively. Thus the observed motions are consistent at least with the expected sense of the large-scale convection. The simultaneous occurrence of irregularity drift towards and away from the Finland radar between 2000 and 2100 UT, with the former at farther range gates, illustrates the displacement to earlier Fig. 1. Schematic diagram illustrating the geometrical arrangement
local times of the location of the nightside convection reversal at higher latitudes. Notably, the dramatic increase in the eastward F-region ion velocity which is observed by the UHF radar around 2320 UT signals the cessation of coherent returns in the vicinity of mainland EISCAT site, almost certainly a consequence of sub-storm associated absorption to which radio frequencies within the HF band are prone (e.g. Milanet al., 1996). Yeoman and LuÈhr (1997) present similar `bite outs' in CUTLASS returns during substorms.
The line-of-sight irregularity drift velocity measured by the CUTLASS Finland radar in range gate 16 of beam 5 demonstrates an excellent correspondence to the component of the F-region ion velocity, the latter measured by the EISCAT UHF radar and resolved along the Finland beam (see bottom panel). This is
equally true for observations in both the eastward and westward convection cells and is remarkable given the potential sources of discrepancy which are discussed in the following section.
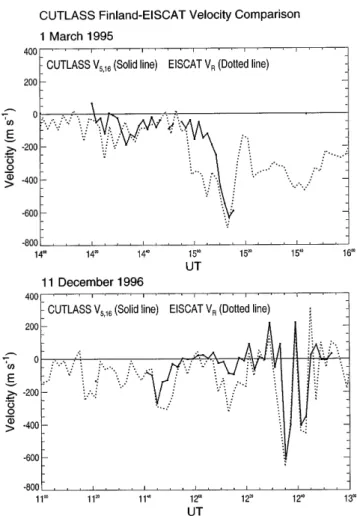
Figure 3 illustrates observations from two other intervals of simultaneous EISCAT and CUTLASS Fin-land returns, namely 1400 to 1600 UT on 1 March, 1995 (top panel) and 1100 to 1300 UT on 11 December, 1996 (bottom panel). During both of these intervals, as for the data presented in Fig. 2, the Finland radar was operating in its standard mode and the EISCAT UHF radar was running CP-1. The format of both panels is identical to that of the lower panel of Fig. 2, illustrating the CUT-LASS velocity coincident with the location of the tristatic EISCAT measurements, beam 5, range gate 16 (solid line), and the component of the ion velocity resolved
Fig. 2. EISCAT CP-1 and CUTLASS Finland velocity measurements from 1600 to 2400 UT on 18 June, 1996. The upper panel illustrates irregularity drift velocities from the Finland radar as a function of time and range gate along beam 5 (positive towards the radar). The middle panel presents time series of both ®eld-perpendicular ion velocity components measured by EI-SCAT at the F-region tristatic altitude; the northward and eastward components (VNand
VE) are represented by thered
andblack lines, respectively. The
lower panelillustrates the CUT-LASS velocity spatially coinci-dent with the location of tristatic EISCAT measurements, i.e. from range gate 16 of beam 5 (V5,16;black line), and the
com-ponent of the EISCAT velocity resolved along the direction of the CUTLASS beam within range gate 16 of beam 5 (VR;red
along the Finland beam (VR: dashed line); again positive
velocities are towards the Finland radar.
At 1400 UT on 1 March, 1995 the F-region ion velocity observed by the EISCAT UHF radar (not shown) is low, less than several hundred m s)1. The ion velocity remains relatively low until 1500 UT, after which time it demonstrates a marked enhancement which is associated with an increase, in the westward direction, of its zonal component. Subsequent to attaining a maximum value of 1600 m s)1, slightly prior to 1515 UT, the ion velocity slowly reduces. CUTLASS Finland radar coherent returns (again not shown) appear in the vicinity of the EISCAT mainland site at around 1420 UT, taking the form of a band of ionospheric scatter limited, at least along beam 5, to some 500 km in latitudinal extent. The region of scatter is characterised, in general, low line-of-sight irregularity drift velocities directed away from the radar, except between 1510 and 1530 UT when a narrow band of increased velocities (again directed away from the radar) is observed at its poleward boundary. After about 1520 UT, the band of scatter narrows and moves well
equatorward, out of the EISCAT CP-1 viewing area. Comparison of the line-of-sight irregularity drift veloc-ity from range gate 16 of beam 5 of the CUTLASS Finland radar with the component of the F-region ion velocity resolved along the Finland beam direction in this range cell (Fig. 3: upper panel) reveals general agreement over much of the interval of coherent returns. Prior to 1500 UT, in the low F-region ion velocity regime, the ion velocity component compares well with the irregularity drift velocity measurement. Between 1500 and 1510 UT, however, the two velocities show a marked discrepancy, as the ion velocity begins to increase whereas the irregularity drift velocity remains low; any of a number of possible factors could contrib-ute to this disparity (see Sect. 4). The maximum value attained by the irregularity drift velocity around 1515 UT, however, coincides temporally with the peak in ion velocity and is comparable in value to the component of the EISCAT ion velocity resolved along Fig. 3. EISCAT CP-1 and CUTLASS Finland velocity
measure-ments from 1400 to 1600 UT on 1 March, 1995 (upper panel) and from 1100 to 1300 UT on 11 December, 1996 (lower panel). Each panel illustrates the CUTLASS velocity spatially coincident with the location of tristatic EISCAT measurements (V5,16: solid line,) and
the component of the EISCAT velocity resolved along the direction of the CUTLASS beam within range gate 16 of beam 5 (VR:dotted line); again positive velocities indicate motion towards the Finland radar
the CUTLASS beam. The post peak decrease in ion velocity is not accompanied by any estimates of irreg-ularity drift velocity since the patch of coherent returns moves equatorward of the CP-1 viewing area.
Coherent returns are observed by the Finland HF radar in the proximity of EISCAT between about 1140 and 1300 UT on 11 December, 1996, spanning up to 15 range gates along beam 5 (not shown). Until 1230 UT, the line-of-sight irregularity drift velocities in this region of scatter are predominantly away from the radar, consistent with the westward ¯ow which would be associated with large scale convection at these local times. After this time, CUTLASS observes within this region of scatter what could be described as a number of distinct velocity enhancements, both towards and away from the radar, on a low velocity background. Com-paring the line-of-sight irregularity drift velocity, mea-sured by the CUTLASS Finland radar within the range gate coincident with EISCAT CP-1 tristatic observa-tions, with the resolved component of the F-region ion velocity from this interval again yields encouraging results, speci®cally with respect to the velocity enhance-ments mentioned previously (Fig. 3: lower panel). The spikes in the resolved F-region ion velocity component (dashed line) at 1235 and 1245 UT (which correspond to a series of westward bursts observed in the F-region ion velocity by EISCAT, the largest of which has a magnitude approaching 1500 m s)1) are reproduced in the irregularity drift velocity observed in range gate 16 of beam 5 (solid line), both temporally and in magni-tude. Between 1205 and 1220 UT, however, the drift velocity of the irregularities consistently underestimates the F-region ion velocity component, possible reasons for which will be discussed in the next section. What is notable, though, is the high correlation between the velocities of the irregularities and the bulk plasma ¯ow during an interval exhibiting rapid ¯uctuations; without the bene®t of observations from both radars, the ¯uctuations in either may have been dismissed as anomalous spikes.
Velocity measurements taken by the two radar systems between 1200 and 1400 in 20 March, 1996, are presented in Fig. 5. During this interval the EISCAT UHF radar was operating in the CP-2, four position scan. The CUTLASS Finland radar was operating not in its standard scan pattern, but rather in a mode in which beams 0 to 15 are scanned but between each beam the radar returns to beam 5 (i.e. beams 0, 5, 1, 5, 2, 5,
¼.14, 5, 15, 5); the scan is said to `camp' on beam 5.
Thus, whilst the other beams are sounded for 7 s every four minutes, beam 5 is sounded for 7 s out of every 14 s. The four panels, from the top, illustrate, as solid lines, the irregularity drift velocities measured by the Finland radar, during this two hour interval, in range gate 14 of beam 7, range gate 14 of beam 5, range gate 16 of beam 5 and range gate 17 of beam 5; these range cells correspond to the locations of the tristatic volumes of each of the four pointing directions of CP-2 (see Table 1). For each panel the component of the tristatic ion velocity, resolved along the CUTLASS Finland radar beam within that range cell, is represented by a
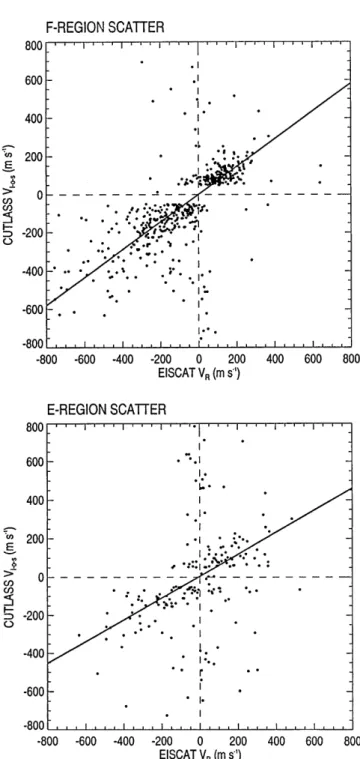
dotted line. As in previous ®gures, positive velocities represent motion towards the CUTLASS Finland radar. For all of the four tristatic positions of the scan, which are separated in horizontal distance by at most 150 km, the zonal ion velocity measured by the UHF Fig. 5. Scatter plot of line-of-sight irregularity drift velocity measured by the CUTLASS Finland radar against the component of the EISCAT ion velocity resolved along the CUTLASS beam direction in the range cell appropriate to the EISCAT observations. Theupper
radar remains consistently westward throughout the interval (not shown). In contrast, the meridional F-region ion velocity component ¯uctuates frequently between northward and southward ¯ow, with values low compared to the east-west component. The Finland radar observes a band of scatter, with associated velocities towards the radar, over EISCAT between 1240 and 1400 UT.
The resolution of the Finland radar velocities in beam 7, as illustrated in the uppermost panel, is clearly less than that in beam 5, the latter being the camp beam. The comparison of irregularity drift velocity and F-region ion velocity for this ®gure do not, on initial examination, seem as satisfying as those in the three previous ®gures, although the velocities are of similar magnitude and in the same sense. Closer examination, however, reveals that some individual features are reproduced well in both the velocities derived from both coherent and incoherent scatter methods, such as the increases observed in beam 5, range 14 between 1300 and 1315 UT and in beam 5, range 16 shortly after 1340 UT. The most obvious explanation for the disparity between the irregularity drift velocity and ion velocity estimates during this interval results from the marked dierence in the integration times of both datasets.
In brief summary, the irregularity drift velocity measured by the CUTLASS Finland radar appears, for these intervals at least, well correlated with the component of the ion velocity from the EISCAT UHF system, at least over the velocity regime encountered which is limited by the low magnetic azimuth of CUTLASS observations in the vicinity of EISCAT. The correspondence is particularly impressive given the dierences inherent in the systems and the observations.
4 Discussion
One obvious potential problem in the comparison of velocities measured by the EISCAT and CUTLASS Finland radars is the dierent times over which the data are integrated. As noted previously, EISCAT CP-1-K velocity measurements are post-integrated at 120 s resolution. For CP-2-E, observations are integrated over the dwell time in each position of the four position scan, giving, for each pointing direction, data integrated over some 90 s out of the total cycle time of 6 min.
For the intervals presented in Figs. 2, 3 and 4, CP-1 observations, integrated over 2 min, are compared with measurements from beam 5 of the normal mode of operation of the Finland radar, the latter being integrat-ed for only 7 s out of the total scan time of 2 minutes. It is clear that any variations in the velocity on a time scale of less than 2 min will potentially result in a discrepancy between the estimates of velocity from the two radar systems. This situation is, if anything, worse for the interval presented in Fig. 4, in which UHF ion velocity estimates available only every 6 min and integrated over 90 s are compared with irregularity drift velocities from beams which are themselves sounded for 7 s every 4 min in the case of beam 7 and for seven out of every 14 s in
the case of beam 5. Obviously, reanalysing the EISCAT data at an integration time more in line with that of the CUTLASS data could theoretically go some way to eliminating this source of discrepancy, but for the solar minimum conditions under which the present study is undertaken, the signal-to-noise ratio of the data is not sucient to support the reanalysis of the data to much smaller integration periods.
Another possible cause of discrepancy arises due to the dierence in the size of the scattering volumes, a single CUTLASS range cell being nearly two orders of magnitude larger than the tristatic volume illuminated by EISCAT. Any spatial gradients in velocity which exist within a Finland radar range cell would no doubt contribute to dierences in the velocities measured by the two systems. A guide to judging whether spatial gradients are signi®cant is the comparison of velocities from adjacent range cells. There are instances, during the intervals presented earlier where there are substan-tial dierences in the line-of-sight irregularity drift velocities observed in adjacent range cells and, con-versely, instances where the irregularity velocity remains relatively constant over spatial scales of the order of hundred of kilometres. One notable example of the latter is over the interval presented in Fig. 2, which would perhaps be anticipated given the large-scale nature of the convection pattern compared with, for example, signatures associated with substorm processes. It might be imagined that spatial gradients within the CUTLASS range gate could account for the signi®cant dierence in the irregularity drift velocity and the ion velocity along the CUTLASS beam between 1500 and 1510 UT on 1 March, 1996 (see Fig. 3: upper panel); evidence suggests this is not the case since the increase in the irregularity drift velocity is simultaneous in each of the eight surrounding range cells. However, it is spec-ulated that gradients in velocity may be at least partially responsible for the dierence between the velocities measured by the two systems between 1140 and 1220 UT on 11 December, 1996 (Fig. 3: lower panel) as the irregularity drift velocity diers by as much as 200 m s)1 between adjacent range gates.
Although, as mentioned previously, arti®cial modi®-cation experiments over Tromsù indicate that the position of the scattering region appears to be fairly well described, the complex nature of HF propagation will nevertheless contribute something to the discrepan-cy between the location of EISCAT and CUTLASS Finland observations, especially for a region of scatter limited in latitudinal extent. Moreover, the assumption of a straight line ray path of HF could contribute to inaccuracies in the beam direction assumed in resolving the EISCAT velocity.
though to be generated by mechanisms with low-phase velocities and the motion of the irregularities is indeed determined by the ambient plasma ¯ow. The phase velocity of irregularities generated at E-region altitudes, on the other hand, is limited in magnitude to near the ion-acoustic speed which is typically between 400 and 600 m s)1. The mainland EISCAT site is not distant enough from the site of the CUTLASS Finland to guarantee that any scatter observed thereat will be from the F-region, indeed under conditions of a large auroral E-region, coherent scatter over EISCAT would almost certainly be from E-region irregularities. It is not trival to distinguish between E-and F-region scatter, especially since some spectra may comprise components from both altitude ranges. Moreover, the low magnetic azimuth of beams 5 and 7 limit the size of the line-of-sight irregularity drift velocities which will be observed along these beams, such that any possible velocity saturation eect will be hard to ascertain. However some attempt has been made to distinguish between the two on the basis of interferometric angle-of-arrival evidence. The interferometer at Finland commenced operation in November, 1995, such that it was operational for three of the four intervals of data illustrated previously. There is, indeed, evidence that scatter from part of at least one of these intervals is from E-region irregularities. Be-tween 1230 and 1250 UT on 11 December 1996 (Fig 3: lower panel), the low elevation angles derived from interferometer measurements of phase delay are consis-tent with those which would be anticipated from scatter from E-region irregularities. It is ironic that this interval contains some of the highest irregularity phase velocities observed in conjunction with ion drift estimates and that the two are in such good agreement.
Although the previous section presents some of the more extensive intervals of simultaneous incoherent and coherent scatter returns, all of the available EISCAT CP-1-K and CP-2-E and Finland radar observations are used to compare statistically the relationship between the drift speed of the irregularities and the bulk ion ¯ow. Figure 5 presents scatter plots of irregularities drift velocity measured by the CUTLASS Finland radar versus the component of the EISCAT ion velocity resolved along the CUTLASS beam, derived from coincident returns over that part of the data set which has associated interferometric measurements, i.e. data taken after November, 1995. The upper panel is derived from those measurements of irregularity drift velocity identi®ed as originating from F-region alti-tudes; CUTLASS measurements in the lower panel are from the E-region. In both panels, positive velocities indicate those towards the CUTLASS radar. As in the previous ®gures, a signal-to-noise threshold of 2% is imposed on the EISCAT measurements; CUTLASS Finland radar returns are subject to a power threshold of 3 dB. The solid lines in the upper and lower panels indicate best ®t lines to F- and E-region scatter, respectively. In situations where there is more than one estimate of the irregularity drift velocity within a single EISCAT integration interval, these have been averaged together.
There is a preponderance of low irregularity drift velocity measurements corresponding to the full range of EISCAT ion velocity measurements, of which at least some, it is speculated, are due to misidenti®ed CUT-LASS ground scatter. In an attempt to remove these, Finland radar data with a line-of-sight irregularity drift velocity less than 50 m s)1 is excluded, although the average of the irregularity drift velocity over a given EISCAT integration may still be less than 50 m s)1. This has the eect of reducing the number of velocity pairs to some 750 from an initial number of around 1200. The ®gure reveals a number of points corresponding to anomalously high values of irregularity drift velocity, these are probably attributable to uncorrelated spikes in the CULTASS Finland radar observations like those which can be seen in the data presented in Fig. 4 from beam 5 of range 14; speci®c range gates are more prone to contamination of this type. The ®ts to E- and F-region scatter are distinctly dierent. Least squares ®tting to the data yields slopes of 0.57 and 0.73 for E-and F-region, respectively. The number of velocity pairs in the scattergram in which the irregularity drift velocity is identi®ed as being from E-region echoes (231) is around 40% of the number identi®ed as originating from F-region scatter (525).
It is pertinent to compare, and contrast, these results to those of Villain et al. (1995), Ruohoniemi et al.
(1987), Baker et al. (1990) and Eglitis et al. (1998). Villainet al. (1985) compared the drift velocities of 10 m F-region irregularities, measured by the SAFARI sys-tem on 10 December, 1983, with simultaneous measure-ments of the ion vector measured in a meridional scanning mode by the EISCAT UHF radar. The SAFARI (Scandinavia and French auroral radar inves-tigation) system comprised a pair of HF radars, one at Lycksele, Sweden, the other at Oulu in Finland. The comparison of Villainet al. (1985) was limited to only 6 spectra from each HF site, although the authors compared projections of the F-region ion drift along the line-of-sight of the both HF radars and the resultant vectors from the two systems. Villain et al. (1985) concluded that their study yielded compelling evidence of the equality of F-region plasma and irregularity drift velocities while conceding that this result was only con®ned to a limited time interval and valid only for the range of velocities encountered during their observa-tions, velocities up to 900 m s)1. Similarly, the study of Bakeret al.(1990), in which the authors compared time series of the drift velocity of 10 m irregularities mea-sured by the antarctic Halley Bay HF radar to obser-vations from the horizontal plasma driftmeter on board the DMSP-F9 satellite, was limited, in this case to a single overpass of cusp region. In order to compare the plasma drift observed by the spacecraft with the HF radar velocities determined along its track, Bakeret al.
large variations, was smoothed over a spatial scale approximately equal to the radar range resolution; interestingly, the radar velocities were generally some-what lower than the smoothed spacecraft velocities over the limited interval of the study.
Ruohoniemi et al. (1987) compared observations of the drift velocity of 13.9 m irregularities from the HF radar at Goose Bay with measurements of F-region ion velocity from the incoherent scatter radar at Sondre Stromfjord. Observations were presented, by the au-thors, from a single run on the evening of 6 January, 1996. The line-of-sight of the Sondrestrom radar was directed between the HF pointing directions of beams 10 and 11 in the Goose Bay ®eld-of-view, with an elevation of only 30° such that it enabled comparison over a
number of range cells along the HF beam; when the data from all ranges were combined, the authors totalled some 100 pairs of velocities. Ruohoniemiet al.(1987) obtained impressive results from which they concluded that the motion of small-scale irregularities in the high-latitude ionosphere could be used to trace convective drifts.
Perhaps the work readily comparable to the present is that of Eglitis et al. (1998), in which the authors compared the velocity of ®eld-aligned irregularities, arti®cially generated in the F-region by RF modi®cation experiments and measured by the CUTLASS Finland radar, with F-region ion velocity observation from the EISCAT UHF system. The distinct advantages of the arti®cial generation of irregularities is that Eglitiset al. (1998) detected more than half as many simultaneous estimates of irregularity drift velocity and ion velocity in a total observing time of only 24 h than were observed over the entire 1000 h of the present study. The majority of the observations of Eglitiset al.(1998) were clustered around 0 m s)1, all larger velocities having negative values up to a magnitude of 400 m s)1. Although a best ®t line with a gradient of 0.98 was attained by the authors, it is perhaps more signi®cant that this slope was reduced to only 0.65 when analysis was constrained to the ®nite period after heater turn-o during which the irregular-ities were decaying. Eglitiset al.(1998) cast doubt on the statistical signi®cance of the latter since they maintained that this `o' population comprised a small sample of the total observations (137 points compared with 981 points from all observations). It should be noted that the ability to restrict irregularity generation to the F-region, in arti®cial modi®cation experiments of this type, greatly reduces any potential contamination by E-region scatter. Despite potentially deleterious eects such as mis-matched range and time sampling intervals, the statis-tical correspondence between the irregularity drift velocity and the F-region ion velocity is particularly impressive, although perhaps not as good as would be anticipated from examination of the selected intervals presented in the previous section.
5 Summary and conclusions
The EISCAT mainland site lies well within the extensive ®eld-of-view of the CUTLASS Finland radar, the latter
of which forms part of the SuperDARN chain of HF coherent scatter radars. Estimates of F-region plasma drift from the EISCAT UHF incoherent scatter radar, operating in its two most frequently run modes of operation ± common programme 1 and common programme 2, are compared to the drift velocity of F-region irregularities, measured by the Finland radar. The location of the UHF radar within the CUTLASS Finland radar ®eld-of-view is, unfortunately, by no means optimum for such a comparison as the nature of HF propagation severely limits Finland radar returns from the vicinity of EISCAT.
Velocity comparison is initially con®ned to four intervals of simultaneous, and spatially coincident, radar returns; intervals are selected such that they exhibit a variety of dierent velocity signatures includ-ing rapid ¯uctuations and the characteristic signature of the nightside convection reversal. Subsequent statistical comparison incorporates all simultaneous, co-located velocity measurements ± conditions dictate, however, that coherent echoes from the Finland radar are observed in the vicinity of the EISCAT site for a time totalling less than 4 h out of 1000 h of dual radar operation.
The velocities measured by the two systems demon-strate reasonable correspondence over the velocity regime encountered during the simultaneous occurrence of coherent and incoherent scatter, results supportive of the widely held belief of the equivalence of convective drift and the motion of small scale irregularities in the high latitude F-region. Dierences between the EISCAT UHF measurements of F-region ion drift and the irregularity drift velocities from the Finland radar can be explained in terms of a number of contributing factors. These factors include contamination of the coherent returns by E-region echoes and the detrimental eect of discrepant spatial and temporal sampling. Incoherent scatter from E- and F-regions, distinguished by use of the interferometric capabilities of the Finland radar, illustrate markedly dierent characteristic with respect to their relationship to the F-region ion velocity; least squares ®tting to the data yields slopes of 0.57 and 0.73 for E- and F-region, respectively.
Observations presented demonstrate that the
CUT-LASS system provides an invaluable spatial
context in which to interpret EISCAT observations, particularly in relation to small-scale features in the high-latitude plasma. Moreover, the importance of E-region contamination has been quanti®ed, at least for one of the SuperDARN sites.
Acknowledgements. The authors are indebted to the director and sta of EISCAT for operating the facility and supplying the data. EISCAT is an international facility funded collaboratively by the research councils of Finland (SA), France (CNRS), the Federal Republic of Germany (MPG), Japan (NIPR), Norway (NAVF), Sweden (NFR) and the United Kingdom (PPARC). CUTLASS is funded jointly by PPARC (Grant number PPA/R/R/1997/00256), the Swedish Institute for Space Physics, Uppsala, and the Finnish Meteorological Institute. J. A. Davies and S. E. Milan are supported on PPARC grant number PPA/G/O/1997/000254.
References
Baker, K. B., R. A. Greenwald, J. M. Ruohoniemi, J. R. Dudeney, M. Pinnock, P. T. Newell, M. E. Greenspan, and C. I. Meng, Simultaneous HF radar and DMSP observations of the cusp,
Geophys. Res. Lett.,17,1869±1872, 1990.
Bond G. E., T. R. Robinson, P. Eglitis, D. M. Wright, A. J. Stocker, M. T. Rietveld, and T. B. Jones,CUTLASS spatial observation of the arti®cially modi®ed ionosphere, Ann. Geophysicae, 15, 1412±1421, 1997.
Cahill, L. J., R. A. Greenwald, and E. Nielsen,Auroral radar and rocket double probe observations of electric ®eld across the Harang discontinuity,Geophys. Res. Lett.,5,687±690, 1978. Eckland, W. W., B. B. Balsey, and D. A. Carter, A preliminary
comparison of F region plasma drifts and E-region irregularity drifts in the auroral zone,J. Geophys. Res.,82,195±197, 1977. Eglitis, P., T. R. Robinson, M. T. Rietveld, D. M. Wright, and G. E. Bond, the phase speed of arti®cial ®eld-aligned irregularities observed by CUTLASS during HF modi®cation of the auroral ionosphere,J. Geosphys. Res.,103,2253±2259, 1998.
Fejer, B. G., and M. C. Kelly, Ionospheric irregularities, Rev. Geophys. Space Phys.,18,401±454, 1980.
Greenwald, R. A., W. Weiss, E. Nielsen, and N. R. Thomson, STARE: a new radar auroral backscatter experiment in northern Scandinavia,Radio Sci.,13,1021±1039, 1978. Greenwald, R. A., K. B. Baker, J. R. Dudeney, M. Pinnock, T. B.
Jones, E. C. Thomas, J.-P. Villian, J.-C. Cerisier, C. Senior, C. Hanuise, R. D. Hunsucker, G. Sofko, J. Koehler, E. Nielsen, R. Pellinen, A. D. M. Walker, N. Sato, and H. Yamagishi,DARN/ SuperDARN: a global view of the dynamics of high-latitude convection,Space. Sci. Rev.,71,761±796, 1995.
Haldoupis, C., A review on radio studies of auroral E-region ionospheric irregularities,Ann. Geophysicae,7,239±258, 1989. Haldoupis, C., and K. Schlegel, Direct comparison of 1-m
irregularity phase velocities and ion acoustic speeds in the auroral E-region ionosphere, J. Geophys. Res., 95, 18 989± 19 000, 1990.
Hanuise, C., AÊ. Hedberg, J. Oskman, E. Nielsen, P. Stubbe, and H. Kopka,Comparison between the ionospheric plasma drift and the motion of arti®cially induced irregularities as observed by HF backscatter radars,Ann. Geophysicae,4,49±54, 1986. Hedberg, AÊ, H. Derblom, B. ThideÂ, H. Kopka, and P. Stubbe,
Observations of HF backscatter associated with the heating experiment at Tromsù,Radio Sci.,18,840±850, 1983.
Keskinen, M. J., and S. L. Ossakow, Theories of high-latitude ionospheric irregularities ± a review,Radio Sci.,18,1077±1091, 1983.
McCrea, I. W., K. Schlegel, T. Nygren, and T. B. Jones,COSCAT, a new auroral radar facility on 930 MHz ± system description and ®rst results,Ann. Geophysicae,9,461±469, 1991.
Milan, S. E., T. B. Jones, M. Lester, E. M. Warrington, and G. D. Reeves, Substorm correlated absorption on a 3200 km trans-auroral HF propagation path,Ann. Geophysicae,14,182±190, 1996.
Milan, S. E., T. K. Yeoman, M. Lester, E. C. Thomas, and T. B. Jones,Initial backscatter occurrences statistics from the CUT-LASS HF radars,Ann. Geophysicae,15,703±718, 1997. Nielsen, E., and K. Schlegel, A ®rst comparison of STARE and
EISCAT electron drift velocity measurements, J. Geosphys. Res.,88,4745±5750, 1983.
Nielsen, E. and K. Schlegel,Coherent radar Doppler measurements and their relationships to the ionospheric electron drift velocity,
J. Geosphys. Res.,90,3498±3504, 1985.
Nielsen, E., W. GuÈttler, E. C. Thomas, C. P. Stewart, T. B. Jones, and A. Hedberg, SABRE: a new radar auroral backscatter experiment,Nature,304,712±714, 1983.
Noble, S. T., F. T. Djuth, R. J. Jost, W. E. Gordon, AÊ. Hedberg, B. ThideÂ, H. Derblom, R. Bostrom, E. Nielsen, P. Stubbe, and H. Kopka,Multiple frequency radar observations of high-latitude irregularities in the HF modi®ed ionosphere,J. Geophys. Res., 92,13 613±13 627, 1987.
Ossakow, S. L., and P. K. Chaturvedi,Current convective instability in the diuse aurora,Geophys. Res. Lett.,6,332±334, 1979. Rishbeth, H., and P. J. S. Williams, The EISCAT ionospheric
radar: The system and its early results,Q. J. R. Astron. Soc.,26, 478±512, 1985.
Ruohoniemi, J. M., R. A. Greenwald, K. B. Baker, J.-P. Villain, and M. A. McCready,Drift motions of small-scale irregularities in the high-latitude F-region: An experimental comparison with plasma drift motion,J. Geophys. Res.,92,4553±4564, 1987. Ruohoniemi, J. M., R. A. Greenwald, K. B. Baker, J.-P. Villain, C.
Haniuse, and J. Kelly,mapping high-latitude plasma convection with coherent HF radars,J. Geophys. Res.,94,13 463±13 477, 1989.
Schlegel, K., and J.-P. St-Maurice,Anomalous heating of the polar E-region by unstable plasma waves 1. Observations,J. Geophys. Res.,86,1447±1452, 1981.
St-Maurice, J.-P., K. Schlegel, and P. Banks,Anomalous heating of the polar E-region by unstable plasma waves 2. Theory,
J. Geophys. Res.,86,1453±1462, 1981.
Villain, J.-P., G. Caudal, and C. Hanuise, A SAFARI-EISCAT comparison between the velocity of F-region small-scale irreg-ularities and the ion drift,J. Geophys. Res.,90,8433±8443, 1985. Wickwar, V. B., C. LathuilleÁre, W. Kofman and G. Lejeune, Elevated electron temperatures in the auroral E-layer measured with the Chatanika radar, J. Geophys. Res., 86, 4721±4730, 1981.