18577
Repeated Electrical Resistivity Tomographies in a
CALM Site in Livingston Island, Maritime
Antarctica
A.M. Correia* (Evora University), J. Rocha (Evora University) & G. Vieira (University of Lisbon)
SUMMARY
During the years of 2009, 2012, and 2013 several electrical resistivity tomographies (ERTs) were done in a CALM (Circumpolar Active Layer Monitoring) site near the Bulgarian Antarctic Base of St. Kliment Ohridski. The main objective of the ERTs was to try to identify permafrost zones and their extension, as well as their time and space evolution. Geoelectrical methods, in particular ERTs, are very useful for permafrost studies because of the significant increase of the electrical resistivity when the ground is partially or totally frozen and when temperature is lower than 0 degrees celcius. For each ERT made, 40 electrodes in line, spaced by 2 metres each, were used and the apparent electrical resistivity measurements were mathematically inverted to obtain two-dimensional geoelectrical models for each of them. All models show high electrical resistivity values (of the order of tens of thousands of Ω.m). In the CALM site the high electrical resistivities probably correspond to patches of frozen ground but it is not possible to indicate whether it is sporadic permafrost or remnants of seasonally frozen ground yet.
Introduction
Under the framework of the projects PERMANTAR (Permafrost and Climate Change in the Maritime Antarctic) and PERMANTAR-2 (Permafrost and Climate Change in the Maritime Antarctic-2), in 2009, 2012, and 2013, electrical resistivity tomography (ERT) surveys were conducted in a Circumpolar Active Layer Monitoring (CALM) site in the Hurd Peninsula of Livingston Island (Maritime Antarctica) with the objective of studying the spatial and time distribution of permafrost in the area. In 2009 two directions in the CALM site were chosen to make the ERT profiles, which were repeated in 2012, and 2013. The PERMANTAR Project was a contribuition of several research teams for the International Polar Year under the framework of the Core Projects ANTPAS (Antarctic and Sub-Antarctic Permafrost, Soils and Periglacial Environments) and TSP (Permafrost Observatory Project – Thermal State of Permafrost); the project PERMANTAR-2 was a continuation of the PERMANTAR Project.
The electrical resistivity tomography (ERT) surveys were performed in the CALM site near the Bulgarian Antarctic Station St. Kliment Ohridski, in the Hurd Peninsula in Livingston Island (Maritime Antarctica).
The main objective of the three geoelectrical surveys was to identify and estimate permafrost’s depth in the CALM site for different times. Geoelectrical methods are particularly well adapted to study the spatial distribution of permafrost because of its high electrical resistivities in comparison with the electrical resistivities of soil and rocks with water and above 0 ºC.
Method
The electrical resistivity tomographies were made along different directions (Figure 1). However, only profiles 8 and 9 were done in 2009, 2012, and 2013. Profile 7 was never repeated because of snow accumulated in 2012 and 2013. For each tomography 40 electrodes were used in a Wenner configuration; adjacent electrodes were 2 m apart. The software RES2DINV (Loke and Barker, 1995 and 1996) was used for inverting the apparent electrical resistivity values (apparent electrical resistivity pseudo-sections) into two-dimensional models of electrical resistivity of the ground (Figures 2 and 3). The models are a representation of the distribution of the electrical resistivity of the ground to depths of about 13 m along profiles 78 m long. In some portions of the models electrical resistivities of the order of 104 Ω.m were obtained.
The apparent electrical resistivity values measured during the field works appear to be of high quality; as a matter of fact, no parasitic currents were detected during the several surveys; also, considering the resolution of the resistivimeter used for the field work, after repetition of some measurements for stability control of the apparent electrical resistivity their values did not change with time.
Discussion of the results
Figure 2 and Figure 3 show the geoelectrical models of the ground as a result of the electrical resistivity tomographies along profiles 8 and 9. In both figures the repeated profiles are presented, from top to bottom, as the profiles done in 2009, 2012, and 2013.
The electrical resistivity values of the several models vary from a few hundred of Ω.m to 104 Ω.m.
Even though the color codes for each of the models is different, the reddish colors correspond to high electrical resistivity values and the bluish colors to low electrical resistivity values.
Most of the high electrical resistivity values are located at the surface of the ground. However, in profile 8 (Figure 2), there is a high electrical resistivity zone between 38 and 42 m that has deep roots. This probably corresponds to very sound rock without fractures or fissures. In profile 8 the high electrical resistivity values at the surface change a little their location from year to year.
11
Profile 8
Profile 9
Profile 7
Figure 1 CALM site near the Bulgarian Antarctic Station St. Kliment Ohridski, in the Hurd Peninsula in Livingston Island. The orientation of the three electrical resistivity tomographies is represented in yellow. Only profiles 8 and 9 were repeated in 2009, 2012, and 2013.
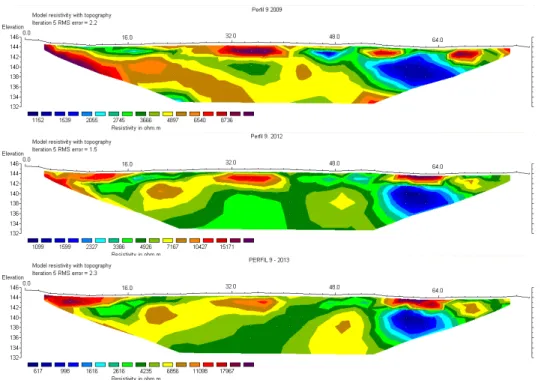
In profile 9 (Figure 3) the high electrical resistivity values at the surface appear in the same location for the three years of the survey. At this time it is only possible to say that the high electrical resistivity values correspond to patches of frozen ground or sporadic permafrost. An interesting observation is that most of the highest electrical resistivity values observed at the surface of the ground are coincident with patches of snow that did not melt; therefore, in this particular situation, the snow is insulating the ground from solar radiation and from the warmer air (the geoelectrical surveys were done in the Antarctic summer).
It is also interesting to note that blue areas in the left side of the models of Figure 3 (which correspond to electrical resistivity values from about 600 Ω.m to 3,000 Ω.m) are a permanent feature in all the three models; they probably correspond to melted water that circulates beneath the ground.
Another interesting feature of the models shown in Figure 3 is that the high electrical resistivity zone at the ground’s surface, between 28 m and 40 m, appears to decrease its electrical resistivity value from about 13,000 Ω.m to about 11,000 Ω.m during the period of the survey, i.e., from 2009 to 2013; this can be an indication that the size of the frozen patch (or sporadic permafrost) is decreasing as
Figure 2 Electrical resistivity tomographies along profile 8. From top to bottom profiles made in 2009, 2012, and 2013.
Figure 3 Electrical resistivity tomographies along profile 9. From top to bottom profiles made in 2009, 2012, and 2013.
Conclusions
From the apparent electrical resistivity values measured in the CALM site near the Bulgarian Antarctic Station St. Kliment Ohridski two-dimensional geoelectrical models along two different directions (profiles 8 and 9 of Figure 1), for a period of three years, were constructed using the inversion code RES2DINV (Loke and Barker, 1995 and 1996). In general, the models show high electrical resistivity values (of the order of 104 Ω.m) in some zones.
As a preliminary interpretation, in some zones traversed by profiles 8 and 9 there are patches of frozen ground or sporadic permafrost. Most of those patches persist from year to year, especially in profile 9. At the surface of the ground, some of those areas also coincide with patches of snow that were not melted when the geoelectrical profiles were made; those snow patches are, therefore, acting as an insulating cover to the ground, maintaining the temperature below the values it would reach if there were no snow; to a certain extent, this could explain some of the frozen ground patches.
Acknowledgements
The authors thank the financial support of “Fundacao para a Ciencia e a Tecnologia” (FCT), the staff of the Bulgarian Antarctic Station and Spanish antarctic logistic; this work could not have been done without their support.
References
Loke, M.H. and Barker, R.D., 1995. Least-squares deconvolution of apparent resistivity. Geophysics, 60, 1682-1690.
Loke, M.H. and Barker, R.D., 1996. Rapid least-squares inversion of apparent resistivity pseudo-sections using a quasi-Newton method. Geophysical Prospecting, 44, 131-152.