Universidade de Lisboa
Faculdade de Ciências
Departamento de Biologia Animal
Regulation of mitotic exit in higher eukaryotes:
Drosophila mob genes
Sara de Brito Santana Maurício Esteves
Mestrado em Biologia Evolutiva e do Desenvolvimento
2009
Universidade de Lisboa
Departamento de Biologia Animal
Regulation of mitotic exit in higher eukaryotes:
Drosophila mob genes
Sara de Brito Santana Maurício Esteves
Dissertação de mestrado orientada por:
Doutor Octávio Paulo – Faculdade de Ciências da Universidade de Lisboa Doutor Álvaro Tavares – Instituto Gulbenkian de Ciência
Mestrado em Biologia Evolutiva e do Desenvolvimento
RESUMO
O correcto processo de desenvolvimento depende da proliferação celular, apoptose e morfogénese. Esta dependência é, não só relativa a cada um destes processos isoladamente, mas essencialmente ao correcto balanceamento espacial e temporal entre eles. A desregulação destes processos ou da sinalização entre os mesmos pode levar ao desenvolvimento de doenças, como o cancro. Neste trabalho, pretendeu-se estudar aspectos relacionados com a regulação dos processos de divisão celular, usando como organismo modelo a mosca Drosophila melanogaster. Em concreto, pretendeu-se investigar o papel da saída de mitose durante o desenvolvimento. Nas leveduras S.cerevisae e S. Pombe os genes mob1 são essenciais à saída de mitose e citocinese, respectivamente. Estes dois processos estão altamente regulados por cascatas de sinalização: “Mitotic Exit Network” (MEN) em S.cerevisae e “Septation Initiation Network” (SIN) em
S. Pombe. Desta forma, através do uso de mutantes para os genes mob1 e mob2 em Drosophila, investigou-se o seu papel na possível regulação da
saída de mitose e a forma como este processo seria regulado. A caracterização fenotípica sugere que estes genes têm papeis diferentes dos seus ortólogos em levedura, i.e., não aparentam ter qualquer papel na regulação da saída de mitose ou citocinese. Em concreto, o gene dmob1 é um gene essencial, cujos mutantes morrem durante a embriogénese. Parece estar envolvido em processos de polaridade celular tanto durante o desenvolvimento embrionário, como no adulto. Durante as fases iniciais da embriogénese, sincício, as mitoses dos mutantes mob1 têm os centrossomas fora dos pólos do fuso mitótico, que se encontram mal focados. Curiosamente, estes defeitos na formação do fuso são ultrapassados com o avançar no desenvolvimento. Em estádios mais avançados do desenvolvimento verificou-se que nos mutantes mob1 processos morfogenéticos, como “germband retration” falham. A análise de estruturas larvares permitiu perceber que este gene tem também um papel importante na regulação da proliferação celular. Finalmente, o estudo de mosaicos permitiu averiguar o papel deste gene na fase adulta. Verificou-se que é essencial para o estabelecimento da polaridade de células epiteliais, tal como já tinha sido verificado no embrião.
Relativamente ao gene mob2, é também um gene essencial e mutantes morrem no terceiro estádio larvar. Tem um papel importante durante a mitose já que os mutantes para mob2 apresentam defeitos na segregação dos cromossomas e na formação do fuso mitótico. Estes defeitos estão associados a um crescimento reduzido do cérebro larvar. Este facto justifica-se pelo facto de ao falharem a divisão mitótica, as células embarcarem numa cascata apoptótica.
Este trabalho mostra que os genes mob1 e mob2 são essenciais ao correcto desenvolvimento de Drosophila, e cria hipóteses acerca das suas funções e possíveis parceiros moleculares.
Palavras-chave: Drosophila melanogaster, genes mob, mitose, polaridade celular, proliferação celular, morphogenesis.
ABSTRACT
Normal development requires the orchestration of cell proliferation, apoptosis and morphogenesis. These processes ultimately depend and influence each other. Errors in these processes are believed to constitute main causes for genomic instability and development of cancer. During the course of this work, the roles of two Drosophila genes of the conserved mob gene family were characterized. In the yeasts S. cerevisae and S. pombe, mob genes have been shown to play important roles in both mitosis exit, cytokinesis and cell polarity. The characterization of both dmob1 and dmob2 showed that they play distinct roles from their yeast orthologs. In fact, mob1 seems to have an important role in cell proliferation, cell polarity and tissue morphogenesis. Moreover, mob2 showed to be important for faithful cell division.
This work shows that both these genes are crucial for Drosophila development and elaborates on their potential roles and partners that can be tested in future projects.
Key words: Drosophila melanogaster, mob genes, mitosis, cell polarity, cell proliferation, morphogenesis.
TABLE OF CONTENTS
RESUMO...4
ABSTRACT ... 6
I. Introduction ... 9
1. 1 Cell division: a fundamental feature of all living organisms ... 9
1.2 The cell cycle ... 9
1.2.1 Key cellular players in cell division ... 10
1.3 Late Mitotic Events ... 11
1.4 Mitotic Exit Network ... 11
1.5 Septation Initiation Network ... 13
1.6 Biological roles of the mob gene family ... 13
II. AIMS OF THE PROJECT ... 17
III. Materials and Methods ... 18
3. Fly strains and genetics ... 18
3.1.Fly husbandry ... 18
3.2. Fly Strains: mutant alleles available for this study ... 18
3.3 Genetic tools ... 19
3.3.1 The UAS-Gal4 system ... 19
3.3.2 FLP-Out GAL4 ... 20
3.3.3 Germ line clones ... 21
3.4 Immunohistochemistry ... 22
3.4.1 Embryos ... 22
3.4.2 Larval tissues ... 23
3.4.2.1 Whole mount larval brains ... 23
3.4.2.2 Wing imaginal discs ... 23
3.4.2.3 Phalloidin Staining ... 24
3.4.2.4 Propidium Iodide Staining... 24
3.5 Image Acquisition and Analysis ... 25
3.6 Embryonic cuticle preparation ... 25
3.7 Wing preparations ... 25
3.8 Cell Cycle FACS analysis in 3rd instar larval brains ... 26
3.8.1 Sample preparation ... 26
3.8.2 Data acquisition and analysis ... 26
3.9 Western blot of larval brains... 27
3.9.1 Sample preparation ... 27
3.9.2 SDS-Page... 28
3.9.3 Transfer to a PVDF membrane ... 28
3.9.4 Western Blot ... 28
IV. RESULTS AND DISCUSSION ... 29
4.1 Dmob1 Functional Analysis ... 29
4.1.1 Characterisation of dmob14 allele ... 29
4.1.2 Cellular analysis of dmob14 phenotype ... 29
4.1.2.1 dmob1mutant embryos have unfocused microtubules and centrosomes detached from the spindle poles, early in development ... 29
4.1.2.2 dmob1 mutant embryos overcome the early mitotic defects later in embryogenesis but display an abnormal morphology ... 31
4.1.2.3 dmob1 is essential for correct embryonic development ... 32
4.1.2.4 dmob1 mutant larvae have overgrown brains ... 35
4.1.2.5 Depletion of dmob1is lethal in early pupal stages, but no overgrown structures are found in 3rd instar larvae ... 36
4.1.2.6 dmob1RNAi clones have problems in polarity in the adult eye and wing ... 39 4.1.2.7 dmob1RNAi clones have problems in proliferation and patterning of the adult
4.2 Dmob2 Functional Analysis ... 45
4.2.1 Characterisation of dmob25 allele ... 45
4.2.2 Maternal contribution of dmob2 ... 45
4.2.3 Analysis of dmob25 homozygous phenotype ... 46
4.2.3.1 dmob2 is essential for brain and imaginal discs growth during larval stages 46 4.2.3.2 dmob2 is required for proper chromossomal segregation and Mitotic progression ... 48
4.2.3.3 dmob2 mutants have a higher rate of apoptotic cells ... 50
VII. SUPPLEMENTARY DATA... 55
I. INTRODUCTION
1.1CELL DIVISION: A FUNDAMENTAL FEATURE OF ALL LIVING ORGANISMS
All cells arise by division of previously existing cells, and every cell living today is thought to be descendant from an ancestral that lived more than 3.5 billion years ago. Throughout this vast period of time, the evolution of cells and organisms, and thus the continued success of life on earth, has depended on the transmission of genetic information by cell division (reviewed in Morgan, 2007).
1.2THE CELL CYCLE
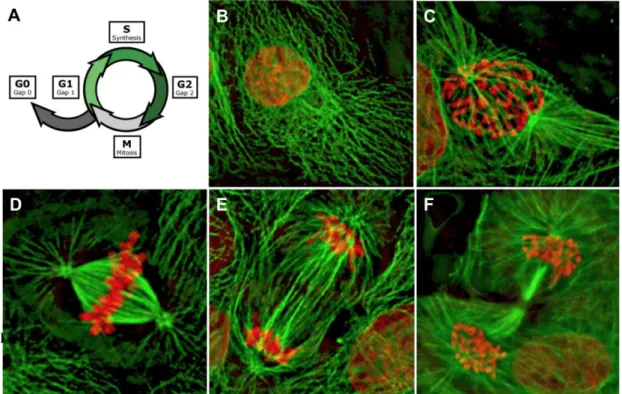
In prokaryotes the cell cycle occurs by a process called binary fission. In eukaryotes, the highly regulated series of events that leads to cell reproduction is known as the cell cycle (Fig.1). The cell cycle can be divided in 5 phases: G0, G1, G2, S (synthesis) and M (mitotic).
The first part of the cycle (G1), and usually the longest, is dedicated to duplication and distribution of cell components where cytoplasmic organelles, membrane, structural proteins and RNAs are replicated continuously. This allows for responding to extracellular cues that induce either commitment to a further round of cell division or withdrawal from the cell cycle (G0), to embark on a differentiation path (reviewed in Morgan, 2007).
However, chromosomes must be duplicated only once per cycle. This occurs during a discrete stage called the synthetic or S phase. The distribution of duplicated components into individual daughter cells occurs during a brief stage called the mitotic or M phase and is typically composed by two major events: nuclear division (mitosis) and cell division (cytokinesis). Between S and M phases is the G2 phase during which the cell checks the completion of DNA replication and the genomic integrity before cell division itself starts (reviewed in Morgan, 2007).
During the first stage of mitosis, prophase, the chromosomes condense and the nuclear envelope breaks down. At the same time the mitotic spindle forms
by the polymerisation of microtubules and the chromosomes are attached to spindle fibres at the kinetochores. In metaphase, the chromosomes align in a central plane perpendicular to the long axis of the spindle. This is termed the metaphase plate. During anaphase sister chromatids´ cohesion is destroyed, resulting in their separation. The microtubules of the spindle pull the separated sisters to opposite cell ends (sister-chromatid segregation) and the two sets of chromosomes are packaged into each new daughter nuclei. This separation of chromatids is completed during telophase, when they can be regarded as chromosomes proper. Following mitosis, the cell itself divides by cytokinesis. Cytokinesis requires the deposition of new plasma membrane and, in a number of cases, new cell wall. In many organisms, an actin-myosin contractile ring guides membrane deposition (reviewed in Morgan, 2007). The cell cycle is completed when the ring contracts and pinches the cell in two.
FIGURE 1 - The cell cycle - (A) The cell cycle is compose of five different stages. The
mitotic is the fastest one. (B-F) Pig ephitelial cells with DNA stained in red and microtubules (tubulin) in green (B) Cell in Interphase (C-F) Stages of mitosis. (C) Prophase. (D) Metaphase (E) Anaphase (F) Cytokinesis. (Adapted from Earnshaw)
1.2.1KEY CELLULAR PLAYERS IN CELL DIVISION
As mentioned above, during mitosis the microtubule network reorganizes forming a bipolar spindle. The correct spindle formation ensures proper
chromosome segregation by aligning the chromosomes along the metaphase plate (Maiato et al., 2004).
Centrosomes play a central role in spindle assembly, as they represent the primary microtubule organizing centres (MTOC). Nevertheless, functional spindles are able to form in the absence of centrosomes, as occurs in meiotic cells, or when these structures are removed (Hinchcliffe et al., 2001). In these cases mitotic chromosomes appear to initiate the assembly of a bipolar spindle and thereby compensate for the lack of centrosomes. Additionally, through the microtubules they organize, centrosomes are thought to have important roles also in establishing cell polarity, positioning organelles within cells and directing intracellular traffic (Kellogg et al., 1994).
This way, to ensure a successful division, cells ultimately depend on three structures: the mitotic spindle, the centrosomes and the kinetochores. Notably, many mitotic cellular events are redundantly regulated by these structures.
1.3LATE MITOTIC EVENTS
In order to ensure that each daughter cell receives a complete genetic package and an appropriate complement of cytoplasmic material, cells must co-ordinate mitosis with cytokinesis, both in time and space. At the end of mitosis, in addition to the separation of daughter cells during cytokinesis, cells must decondense their chromosomes, reform a nuclear envelope and remodel their mitotic spindle into an interphase microtubule network. This exit from mitosis requires the inactivation of the mitotic Cyclin Dependent Kinases (CDKs), which trigger the onset of mitotic events. Although much is known of the regulatory networks involved in controlling mitotic exit in budding and fission yeasts, mitotic exit in higher eukaryotic cells remains poorly understood.
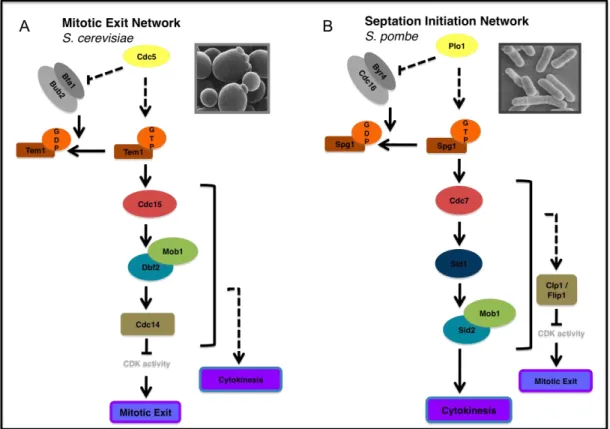
In the budding yeast Saccharomyces cerevisiae, a signal transduction pathway, known as the mitotic exit network (MEN) (Fig. 2), controls the exit of mitosis, while also ensuring that this transition occurs only after sister-chromatid separation is initiated and the genetic material has been segregated between mother and daughter cell (Bardin and Amon, 2001). The GTPase Tem1 functions at the top of MEN and is regulated both by the Guanine Nucleotide Exchange Factor (GEF) Lte1 and the GTPase Activating Protein (GAP) complex Bub2–Bfa1. Activation of Tem1 leads to the propagation of a signal to the kinase Cdc15, which then activates the kinase Dbf2 in a Mob1-dependent manner (Lee et al., 2001).
FIGURE 2 - MEN and SIN components - Proteins that constitute the SIN signalling pathway
(B) are very similar to those of the MEN (A). Moreover, they function in the same order despite the fact that the SIN pathway plays no known role in mitotic exit.
The final outcome of the MEN cascade is the activation of the Cdc14 phosphatase, which in turn reverses CDK phosphorylation (Bardin and Amon, 2001). Although inactivation of the Cdk1-Cyclin B complex is required for cytokinesis, the MEN was shown to be essential for cytokinesis and in particular for actin-myosin ring contraction, independently of its role in mitotic exit. In fact, when the function of MEN is abrogated in conditions where mitotic exit is induced by artificial suppression of mitotic CDKs, cytokinesis
does not take place (Shou et al., 1999).
1.5SEPTATION INITIATION NETWORK
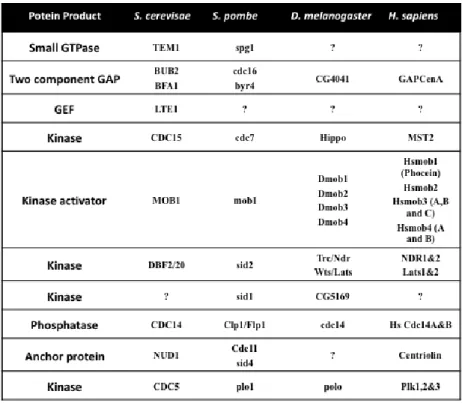
In the fission yeast Schizosaccharomyces pombe, the Septation Initiation Network (SIN) functions later in the cell cycle and ensures that cytokinesis occurs after chromosome segregation has been completed and when the mitotic CDKs are inactivated (Bardin and Amon, 2001). The proteins constituting this signalling cascade are homologous to those of the MEN pathway (Fig. 1B). Moreover, the order by which the components of the SIN function is well understood and remarkably similar to that of the MEN, although SIN does not play a role in mitotic exit (Table 1).
1.6BIOLOGICAL ROLES OF THE MOB GENE FAMILY
The first member of the mob (Mps-one-binder) gene family, mob1, was identified in budding yeast, S. cerevisae (Luca et al., 1998). As mentioned above, it is involved in the MEN pathway where it functions as a critical regulator of cell division (Luca et al., 1998; Bardin et al., 2000). scMob1’s activity is essential for regulating and locaizing the Dbf2 protein kinase, another component of the MEN. Moreover, a requirement for scMob1 has also been shown in coordinating chromosome segregation and/or spindle integrity with mitotic exit and cytokinesis, via regulation of chromosome passenger proteins, such as Aurora (Stoepel et al., 2005).
In fission yeast, S. pombe, mob1 is involved in regulating cytokinesis (Salimova et al., 2000). spMob1 interacts with Sid2, the ortholog of S.
cerevisae Dbf2, also regulating its localization and kinase activity. It has been
extensively reported that, in agreement with their functions in mitosis exit and cytokinesis, Dbf2/Sid2-Mob1 complexes localize to the spindle pole body (SPB) in anaphase and move to the division site in late mitosis (Stegmeier and Amon, 2004).
TABLE 1 - Homologues of S. cerevisiae MEN signaliing pathway.
Overall, the available data in yeast points to an essential role of Mob1 in cell cycle progression through the interaction with Dbf2/Sid2 protein kinases, and reveals an essential temporal and spatial regulation of Mob1 activity.
Besides Mob1, both in S.cerevisiae and in S.pombe there is a second
mobbgene, mob2. In S.cerevisiae it does not seem to be an essential gene,
unlike mob1, as yeasts mutants for mob2 are viable, but display a rounder shape. This suggests that Mob2 plays a role in polarized growth (Weiss et al., 2002). Concerning S. pombe, mob2 is an essential gene. Mutants for this gene are round and have both the actin and the microtubule cytoskeletons depolimerized (Weiss et al., 2002). In both yeast Mob2 interacts with Dbf2-related kinases (Cbk1 in S.cerevisiae and Orb6 in S.pombe (Racki et al., 2000; Hou et al., 2003).
MEN components are conserved through evolution (Vitulo et al., 2007; Ye et
al., 2009). In particular, Mob1 proteins have been found in both animal and
plant cells, suggesting that their role in controlling cell cycle progression might be conserved in higher eukaryotes (Vitulo et al., 2007; Ye et al., 2009) . Table 1 shows that there are seven Mob homologs in Homo sapiens and four in
might have acquired new function.
In human cells Mob1, also called Phocein, is partly characterized and has been implicated in calcium dependent signal transduction and vesicle-trafficking (Moreno et al., 2001; Baillat et al., 2001; Baillat et al., 2002).
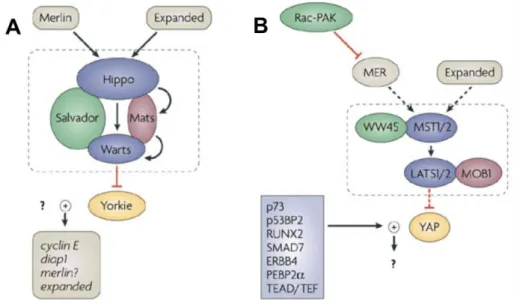
hMob4A is described as a tumour-supressor gene that plays a central role in the Hippo pathway, that controls cell growth and apoptosis (Saucedo and Edgar, 2007). Moreover the interactions between Mob1 human homolog’s and NDR (Nuclear-Dbf2-related) proteins are conserved (Saucedo and Edgar, 2007). The Hippo pathway seems to be the pathway homologous to the MEN in higher eukaryotes, as several MEN genes have been implicated in this signaling cascade (Saucedo and Edgar, 2007). This suggests the acquisition of new functions by this conserved pathway.
FIGURE 2 – Hippo signaling pathway in Drosophila and Humans – Both Drosophila’s (A)
and Human (B) Hippo pathway have conserved homologous components of the MEN and SIN cascades, as well as their interactions.
Also work done in our lab showed that hMob4 and B are required for cytokinesis (Florindo, 2004) and more recently that is important for centrosome duplication (Hergovich et al., 2009).
In Drosophila S2 cells, Mob1 was shown to have a role in mitotic spindle focusing (Trammel et al., 2008). Like in Humans, dMob4 is participates in the Hippo pathway, together with the yeast Dbf2 homolog warts (Saucedo and Edgar, 2007). Both dMob4 and dMob2 have been shown to interact with
another Dbf2 homolog tricornered that is important in the regulation of polarized cellular outgrowths such as hairs and bristles (He et al., 2005). A very recent study also implicates dMob2 in polarized growth showing that it has a function in photoreceptor morphogenesis (Liu et al., 2009).
II. AIMS OF THE PROJECT
Normal development of multicellular organisms requires appropriate cell numbers and organ sizes. This is determined by coordinated cell proliferation, morphogenesis and apoptosis. Disruption or malfunction of these processes can lead to the development of diseases such as cancer. In this work we wish to establish whether higher eukaryotes have part of the mitotic exit signalling pathway by analysing in detail the function of the Drosophila mob1 and mob2 genes. In particular, we wish to determine if their malfunction leads to genetic instability. For this aim in the course of this research, mutants for both mob1 and mob2 genes were analyzed using a combined approach of Drosophila genetics and cell biology (immunofluorescence) techniques.
III. MATERIALS AND METHODS
3.FLY STRAINS AND GENETICS
3.1.FLY HUSBANDRY
All fly stocks were raised at 25ºC, according to standard conditions (Dahmann, 2008). Crosses were cultured in small tubes or bottles, sealed with cotton, containing a yeast-glucose-agar medium with an anti-fungi Nipagin-N. Stocks were balanced using standard fly genetic methods, according to Dahmann, 2008.
3.2.FLY STRAINS: MUTANT ALLELES AVAILABLE FOR THIS STUDY
Wild-type flies are from the Oregon R stock. The mutant alleles mob14 (Wainman, 2003) and mob25 (Bloomington), as well as all the other stocks used during the course of this work, were already available in the lab.
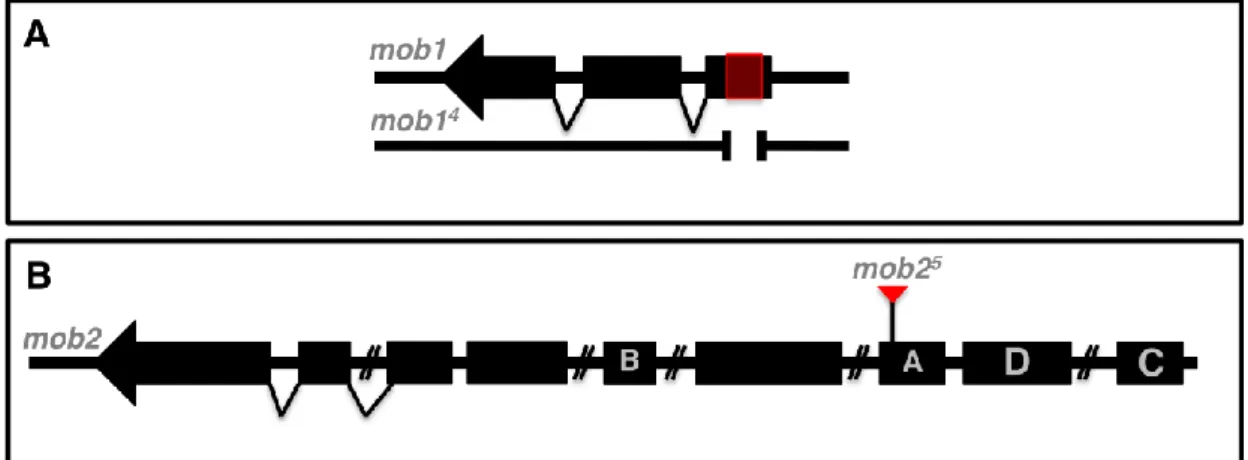
The mob14 mutant allele was generated by imprecise P-element excision by Wainman (Wainman, 2003). mob14 is a deletion, which removes most of the first exon of mob1 including the start codon (Fig. 1A). As it lacks the start codon, it is predicted not to encode a full-length Mob1 protein. This is supported by the fact that by Western blot no detectable protein is found (Weinman, 2003).
The mob2 locus encodes four variants of the Mob2 protein, each with different N-terminal resulting from alternative usage of the first exon (Wainman, 2003). The allele mob25 came from Bloomington Stock Collection (B-1161) and corresponds to a P-element insertion on variant A (Fig. 1B).
FIGURE 1 - Scheme representing the mutant alleles for mob1 (A) and mob2 (B). The mob14 (A) has a deletion on the first exon and probably does not encode a full-length protein (Wainman, 2003). The mob25 allele (B) has a P-element inserted on splice variant A.
3.3GENETIC TOOLS
3.3.1THE UAS-GAL4 SYSTEM
Taking advantage of the versatility of yeast's GAL4 as a transcriptional activator, the GAL4 system was developed by Brand and Perrimon as a mean of targeting gene expression (Brand and Perrimon, 1993). UAS promoter sequences have been introduced in a number of eukaryotic expression vectors, allowing for the production of transgenic constructs that are conditionally expressed upon the availability of GAL4, enabling the expression of lethal products (Duffy, 2002) Thus, in Drosophila, a parental stock expressing GAL4 can be crossed to another carrying a UAS-construct, therefore driving expression of the latter in the F1 progeny (Fig. 2) Furthermore, to yield spatio-temporal specific drivers of gene expression, several well-characterized enhancer sequences have been trapped by the GAL4 coding gene (Brand and Perrimon, 1993)
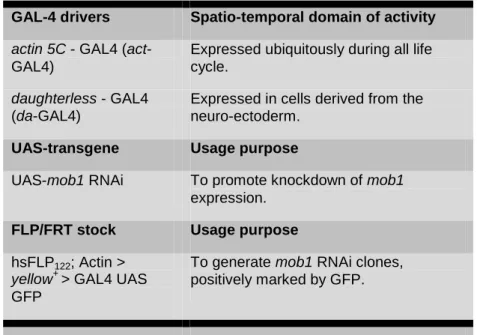
The drivers used in this work are depicted in Table 1. Expression of the UAS construct was performed at 25ºC.
FIG. 2 - The GAL4 system in Drosophila. One of the parental stocks carries the GAL4 gene in
close proximity to a known enhancer of gene expression. This stock can be crossed to another containing a UAS-transgene, and the resulting progeny will express this transgene in the pattern of expression of the GAL4 factor, which is specified by the associated enhancer region. (Courtesy of Pedro Gaspar)
TABLE 1 - Gal4 drivers, UAS construct and FLP-Out system used during the course of this work.
3.3.2FLP-OUT GAL4
A technique for the temporal regulation of the GAL4 system is to combine it with the FLP-out technique. A FRT flanked yellow cassette is inserted between the promoter and the GAL4 coding sequence (Dahmann, 2008).
GAL-4 drivers Spatio-temporal domain of activity actin 5C - GAL4 (act
-GAL4)
Expressed ubiquitously during all life cycle.
daughterless - GAL4 (da-GAL4)
Expressed in cells derived from the neuro-ectoderm.
UAS-transgene Usage purpose
UAS-mob1 RNAi To promote knockdown of mob1
expression.
FLP/FRT stock Usage purpose
hsFLP122; Actin>
yellow+ > GAL4 UAS GFP
To generate mob1 RNAiclones, positively marked by GFP.
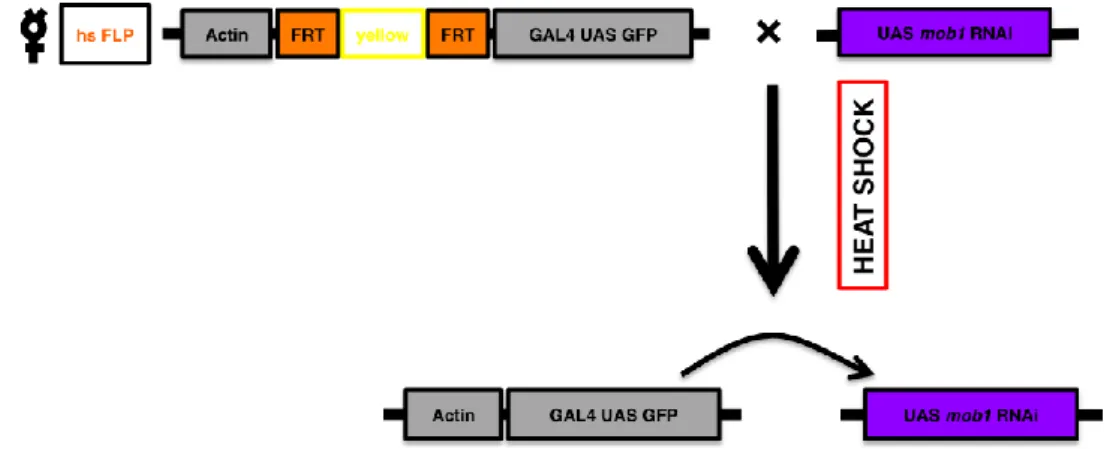
Activation of the expression requires the expression of FLP recombinase to remove the terminator cassette. Use of a heat shock-inducible FLP recombinase (hs-FLP) has the advantage that both timing and level of expression of the transgene can be conveniently adjusted by changing the timing and temperature of the heat shock that is delivered (Dahmann, 2008). In this work, the FLP-Out system has a UAS GFP reporter associated with GAL4 (Fig. 2). By these means, cells that are expressing mob1 RNAi construct will also be GFP positive. Since an Actin promoter sequence was used, clones could be generated in every tissue of the larvae. Heat shock was induced for 10 minutes at 37ºC in 2nd or 3rd larvae, in order to control the size of the clones generated.
FIG. 2 - The FLP-Out GAL4 system. Larvae resulting from the cross above depicted, after
heat shock, will have the yellow cassette flanked by the FRT sites flipped out and the Actin promoter sequence will promote GAL4 activation. GAL4 will bind to the UAS sequence and transcribe mob1 RNAi, lowering the levels of Mob1.
3.3.3GERM LINE CLONES
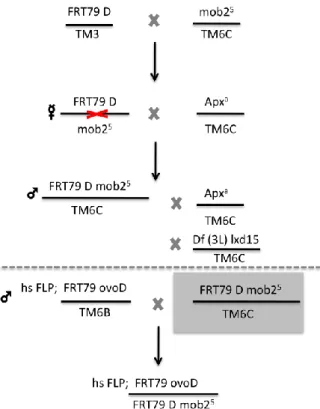
In order to eliminate the maternal contribution of the mob2 gene, germ line clones (Chou and Perriman, 1996)) were attempted to be developed, and the series of crosses are depicted in Fig.3. As the deficiency used complemented the mutant stock, the process was not complete.
FIG. 3 - Crosses designed to produce the germ line clones. First of all, flies containing FRT
79D sequence for 3L chromosome (B-8218) were crossed with the allele mob25. From this cross females that had no balancers were selected and crossed with a balancer stock. In this step, it is expected that some females would have recombined the FRT sequence and the
mob25 allele during meiosis. This way, males that would have inherited the recombined chromosome were selected by eye colour and by the absence of the marker Apxa. From these, single male crosses were done: first with a balancer stock and then with a deficiency for 3L that covered the region of mob2. The selected recombinant females would then be crossed with the ovoD males. Heat shock would be induced that would trigger recombination by the flipase (hs-FLP) between FRT (flipase recognition target) sites. After heat shock, only females that are mob2-/- would lay eggs, as the other have one or two copies of the ovoD mutation that makes them sterile.
3.4IMMUNOHISTOCHEMISTRY
3.4.1EMBRYOS
The embryos were dechorionated in commercial bleach until the dorsal appendages were lost. Then, they were washed thoroughly with water. They were then fixed in a solution containing 80% heptan, 17.5% of PBS (Phosphate Buffer Saline) and 3.7% of formaldehyde, for 30 minutes, shacking at 75 rotations / min. Formaldehyde was removed and the same volume of methanol was added. Embryos were shaken vigorously and devitilinized embryos sank to the bottom of the eppendorf. Embryos were then dehydrated in methanol and rehydrated in methanol:PBT 0.1% (PBS with 0.1% Triton-X) solutions with increasing concentrations of PBT. Embryos
were then blocked in 10% foetal calf serum and permeabilized in 0,3% Triton-X 100 in PBS (PBT 0.3 %) for 1 hour. Incubation with the primary antibodies (Table 2) was done in the same solution overnight at 4ºC. The embryos were then washed 3 times, for 15 minutes each, in PBT 0.1% and incubated in the dark with secondary antibody (Table 2) diluted in PBT 10% foetal calf serum, for 2 hours at room temperature. They were then washed in PBS and mounted in a slide with a drop of Mowiol, covered with a coverslip and sealed with nail polish.
3.4.2LARVAL TISSUES
3.4.2.1WHOLE MOUNT LARVAL BRAINS
Third instar larval brains were dissected in saline (0.7% NaCl) and fixed in 3.7% formaldehyde in PBS for 30 minutes. Brains were then blocked in 10% foetal calf serum and permeabilized in 0,3% Triton-X 100 in PBS (PBT 0.3 %) for 1 hour. If DNA was to be stained with propidium iodide (see section 2.4), RNAse was added in this step. Incubation with the primary antibodies (Table 2) was done in 0,1% Triton-X 100 in PBS (PBT 0.1 %), 10% foetal calf serum, overnight at 4ºC.
The brains were then washed 3 times, 15 minutes each, in PBT 0.1% and incubated in the dark with secondary antibody (Table 2) diluted in PBT 10% fetal calf serum, for 2 hours at room temperature. They were then washed in PBS and mounted on a slide with a drop of Mowiol, covered with a coverslip and sealed with nail polish.
3.4.2.2WING IMAGINAL DISCS
Third instar larvae wing imaginal discs were dissected in PBS and fixed in 4% formaldehyde in PEM (0,1M PIPES pH 7,0; 2mM MgSO4; 1mM EGTA) for 30 minutes on ice. As a standard protocol, wing discs were then washed and permeabilized in PBS 0,2% Triton X-100 (PBT) for 15 minutes and incubated with the primary antibodies (Table 2) diluted in PBT, supplemented with 10% foetal calf serum, overnight at 4ºC. The larvae were then washed 3 times, for 10 minutes each, in PBT and incubated in the dark with secondary antibody
(Table 2) diluted in PBT 10% foetal calf serum, for 2 hours at 4ºC. They were then mounted in a slide with a drop of Glycerol 90%, covered with a coverslip and sealed with nail polish.
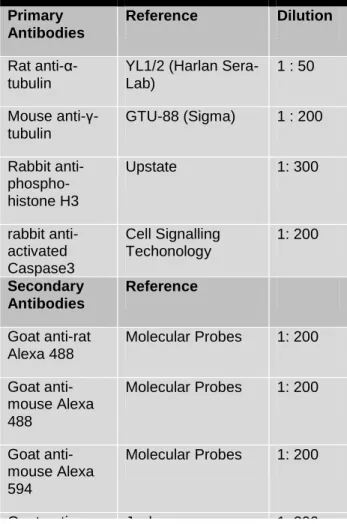
TABLE 2 - Primary and secondary antibodies used during the course of this work.
3.4.2.3PHALLOIDIN STAINING
A phalloidin-conjugated dye was used to stain F-actin. Third instar larval brains or wing imaginal discs were dissected and fixed as described previously. Before mounting, tissues were incubated with TRITC conjugated phalloidin (Sigma) in PBT 0.1% for 5-8 minutes and rinsed 3 times, 10 minutes each in PBS, before mounting.
3.4.2.4PROPIDIUM IODIDE STAINING
Primary Antibodies
Reference Dilution
Rat anti-α-tubulin
YL1/2 (Harlan Sera-Lab) 1 : 50 Mouse anti-γ-tubulin GTU-88 (Sigma) 1 : 200 Rabbit anti- phospho-histone H3 Upstate 1: 300 rabbit anti-activated Caspase3 Cell Signalling Techonology 1: 200 Secondary Antibodies Reference Goat anti-rat Alexa 488 Molecular Probes 1: 200 Goat anti-mouse Alexa 488 Molecular Probes 1: 200 Goat anti-mouse Alexa 594 Molecular Probes 1: 200 Goat anti-mouse Cy5 Jackson 1: 200 Goat anti-rabbit Cy5 Jackson 1: 200
Propidium iodide was used to stain DNA. Third instar larval brains were dissected and fixed as previously described. Before mounting, brains were incubated with propidium iodide (Molecular Probes, 1g/mL), in PBT 0.1% for 1 hour and rinsed 3 times, 10 minutes each in PBS.
3.5IMAGE ACQUISITION AND ANALYSIS
Fluorescent images were obtained on a Zeiss LSM 510 Meta and Leica SP5 confocal microscopes. Image files were processed using the Image J software (http://rsbweb.nih.gov/ij/).
3.6EMBRYONIC CUTICLE PREPARATION
The embryonic ventral epidermis has served as a unique tissue for the genetic analysis of patterning (Nusslein-Volhard and Wieschaus, 1980). Cuticle preparations therefore provide a sensitive readout of signalling activity and other patterning mechanisms (Dahmann, 2008)
Embryos were collected from 24 hours egg collections, counted and aged 48 hours at 25ºC. Unfertilized eggs and larvae were counted and excluded. Cuticles were dechorionated in bleach, rinsed in water and mounted in lactic acid / Hoyers medium (1:1). Slides were incubated for 3 hours at 65ºC. Phenotypes were scored under the microscope. Pictures were taken in Leica DM LB2 DIC microscope under a 20x objective, except for the denticles pictures, which were taken under a 40x objective.
3.7WING PREPARATIONS
Flies were frozen and washed with ethanol. Wings were dissected and mounted in lactic acid / Hoyers medium (1:1) on glass slides. Slides were
320 CCD stereoscope with a 4x magnification or under a Leica DM LB2 DIC microscope, under a 20x objective, for detailed analysis.
3.8CELL CYCLE FACS ANALYSIS IN 3RD INSTAR LARVAL BRAINS
FACS analysis was used to measure the DNA content of individual cells in the larval brain.
In this work, DNA was labelled with propidium iodide and analysed to infer the number of cells along the cell cycle. Cells designated to be in G0/G1 have n amount of DNA that corresponds to an x value of fluorescence (FL2-H). This way, cells in G2/M phases have twice the content of DNA (2n) and consequently emit 2x of fluorescence signal. Cells in S phase have an intermediate content of DNA, spanning the range between x and 2x levels of fluorescence. Likewise, cells that are in apoptosis, degrade their DNA content, presenting a level of fluorescence bellow x. Polyploid cells that are 4n, have 4x the fluorescence emission signal.
3.8.1SAMPLE PREPARATION
Brains were dissected on ice cold PBS, placed on a small FACS tube and were digested with Trypsin (Sigma), previously activated at 37ºC, for 45 minutes at 28ºC. After washing with PBS samples were fixed in 70% ethanol in PBS for 1 hour at 4ºC. Following three washes in PBS, samples were permeabilized in PBS containing 0.5% of Triton-X (Sigma) and treated with RNAse for 20 minutes at 28ºC. Then, all samples except one were stained with Propidium iodide (Molecular Probes), 10μg/mL, for 40 minutes at RT. The sample with no dye was used as a control for auto-fluorescence. Between each step samples were centrifuged, to avoid cell loss.
The data presented was acquired in FACScan using the CellQuest software and were analyzed in FlowJoe software.
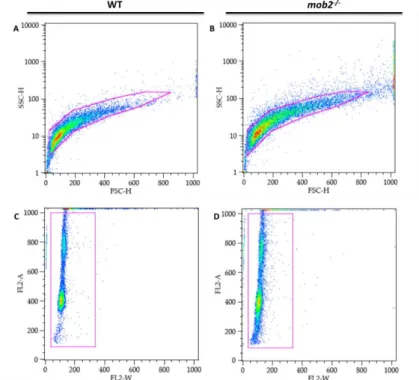
An important principle of flow cytometry data analysis is to selectively visualize the cells of interest (gating), while eliminating results from unwanted particles, e.g. debris or clumps that can be distinguished from single cells by size, estimated by forward scatter (FSC). The gates used for this analysis are the same in wild-type and mob25 brains and are depicted in Fig.4.
FIG. 4 - Gates used in the FACS analysis. The first gate applied eliminates the debris and aggregates
from the sample, in a SSC-FSC graph for wild type (A) and mob2 mutant brains (B). The second gate applied to the samples selects cells within the expected range for the fluorescence channel used, by area (FL2-A) and width (FL2-W).
3.9WESTERN BLOT OF LARVAL BRAINS
To confirm that in mob1 RNAi flies, the Mob1 protein levels were reduced, a Western blot was performed.
The Western blot presented is preliminary, as an appropriate loading control was not run simultaneously. The current loading control corresponds to another set of bands in the gel that appeared, as the serum used is not specific for Mob1.
The same number (20) of wild-type and Act 5C GAL4 > UAS mob1 RNAi brains were dissected in saline solutin (0.7% NaCl) and frozen in 2x SDS gel loading buffer:PBS (1:1). Afterwards, the samples were boiled for 5 minutes and loaded in a SDS-PAGE gel.
3.9.2SDS-PAGE
SDS-Page gels were prepared according to Sambrook and Russel, 1989. The acrylamide solution is from BioRad and TEMED from Amersham Biosciences. The gels ran in Running Buffer in a BioRad system.
3.9.3TRANSFER TO A PVDF MEMBRANE
Proteins were transferred from SDS-Page gels to PVDF nylon membranes by electrophoresis, according to Sambrook and Russel, 1989. Transfer took place in Transfer solution (25mM Tris, 250 mM glycine and 20% methanol) for 1 hour at 200 mA.
3.9.4WESTERN BLOT
Membranes were blocked for 1 hour in PBT with 5% commercial powder milk. Incubation with primary Mob1 antibody (produced previously by our lab) was done in PBT 1% milk. Membranes were then washed 3x for 15 minutes each. Secondary antibody labelled with HRP (Jackson Immuno Research) in PBT 1% milk was added for 1 hour, followed by 3 washes with PBT. To reveal, the membrane was covered with a SuperSignal West Pico (Pierce) solution, protected from light. Hyperfilm (Amersham Biosciences) was applied over the membrane to obtain the autoradiography that was revealed manually.
IV. RESULTS AND DISCUSSION
4.1DMOB1FUNCTIONAL ANALYSIS
4.1.1CHARACTERISATION OF DMOB14 ALLELE
A Drosophila Mob homologue, dmob1 (CG 3403) has been identified and mapped by in situ hybridization to region 42C on the right arm of Drosophila's chromosome II (FLYBASE).
When this work started, a dmob1 mutant allele (dmob14) had already been generated, by imprecise P-element excision (Wainman, 2003). In dmob14 homozygous mutant embryos, Mob1 protein levels are not detectable by Western blot, proving dmob1 allele to be a null or a strong hypomorph (Wainman, 2003) According to Wainman and Samora dmob14 is lethal during embryogenesis (Wainman, 2003, Samora, 2007). Both these authors claim that few adult homozygous dmob14 escapers (0.4%) are able to eclode. These escapers were characterised as being smaller and having shorter and thicker bristles (Wainman, 2003). Moreover, escaper males also have reduced fertility comparing to wild-type males. Although raising population cages with heterozygous dmob14 flies, during the course of this work no escapers could be obtained.
4.1.2CELLULAR ANALYSIS OF DMOB14 PHENOTYPE
4.1.2.1 DMOB1 MUTANT EMBRYOS HAVE UNFOCUSED MICROTUBULES AND
CENTROSOMES DETACHED FROM THE SPINDLE POLES, EARLY IN
DEVELOPMENT
To determine if the lethality observed in mob14 mutants is due to Mob1 requirement during embryogenesis, immunofluorescence was performed in early embryos (0-3h). At this stage, 13 mitotic cycles occur synchronously in
the syncytial embryo (Martinez-Arias, 1993). Therefore, if Mob1 has a role in early cell division we would observe aberrant mitotic figures.
Accordingly, in budding yeast, Mob1 mutants fail to exit mitosis (Luca et al., 1998). To determine if in Drosophila a failure in the division of the nuclei would occur in the absence of dMob1, syncytial embryos were analyzed. In this way, microtubules (α-tubulin), centrosomes (γ-tubulin) and DNA (phospho-histone 3) were immunostained and embryos were further analyzed under a confocal microscope (Fig. 1).
As previously reported by Samora, mob14 syncytial embryos appear to be morphologically normal, having a wild-type size and shape (Samora, 2007). However, the metaphase figures in approximately 90% (n=35) of the embryos analysed, show unfocused spindle poles and have centrosomes detached from spindle poles, as depicted in Fig.1B. Interestingly, during anaphase
dmob14 mitotic figures appear normal (Fig.1D). This way, we predict that despite the defects observed during metaphase, in mob14 syncytial embryos the DNA content is equally distributed into the daughter cells. Moreover, mob1 homozygous mutant embryos continue to develop and after cycle 14 of mitosis, cellularization occurs normally (Wainman, 2003)
FIGURE 1 - mob14 early embryos have defects in spindle formation during metaphase – Mitotic figures from syncytial embryos showing that in Mob1 mutants centrosomes are detached from spindle poles and spindle poles are unfocused (B and B’), compared to wild-type (A and A’). As cell cycle progresses, anaphase mob14 figures (D and D’) have a
wild-type morphology (C and C’).
The centrosome detachment and the unfocusing of the spindle poles observed in Mob1 syncytial embryos although mild, is highly penetrant. This
phenotype was also reported in Mob1 depleted S2 cells (Trammel et al., 2008) and resembles that observed after the depletion of the protein encoded by abnormal spindle (Asp), a microtubule organizing protein (Carmo-Avides and Glover, 1999). Trammel and colleagues also showed that Mob1 is not required for Asp’s localization (Trammel et al., 2008). Moreover, they showed that during mitosis, Mob1 localizes to the centrosomes and kinetochores. Altogether this data also suggests that there is no mob1 maternal contribution. Maternal contributions can be detected when an organism shows the phenotype expected according to the genotype of the mother, independently of its own genotype, due to the mother’s deposition of mRNA or proteins into the oocyte. Then, if Mob1 would be maternally contributed we would expect to see no early problems in cell division, as maternal protein would be ensuring correct development. As it is shown above, it is not the case in mob14 homozygous mutant embryos.
4.1.2.2 DMOB1 MUTANT EMBRYOS OVERCOME THE EARLY MITOTIC DEFECTS
LATER IN EMBRYOGENESIS BUT DISPLAY AN ABNORMAL MORPHOLOGY
As development continues, homozygous dmob14 embryos no longer show the mitotic defects observed in earlier stages (Fig.2 A’ and B’). The microtubules on the spindle poles appear correctly focused and centrosomes are correctly attached to the spindle poles. This recovery of the mitotic defects after cellularization had also been previously observed in the lab (Samora, 2007)
Interestingly, in few cases, embryos with an abnormal morphology were detected. In Fig.2B, dmob14 embryos have failed germ band retraction, a process that occurs at stage 12 of development (7h-9h) and involves large-scale epithelial movements, by which the tail end of the germ band moves to its final position (Martinez-Arias, 1993). Also in these embryos the internalization of the anterior part, that occurs in stage 14, seems to have occurred, suggesting that these embryos continued to develop after failing the shortening of the germ band.
FIGURE 2 - mob14 embryos overcome the early mitotic defects but display an abnormal morphology – (A) Wild type embryo during germ-band retraction that occurs in stage 12 of
development. (A’) Metaphase figure of a WT embryo during stage 12. (B) mob14
embryo where the germ-band retraction movement failed (arrow). (B’) mob14
metaphase figures, in the developing embryo after stage 14, are similar to the wild-type and no centrosome detachment was observed as in early embryos.
The recovery in mitotic defects and the appearance of morphogenetic defects suggests that Mob1 plays different roles during embryogenesis.
4.1.2.3 DMOB1 IS ESSENTIAL FOR CORRECT EMBRYONIC DEVELOPMENT
To investigate the cause and stage of lethality of the dmob14 mutant embryos, and to quantify the morphological defects previously described, cuticle preparations were performed.
The embryonic cuticle of Drosophila is deposited by the epidermal cells during stage 16 of development (Ostrowski et al., 2002) and has served as a readout for the genetic analysis of patterning.
In the mob1 mutant cuticle preparation, although 9% (n=152) of the embryos had no apparent phenotype, several developmental defects can be found. These can be put in different categories according to the developmental processes affected. In this way, cuticles were quantified by having denticle
defects, dorsal holes, head defects, germ band retraction (GBR) defects or both head and GBR defects (Fig.3).
Several of the embryos analysed (22.3%) showed head defects, i.e. the mandible was not internalized (Fig.3B). Problems in head and mandible formation can be due to a failure in the head involution process that occurs in stage 14, where the anterior ectoderm moves to the interior. In 18.9 % of the embryos, germ band retraction was the process affected (Fig.3C), as it had already been detected in the immunofluorescence analysis. Often (16.9%), these two processes fail in the same embryo (Fig.3D), showing that failure of GBR alone might not be sufficient to stop further developmental processes in
mob14 mutant embryos. Analysis of the embryonic cuticles, suggests that Mob1 is required for the completion of morphogenetic movements, such as germ-band retraction (GBR) and head involution. GBR is a process dependent on cell shape changes and movement (Schock and Perrimon, 2002) and cell-matrix interactions, mediated by laminins and integrins, were proven to be essential (Schock and Perrimon, 2003). However, neither cell division nor cell death appears to contribute to GBR (Edgar and O’Farrell, 1989; Lamka and Lipshitz, 1999). Another process affected in mob1 mutants was head formation. As mentioned above, head defects can be a consequence of the failure in the head involution process. Unlike GBR, head involution is dependent on cell death (Grether et al., 1995).
In 15.5% of the embryos dorsal holes were observed (Fig.3E). These holes were small, suggesting that dorsal closure, the process whereby the stretched amnioserosa is covered by epidermal cells that will ultimately fuse at the dorsal midline (reviewed in Martinez-Arias, 1993) occurred but it could not maintained, creating the observed gaps.
FIGURE 3 - Cuticle preparations of mob14 embryos show different categories of morphological defects - (A) Wild-type cuticle. (B) mob14 cuticle with head defects. (C)
mob14 cuticle with GBR defects. (D) mob14 cuticle with both head and GBR failure. (E) mob14 cuticle presenting holes on the dorsal side. (F) mob14 cuticle with several denticle belts missing. (G) Wild-type denticle belt pattern. (H) mob14 denticle belts are missing some rows and the structure is overall disorganized. (I) Quantification of the categories of defects observed (n=152).
Finally, in 26.4% of the cuticles, defects on the denticles were observed (Fig.3F and G). Denticle-secreting cells are polarized cells that form segmentally repeated belts (reviewed in Martinez-Arias, 1993). This type of polarization is called Planar Cell Polarity (PCP) and is present in several
Drosophila tissues. In mob14 embryos, some denticle belts were missing and also within each belt denticles were disorganized and some rows were missing.
Overall, the cuticle analysis reveals that Mob1 has an important role during morphogenesis, and is essential for embryonic development when cells
self-assemble tissues and organs. All the developmental stages affected share the requirement of morphogenetic movements. This morphogenesis process requires dynamic regulation of cell adhesion and cell shape change (Halbleib and Nelson, 2006), This suggests that, during later stages of embryonic development, Mob1 has a crucial role in tissue reorganization and movement and apparently no role in mitosis as no major cell division events occur in these stages of development.
4.1.2.4 DMOB1 MUTANT LARVAE HAVE OVERGROWN BRAINS
As already mentioned above, mob14 is late embryonic lethal. When mob14 heterozygous flies were grown at low density (approximately 5 to 10 flies per vial), occasionally, few (during the course of this work, n=17) mob14 homozygous 3rd instar larvae could be obtained.
These larvae would continue to wonder around the food even after the heterozygous had pupated, suggesting that they have a delayed pupation or are unable to pupate. Around 1/3 of the homozygous larvae would eventually pupate and die. The 2/3 of homozygous larvae left would become immotile and routinely die. When dissected, mob14 homozygous mutant larvae had an overgrown brains, not observed in motile larvae (Fig.4). The brains from the immotile larvae were stained for F-actin, with phalloidin that highlights F-actin, in order to understand if the tissue’s pattern was maintained in overgrown brains.
FIGURE 4 - mob14 homozygous larvae have overgrown brains – F-actin highlighted by
phalloidin points out mob14 brains of 3rd instar larvae (B) are overgrown, comparing to the wild-type (A). (C) Quantification of the area (in pixel size) of the mob14 homozygous brain
(mob14*), compared to the heterozygous (mob14) and the WT, shows that mob14* larval
Firstly, this analysis revealed a 4,4x increase in size, compared to the WT, as it can be seen in Fig.4. Furthermore, mob14 tissue did not have an organized structure and no cell types (specifically giant neuroblasts) could be identified. This suggests that cells in mob14 tissue were undifferentiated (Fig.5). Moreover, cells showed an abnormal shape and many had actin puncta inside (Fig.5 arrow), although cell size remained similar to WT neuroblasts.
FIGURE 5 - mob14 homozygous brains have an abnormal structure - In wild-type (A) the
tissue is organized and giant neuroblasts can be distinguished from the other cells types. A closer look to the Mob1 mutant larval brain structure (B) shows that it is disorganized, cell shape is abnormal and actin puncta can be found inside the cells (arrow) that are undistinguishable from each other. (C) Despite these defects, cell size remains unaltered comparing to WT brain neuroblasts.
One of the causes for tumour formation is the misregulation of growth control mechanisms. Many mutations leading to overgrown and undiferentiated, like the ones presented here for Mob1 homozygous mutant larvae, have been identified. The most stricking examples are of the well known lethal giant
larvae (Lgl) tumour suppressor family members: Dlg (Discs large) and Scrib
(Scribble) (Humbert et al., 2003) and more recently a member of the Mob1 family, mats (mob as tumour suppressor) that is part of the Hippo signalling pathway that controls cell division and apoptosis (Saucedo and Edgar, 2007)
4.1.2.5 DEPLETION OF DMOB1IS LETHAL IN EARLY PUPAL STAGES, BUT NO
OVERGROWN STRUCTURES ARE FOUND IN 3RD INSTAR LARVAE
To try to better understand the role of dmob1 in cell cycle and development, a VDRC RNAi line was used. To deplete Mob1 in a tissue and time controlled manner we made use of the UAS-GAL4 system (see Materials and Methods).
To confirm that in mob1 RNAi flies Mob1 protein levels were reduced a Western blot was performed. Preliminary results suggest that Mob1 levels are lower when this construct is expressed (Supplementary Figure 1).
As a first approach, UAS mob1 RNAi flies were crossed with two different ubiquitous drivers: daughterless (da) GAL4 and actin (act) GAL4. The progeny that came out from both of these crosses is early pupal lethal (90-98% lethality in da Gal4 > UAS mob1 RNAi and 100% in act Gal4 > UAS
mob1 RNAi) at 25ºC. These 3rd instar larvae display a wild-type size and shape of both brains and wing imaginal discs, contrary to what was expected, regarding the overgrown structures reported above for homozygous mutants of the null allele mob14 (Fig.6).
FIGURE 6 – Depletion of Mob1 leads to wild-type size brains and imaginal discs –
Expression of mob1 RNAi under the control of Actin 5C promoter is lethal in early pupal stages. Analysis of larval brain (B) shows no differences compared to the wild-type (A). Also, no differences are found in wing imaginal discs between Act GAL4 > mob1 RNAi (D) and wild-type (C). (n=7)
To assess if the number of cells undergoing mitosis was higher in the mob1 RNAi brains were immunostained with phospho-histone 3 (PH3) that labels cells that are undergoing mitosis, and α-tubulin, that marks microtubules and allows the visualization of the brain’s shape. The number of mitosis in 10 microscopy fields was counted for both WT (Fig. 7A) and Act GAL4 > mob1
RNAi (Fig. 7B). Even though there is a slight increase in the number of mitotic cells, no statistically significant differences from the control were found (Fig. 7C).
FIGURE 7 – Depletion of Mob1 leads to no difference in the number of cells undergoing mitosis in the larval brain – (A) Wild-type larval brain lobe. (B) Act GAL4 > mob1 RNAi brain
lobe. (C) Quantification of the number of cells in mitosis shows that there is no difference between Mob1 depletion and control. This quantification is an average of the total of brains analyzed (n=12).
As mentioned above, Wainman and Samora reported a reduced fertility in the
mob14 homozygous escaper males (Wainman, 2003; Samora, 2007). Although no homozygous mutant escapers were available during the course of this work, fertility was measured in the mob1 RNAi escaper males (n=25).
To assess male fertility, da GAL4 > UAS mob1 RNAi males were crossed with wild-type virgin females from the Oregon-R (OR) strain and the number of fertilized eggs laid by these females as well as the viability of the progeny were measured. As controls OR, da GAL4 and UAS mob1 RNAi males were used, to try to correct for variations in fertility due to differences in the genetic background.
As it can be seen in the graphs presented in Fig.8 no significant differences are found between the controls and the depletion of Mob1 in the number of fertilized eggs (Fig. 8A) or in the viability of the progeny (Fig. 8B). This led to the conclusion that mob1 RNAi males are as fertile as the control males.
FIGURE 8 – Depletion of Mob1 leads to no difference in male fertility (A) The number of
eggs laid by OR females when fertilized by da GAL4 > UAS mob1 RNAi or the controls OR, da GAL4 and UAS mob1 RNAi males does not differ significantly on average. (B) Likewise, the viability of the fertilized eggs is not significantly different.
4.1.2.6 DMOB1RNAI CLONES HAVE PROBLEMS IN POLARITY IN THE ADULT EYE AND WING
To analyze the behaviour of clonal cells mutant for mob1 in an heterozygous background, clones were induced using the mob1 RNAi line. This line was used instead of the null allele mob14 because the mob1 gene is located very close to chromosome II centromeric region. This fact leads to a very low probability of recombination that decreases with increased proximity to the centromere.
The method used was the Flip Out system (see Materials and Methods) that generates mutant cells randomly, after heat-shock induction. This means that the mob1-depleted cells can be generated in any tissue of the larvae, but only in those cells that undergo cell division. In our case the clones can be detected because they are positively marked by GFP. The mosaic flies were lead to eclode and, as a first approach, the eyes and wings were analyzed.
As preaviously mentioned, during their differentiation, epidermal cells form a rich variety of polarized structures that typically have not only distinct apical and basolateral membrane domains, that differ both biochemically and structurally, but also polarization within the plane of the epithelium, called PCP (Humbert et al., 2003). Apart from the embryonic cuticle, in Drosophila, PCP is evident in tissues derived from the imaginal discs, like the eye and the wing, where this additional axis of polarity is required for tissue function and is reflected by the apical cellular projections. In the eye, PCP is reflected in the mirror-symmetric arrangement of ommatidia relative to the dorsal-ventral midline as it can be seen in the WT (Fig. 9A). In the clonal cells, induced by the Flip Out system, which are depleted of Mob1, ommatidia show an altered or disrupted polarity (Fig. 9B). This phenotype is generally called “rough eye” and is common in mutants for proteins that have a role in PCP, such as
frizzled (fz) (Humbert et al., 2003).
FIGURE 9 – Mob1 RNAi clones have altered polarity in the ommatidia – In the eye, clonal
cells depleted from Mob1 (B) can be easily detected as they have an altered polarity that disrupts the pattern seen in the wild-type.
In the wing, PCP is reflected in the choice of the site at which an actin-based hair outgrowth initiates in each cell and the direction the hair points (Humbert
et al., 2003). When depletion of Mob1 was induced, the subset of clones
present in the wing was always very small (Fig. 10 B arrow). Nevertheless, when observed in detail, the cells with reduced Mob1 levels showed a loss of wing hair polarity (Fig10 B’) when compared to the wild-type tissue that surrounds the clone.
FIGURE 10 – Mob1 RNAi clones have altered polarity in the wing – (A) Wild-type wing (B) Clonal cells
Mob1 depleted are pointed out by the arrow. (C) Magnification of the clonal cells in (B) revealing an altered polarity of the wing hairs. This disorganized clonal area contrasts with the oriented pattern of wild-type cells that surround it.
Like we have previously seen in the eye’s retina, this phenotype also appears when PCP genes are mutated in the wing, as a consequence of disrupting the PCP signalling pathway where fz plays a central role.
To investigate the reason why the clones were very small in the wing, wing imaginal discs were analyzed by immunofluorescence, searching for an early
seen in Fig. 11B, comparing to the wild-type, although there are several clones, they are very small (note that clonal cells formation is induced in 2nd instar larvae). Interestingly, by analyzing F-actin distribution, no defects can be detected in cell shape. This suggests that clonal cells are unable to proliferate at the same rate as the wild-type ones or that they may undergo apoptosis.
FIGURE 11 – Mob1 RNAi clones are small – (A) Wild-type clones (A’) Phalloidin (Actin)
channel (A’’) Clones marked by the presence of GFP (B’) F-actin highlighted by phalloidin shows that clonal cells have a wild-type morphology. (B”) clonal cells appear in every part of the wing imaginal disc, but clones are always small.
4.1.2.7 DMOB1 RNAI CLONES HAVE PROBLEMS IN PROLIFERATION AND PATTERNING OF THE ADULT ABDOMEN
Further analysis of Mob1-depleted clonal cells, lead to the detection of defects in the adult abdomen. The adult abdomen does not derive from imaginal cells, like the eye and wing, but instead arises from nests of cells intimately associated with larval structures, which are called histoblasts (Curtiss and Heilig, 1995). For example, the abdominal histoblast nests form among the cells of the larval abdomen (Curtiss and Heilig, 1995). The abdominal histoblasts do not divide during the larval stages, but begin to divide within the
first 3 hours after pupation. At about 15 hours of pupal life, the abdominal histoblast cells begin to migrate and displace the larval cells ( Martinez-Arias, 1993). Following proliferation and migration, cells of adjacent segments fuse at the dorsal/ventral and segmental borders. During the terminal stages of abdominal development the cells differentiate to produce epidermal tissues, and to secrete the adult cuticle (Curtiss and Heilig, 1995 and references within).
As depicted in Fig. 12 three types of problems were observed in the adult abdomen formation. Firstly, clonal adult segments seemed to be not completely closed (Fig 12.B). This suggests that Mob1 depleted histoblasts have problems migrating or proliferating.
Interestingly in few cases, a mirror-symmetric patterning in the abdominal segments was also observed (Fig. 12C). This suggests that there is a transformation of the anterior compartment structure to a posterior compartment identity. This phenotype had previously been described in mutants for the gene optomotor-blind (omb) shown to control cell fate and polarity in the adult abdominal segments by mediating the function of Hedgehog, a well-characterized gene important for anterior-posterior patterning in Drosophila (Kopp et al., 1997). Finally, in abdominal Mob1-depleted clonal cells, split bristles were observed (Fig.12 D). The morphogenesis of these cell extensions involves the regulated activation of both the machinery foractin and microtubule cytoskeleton (Geng et al., 2000). This split-bristle phenotype had also been described before in mutants for
tricornered (trc) (Geng et al., 2000). trc encodes the Drosophila Ndr protein
kinase(Nuclear-Dbf2-Related) and is required for the normal morphogenesis of a variety of polarized outgrowths including epidermal hairs and bristles, independently of the fz pathway.
FIGURE 12 – Mob1 RNAi clones in the adult abdomen – (A) Wild-type adult abdomen. (B)
In Mob1 depleted histoblasts proliferation and/or migration seems to be compromised. (C) Mob1 depleted segment show problems in anterior-posterior patterning. (D) Mob1 depleted abdominal epidermal cells have split bristles.
As mentioned before in the yeast S.cerevisiae the kinase Dbf2 is regulated by Mob1 (see Introduction). He and colleagues provided genetic and biochemical data showing that in Drosophila, Trc also interacts with and is activated by Mob proteins, particularly Mob4 (He et al., 2005). They also suggested that unlike in yeast, in Drosophila individual Mob proteins interact with multiple kinases and that individual NDR family kinases interact with multiple Mob proteins (He et al., 2005). This suggests that perhaps Mob1 is interacting in the same pathway as Mob4 and Trc and regulating bristle development.
4.2DMOB2FUNCTIONAL ANALYSIS
4.2.1CHARACTERISATION OF DMOB25 ALLELE
The Drosophila Mob homologue, dmob2 (CG 11711), is located in region 68C of the left arm of chromosome III. The genome project annotation predicts that
dmob2 is a complicated gene that encodes four variant mRNAs from exons
that span more than 40 Kb (Flybase).
The allele dmob25 came from Bloomington stock collection (B-1161) and corresponds to a P-element insertion. Dmob25 had previously in the lab undergone complementation tests and the P-element inserted in dmob25 excision was shown to rescue dmob25 phenotype (Samora, 2007)
4.2.2MATERNAL CONTRIBUTION OF DMOB2
At standard lab conditions, the homozygous mob25 mutants are able to survive until late 3rd instar larval state of development. This can be due to maternal deposition of the protein into the oocyte in heterozygous females. In this case, only when zygotic transcription for the gene is required, e.g. for the mitosis of neuroblasts and imaginal discs, the mutation displays the consequences of its loss (Glover, 1990). Another possibility that would explain the late lethality of the mob25 homozygous mutants is that Mob2 could only be required during later stages of larval development. In this later scenario, proliferation and differentiation of brain imaginal discs cells are examples of process that could be dependent on zygotic mob2.
To test whether mob2 is maternally contributed and if so, what are the consequences of its loss in cell division during early developmental stages, germ line clones were attempted to be developed (see Materials and Methods). Interestingly, we observed that the allele mob25 complemented the deficiency for that region in chromosome 3L. This could be due to a contamination in the stock from the deficiency used. We suspect that this is
the case because we sustained the mob25 phenotype previously reported by Samora, 2007. Currently, this is being analyzed in more detail in the lab.
4.2.3ANALYSIS OF DMOB25 HOMOZYGOUS PHENOTYPE
4.2.3.1 DMOB2 IS ESSENTIAL FOR BRAIN AND IMAGINAL DISCS GROWTH
DURING LARVAL STAGES
mob25 third instar larvae have a wild-type size (Fig. 1 A and B), but they are never able to pupate and no adult homozygous escapers were found. Additionally, in approximately 50% of the larvae melanic masses are present in a non-specific manner along the body larvae (Fig. 1C). Melanic masses have been described as being frequent in mutants for genes in the innate immune pathways that leads to the production of melanine, important for microbial control. Also, this masses can arise by an immune response to abnormal or apoptotic tissue of the individual (Lemaitre and Hoffman, 2007).
FIGURE 1 - dmob2 larvae have a wild-type size and melanic masses are present along the larval body. (A) Wild-type larva and mob25 mutant larva (B) have the same size. However in mob25 melanic masses (arrow) are found in 50% of the cases (n=90). These masses are present throughout the body (C) in a non-specific pattern.
The brain and the imaginal discs are structures that during larval stages undergo massive cell division and therefore are used as models to study cell division at the larval stages. In mob25 larvae, the brain lobes are 3 times
smaller than the wild-type (Fig. 2) and the imaginal discs, when present, are smaller than wild-type wing imaginal discs. This reduction in brain size is depicted in Fig. 2 were we can see that, in fact, the number of cells undergoing mitosis is 8.5x lower in mob25 mutants and the metaphase/anaphase ratio observed is approximately 3x bigger than the wild-type, suggesting a blockage in metaphase (Samora, 2007).
FIGURE 2 - dmob2 larvae have smaller brains. Brains immunostained with Propidium
iodide (to mark DNA content) and anti--tubulin antibody (A) Wild-type brain (B) mob25 mutant larval brain has smaller lobes (C) Quantification of the brain lobe’s size reveals that
mob25 mutant brains are three times smaller than the wild-type (p<0.01 and n=12).
Altogether, these data implicate Mob2 in an important role during cell division in the larval brain and imaginal discs, which are tissues that undergo massive cell division during larval stages.