1
Metabolomics of Escherichia coli treated with the antimicrobial Carbon Monoxide-Releasing Molecule CORM-3 reveals TCA 1
cycle as major target 2
3
Running title: CORM-3 inhibits the TCA cycle of E. coli 4
5
Sandra M. Carvalho1#, Joana Marques1, Carlos C. Romão1, and Lígia M. Saraiva1# 6
7
1
Instituto de Tecnologia Química e Biológica António Xavier, Universidade Nova de Lisboa, Av. da República 2780-157 Oeiras, 8 Portugal 9 10 *Correspondence: 11
Dr. Sandra M. Carvalho (smcc@itqb.unl.pt) and Dr. Lígia M. Saraiva (lst@itqb.unl.pt) 12
Instituto de Tecnologia Química e Biológica NOVA, UNL, Av. da República 2780-157 Oeiras, Portugal; Phone: +351-214469328; 13
Fax: +351-214411277 14
15
Keywords: Carbon Monoxide Releasing Molecule-3 (CORM-3), Escherichia coli, metabolomics, Tricarboxylic Acid (TCA) cycle, 16
nitrogen metabolism, glycolysis 17
2 ABSTRACT
18
In the last decade carbon monoxide-releasing molecules (CORMs) have been shown to act against several pathogens and to be 19
promising antimicrobials. However, the understanding of the mode-of-action and reactivity of these compounds on bacterial cells is 20
still deficient. In this work, we used a metabolomics approach to probe the toxicity of the ruthenium(II) complex 21
Ru(CO)3Cl(glycinate) (CORM-3) on Escherichia coli. By resorting to 1H-NMR, mass spectrometry and enzymatic activities, we show
22
that CORM-3 treated E. coli accumulates higher amounts of glycolytic intermediates, independently of the oxygen growth conditions. 23
The work provides several evidences that CORM-3 inhibits glutamate synthesis and the iron-sulfur enzymes of the TCA cycle, and 24
that the glycolysis pathway is triggered in order to establish an energy and redox homeostasis balance. Accordingly, supplementation 25
of the growth medium with fumarate, alpha-ketoglutarate, glutamate and amino acids cancels the toxicity of CORM-3. Importantly, 26
inhibition of the iron-sulfur enzymes glutamate synthase, aconitase and fumarase is only observed for compounds that liberate carbon 27
monoxide. Altogether, the work reveals that the antimicrobial action of CORM-3 results from intracellular glutamate deficiency and 28
inhibition of nitrogen and TCA cycles. 29 30 31 32 33 34
3 INTRODUCTION
35
Carbon monoxide (CO)-releasing molecules (CORMs) are metal carbonyl complexes composed by a transition metal centre such 36
as ruthenium, manganese or molybdenum, bound to CO and other ancillary ligands. The most representatively characterized 37
antimicrobial CORMs are the ruthenium containing compounds [Ru(CO)3Cl2]2 (CORM-2; DMSO soluble) and the water soluble
38
Ru(CO)3Cl(glycinate)] (CORM-3) that together with other CORMs have been reported as antimicrobials against several microbial
39
pathogens, such as Escherichia coli, Helicobacter pylori, Neisseria gonorrhoeae, Staphylococcus aureus, Candida albicans, and to 40
protect mice from malaria (1–6). The several studies have showed that the bactericidal concentration of CORMs depends not only on 41
the microorganism but also on the oxygen growth conditions. As expected, the CO released by CORMs inhibits the aerobic respiration 42
chain, due to the direct binding to intracellular respiratory heme enzymes (7, 8). Aerobically, the antimicrobial properties of CORMs 43
rely also on the generation of reactive oxygen species (ROS) (9). E. coli mutant strains with deletions in soxS, sodAB, oxyR and katEG 44
are less resistant to CORM-2 than the parental strain, and the inhibition of the formate-dependent respiratory chain by CORM-3 also 45
led to generation of ROS. Consistent with these results, CORM-2 and CORM-3 increase the transcription of members of the SoxRS 46
and ArcAB regulons (8, 9). CORMs also target non-heme proteins, as shown by the susceptibility of an E. coli heme deficient strain 47
(ΔhemA) to CORM-3, which caused reduction of free thiol levels (10). Moreover, CORMs are also bactericidal under anaerobic 48
conditions and, in some cases, it was observed that lack of oxygen even increases their toxicity, as occurred for E. coli and S. aureus 49
(1). 50
4
Transcriptomics studies have been extensively used to elucidate how CORMs impact cell physiology, and revealed that a massive 51
response in the gene expression profile occurs in aerobic/anaerobic CORM-treated cells. CORM-2 and CORM-3 elicit repression of 52
genes overrepresented in cellular metabolic processes, such as catabolic processes, nucleotide metabolism and energy production. In 53
particular, these CORMs caused significant downregulation of the E. coli cyoABCDE operon (encoding the cytochrome heme-copper 54
bo3 quinol oxidase), and sdhABCD operon that encodes the membrane-bound the succinate:quinol oxidoreductase (also known as
55
succinate dehydrogenase, SDH), which couples the Krebs cycle to the respiratory chain. Moreover, CORMs modified the expression 56
level of genes involved in glycolysis and fermentation. Significant transcriptional changes also occurred in genes involved in 57
homeostasis, metabolism, transport and regulation of metal ions, such as iron, zinc and iron-sulfur centres, as well as in acetate, sulfur, 58
cysteine, glutathione and methionine metabolisms (8, 11,12). Interestingly, studies performed with E. coli treated with CO gas 59
displayed a transcriptional pattern very similar to that observed for CORMs (13). 60
Although the efficacy of CORMs as antimicrobials is well established, other approaches are required to fully understand their 61
mode of action. Therefore, we resorted to a metabolomics analysis, using 1H-NMR and mass spectrometry, combined with enzymatic 62
assays to explore the effect of CORM-3 on E. coli grown under aerobic and anaerobic (fermentative) conditions. We show that 63
CORM-3 causes significant perturbations on the central carbon and nitrogen metabolisms of E. coli, which if not compensated causes 64
bacterial death. 65
66 67
5 MATERIALS AND METHODS
68 69
Bacterial strains and growth conditions 70
Escherichia coli K12 MG1655 was grown aerobically and anaerobically, at 37 °C, in minimal salts M9b medium, which was 71
composed of 0.45% (wt/vol) KH2PO4, 1.05% (wt/vol) K2HPO4, 0.05% (wt/vol) sodium citrate and 0.1% (wt/vol) (NH4)2SO4), 40 mM
72
glucose, 1 mM MgSO4, 10 µM MnCl2, 10 µg/mL thiamine HCl, and 40 µg/mL of arginine, histidine, proline, threonine and leucine
73
(all from Sigma). 74
For the aerobic experiments, cells were grown in a flask with a volume ratio of 1:5. The anaerobic conditions were achieved by 75
growing the cells in rubber-stoppered bottles filled with 50 mL medium, which prior to cell inoculation was deaerated for 15 min with 76
nitrogen gas. In these experiments, cultures were started by addition to fresh medium of mid-log grown cells so that the initial OD600nm
77
was ~0.05. When cells reached an optical density of approximately 0.3 (mid-log), cells were left untreated or exposed to 120 μM of 78
CORM-3 (Sigma), iCORM-3 or RuCl2(DMSO)4, 50 mM L-glutamic acid potassium salt monohydrate (Sigma), 50 mM NaCl or 50
79
mM KCl salts. Bacterial growth was monitored by measuring OD600nm hourly. Cell viability was determined by counting the number
80
of colony-forming units (CFUs) formed on agar plates per mL. CORM-3 was always freshly prepared as a 10 mM stock solution in 81
milli-Q water. The inactive form of CORM-3 (iCORM-3) was prepared as described before (14) and RuCl2(DMSO)4 was bought from
82
Strem Chemicals (Bischheim, France) and dissolved in DMSO, so that the final concentration of DMSO in the medium did not exceed 83
6
1%. Considering the toxicity of DMSO, control growths of E. coli containing the same quantity of DMSO as that used on the growths 84
with RuCl2(DMSO)4 were also performed.
85
E. coli was also grown in 24-well plates, that contained 2 mL of M9b medium, and treated with CORM-3 (200 µM), at 37 °C, for 86
18 h. The cell culture plates were incubated with an agitation of 90 rpm (aerobic growths) or statically in a 5 L jar containing 87
AnaerogenTM 2.5 L sachets (Thermo ScientificTM OxoidTM), which generate an anoxic atmosphere. 88
The effect of adding TCA cycle intermediates (citrate, isocitrate, α-ketoglutarate, succinate, fumarate or malate), glycolytic 89
intermediates (PEP or pyruvate), central nitrogen intermediates and precursors of glutamate (glutamate, Gln, His, Pro, Arg), and 90
glutathione and amino acids involved in its synthesis (GSH, Cys, Met, Ser, Gly) was also tested. For this purpose, E.coli cells treated 91
with an inhibitory concentration of CORM-3 (200 µM) were grown in M9b medium supplemented, separately, with each one of the 92
compounds mentioned above, which were present at final concentrations of 5, 10 and 50 mM. Due to its low solubility, glutamine was 93
used at a final concentration of 5 mM, and to avoid cell toxicity assays were performed with cysteine at 500 µM. 94
95
Quantification of end-products (excreted metabolites) by 1H-NMR 96
E. coli was grown in M9b medium and cell samples taken immediately after inoculation (time zero) and each hour for 5 h after 97
addition of different concentrations of CORM-3 (60, 90 and 120 μM). Samples were also collected 3 h after the addition of 120 μM 98
iCORM-3 and 120 μM RuCl2(DMSO)4. Cells were centrifuged during 2 min at 11,800 x g, and the supernatants were filtered
99
(Rotilabo®-syringe filters; PES, sterile, 0.22 µm) and stored at -80 °C until further analysis. The filtered supernatants (60 µL) were 100
7
prepared in 90% D2O/1.67% TSP (final volume = 600 µL) for analysis by 1H-NMR as described in (15). Briefly, the metabolites 101
present on the cell supernatants were quantified in a Bruker AVANCE II 500 MHz spectrometer (Bruker BioSpin GmbH) operated by 102
TOPSPIN software, and using a 5 mm BBIXYZ high resolution probe head, at 16 °C to allow the shift of the water peak from the 103
glucose resonances. To acquire spectra the standard Bruker pulse program zgprde for water presaturation, with a 8 µs pulse width 104
corresponding to 70º flip angle and a relaxation delay time of 3.5 s (d1= 2.5 s, d20= 1 s) for saturated spectra or with an extra 105
relaxation delay time (d20) of 60 s to allow full spin relaxation, was used. Spectra were referenced to the resonance of externally 106
added trimethylsilyl propionate (TSP), which was assigned to 0 ppm. Concentrations were calculated from the areas of the resonances 107
in 1H-NMR spectra by comparison with the area of the TSP resonance, and after application of an appropriate factor for correcting 108
saturation of resonances and also taking into account the number of protons giving rise to the NMR signals/resonances. Using this 109
information, the substrate consumption and concentration of excreted metabolites normalized to the OD600nm were calculated for each
110
condition. 111
112
Mass spectrometry analysis 113
E. coli was grown from an overnight culture, aerobically and anaerobically, in M9b medium to an OD600nm of 0.3, and grown
114
in the absence (control) and presence of CORM-3 (120 μM) for 1 h, and harvested by centrifugation (20,000 x g, 1 min). Cell pellets 115
were washed with 0.9 % (wt/vol) sodium chloride solution (20,000 x g, 1 min), flash frozen in liquid nitrogen, and stored at -80 °C 116
until further use. Extraction and semi-quantitative analysis of intracellular metabolites was carried out by Metabolomic Discoveries 117
8
GmbH Company (Potsdam, Germany). Briefly, cell pellets were resuspended in 80% methanol (- 20º C) containing internal standards 118
to a final concentration of 200 mg pellet (wet weight) per mL. Glass beads were added and cells were disrupted by 5 cycles of 30 s of 119
vortex and 30 s of cooling on ice. Samples were then centrifuged at 4º C at 4,000 x g for 15 min. The supernatant was stored at -80º C 120
until LC-MS analysis. Metabolites were analysed by LC–tandem mass spectrometry in a LCMS-8050 Shimadzu triple quadrupole 121
mass spectrometer equipped with an electrospray ionization (ESI) source and operated in multiple reaction mode (MRM). 122
Chromatography was performed using a Zorbax SB-Aq 80 Å column (Agilent, Santa Clara, USA), operated by a Shimadzu UPLC 123
system (Shimadzu, Japan). The LC mobile phase was A) Water (Thermo, USA) with 0.1% Formic Acid (Thermo, USA) and B) 124
Methanol with 0.1% Formic Acid with a gradient from 100% A to 10% at 5 min, to 5% at 0.5 min, to 0% at 0.3 min until 8 min. The 125
flow rate was 400 μL/min, and an injection volume of 1 μL was used. Data were extracted using the software Labsolution (Shimadzu, 126
Japan) for peak area extraction of the appropriate m/z features. Compound identities were confirmed via retention time relative to 127
authentic chemicals (standards) and ion dissociation mass spectrometry (MS/MS) with fragmentation patterns. The internal standard 128
(MES) was used to normalise each compound peak area. Metabolomic Discoveries GmbH Company was not involved in the design, 129
data collection and analysis, and preparation of this manuscript or decision to publish. 130
131
Enzyme activities 132
E. coli was grown under anaerobic conditions in M9b medium and rubber-stoppered bottles, as described above, and treated 133
for 1 h with 120 μM of CORM-3, iCORM-3 or RuCl2(DMSO)4. Aconitase activity was also measured in cells treated for 10 min with
9
CO gas or N2 gas during 10 min and harvested 10 min later. Cell disruption and enzymatic activities were done in an anaerobic 135
chamber, at room temperature. All activities were assayed in a WPA apparatus (Biochrom), and normalized to the total cellular protein 136
content determined by the BCA method (Pierce). 137
138
Aconitase B (AcnB) and isocitrate dehydrogenase (IcdH) activities 139
E. coli (circa 50 mL) was centrifuged at 7,500 x g for 15 min, at 4 °C, and cells were resuspended in 250 μL buffer A (50 mM 140
Tris-HCl pH 7.6 with 0.6 mM MnCl2), and incubated with lysozyme (2.5 mg mL-1), for 10 min. Samples were treated with DNase
141
(180 μg mL-1
), for 10 min, and cell extracts were collected after removal of debris by centrifugation (9,700 x g, 12 min). 142
Isocitrate dehydrogenase activity of these cell extracts was measured in a reaction mixture containing 10 μL of extract and 0.2 143
mM NADP+ in 1 mL buffer A, and the reaction was initiated by addition of 30 mM D, L-isocitrate. The production of NADPH was 144
monitored at 340 nm (Ɛ340 nm = 6.22 mM-1 cm-1).
145
Aconitase activity was measured as described before (9) by following the production of NADPH. In this case, the reaction 146
mixture contained 50 μL of cell extract, 0.2 mM NADP+, 1 unit of isocitrate dehydrogenase (Sigma) in 900 μL of buffer A. Reaction 147
was initiated by addition of 30 mM sodium citrate. 148
For the isocitrate dehydrogenase and aconitase activities, one unit was defined as 1 nmoL of NADPH formed per min, at room 149
temperature. 150
10 152
Glutamate synthase (glutamine oxoglutarate aminotransferase, GOGAT) activity 153
E. coli cultures (4 mL) were centrifuged at 6,200 x g for 10 min at 4 °C, washed and resuspended in 300 μL of 100 mM Tris-154
HCl pH 7.8 buffer. Cells were permeabilised by addition of 20 μL sodium deoxycholate 1% (wt/vol) and 20 μL toluene, vortex and 155
incubated at 37 °C, for 20 min. The permeabilised cells (100 μL) were added to a reaction mixture that contained 10 mM glutamine 156
and 0.2 mM NADPH in 1 mL of 100 mM Tris-HCl pH 7.8 buffer. The reaction was initiated by addition of 5 mM of α-ketoglutarate, 157
and the glutamate synthase activity was determined following the decrease of the absorbance at 340 nm, i.e., the consumption of 158
NADPH (9). One unit of glutamate synthase activity was defined as 1 nmoL of NADPH consumed per min, at 25 °C. 159
160
Fumarase activity 161
E. coli cultures (50 mL) were centrifuged at 7,500 x g for 15 min at 4 °C, and cells washed with sodium phosphate buffer (50 162
mM, pH 7.3), resuspended in the same buffer (2 mL), and lysed by five freeze-thaw cycles using liquid nitrogen and a room 163
temperature water bath. Samples were cleared by the addition of 0.5% (wt/vol) sodium deoxycholate and immediately deaerated with 164
nitrogen gas. Lysates (10 μL) were added to the reaction mixture that contained 50 mM L-malic acid in 1 mL of 50 mM sodium 165
phosphate pH 7.3 buffer. The fumarase activity was determined following the decrease in absorbance at 240 nm for the consumption 166
of fumarate (Ɛ240 nm = 2.44 mM-1 cm-1) (16). One unit of fumarase activity was defined as 1 μmoL of fumarate consumed per min, at
167
25 °C. 168
11 169
Membrane permeability 170
Membrane permeability of E. coli cells treated with CORM-3 was evaluated using the LIVE/DEAD™ BacLight™ Bacterial 171
Viability method (L7012, Molecular Probes). E. coli grown aerobically to an OD600nm of about 0.3 was left untreated or exposed to
172
120 μM and 200 μM of CORM-3 (Sigma) for 1 h and 3 h. To guarantee that similar number of cells were analysed, a ratio of OD per 173
volume of cells (mL) of 1.7 was used in all cases. Cells were centrifuged (10 min, 10,000 x g), washed two times with 0.85% (wt/vol) 174
NaCl, and the pellet resuspended in 0.3 mL of 0.85% (wt/vol) NaCl. A mixture of two staining dyes SYTO9 and propidium iodide 175
(1:1) was added to the bacterial suspension and incubated for 15 min. Next, small drops of 3 μL were applied onto microscope slides, 176
which were previously covered with a thin agarose layer (1.7%) and coverslips, and cells were imaged in a Leica DM6000B 177
microscope equipped with a phase contrast Uplan F1 100× objective and a CCD Ixon camera (Andor Technologies). Images were 178
acquired and analysed using the Metamorph software version 5.8 (Molecular Devices). SYTO9 and propidium iodide were excited 179
using a 488 nm Ar laser, and the emission was collected using a META detector operating from 495 nm to 575 nm for SYTO9 and 180
between 590 nm and 640 nm, for propidium iodide. Cells with permeable membranes appear red stained by propidium iodide and 181
SYTO9 will stain green the intact cells. 182
183
Cloning and expression of Escherichia coli acnB 184
12
The acnB gene (2598-bp) was PCR-amplified from the genomic DNA of E. coli K12 MG1655 using the primers pair 5’ - 185
GAGGAGAACCCATATGCTAGA-3’ (acnB_fw_NdEI) and 5’– GCCTTACCGGATCCAAACAGC-3’ (acnB_rev_BamHI). The 186
amplified gene was cloned into NdeI/BamHI-digested pET-24a(+) vector (Novagen, Merck Biosciences VWR International, Portugal) 187
and transformed into XL1-Blue ultracompetent cells. The integrity of acnB gene was confirmed by sequencing (STAB VIDA). 188
Overexpression of the recombinant protein was achieved in cells of E. coli BL21Gold (DE3) grown in LB under aerobic conditions 189
and incubation at 37 °C and 150 rpm. When cells reached an OD600nm of 0.3, 1 mM of isopropyl β- D -1-thiogalactopyranoside (IPTG)
190
was added and induction proceeded for 3 h. To assess the direct effect of CORM-3 on the aconitase B acticity, extracts of cells 191
overexpressing acnB were incubated for 10 min with CORM-3 (120 μM) before measuring AcnB activity, as described above. 192
193
Detection of CO inside E. coli cells by fluorescence microscopy 194
Bacterial cells were grown aerobically in M9b medium, as described above, to an OD600 of 0.3. At this time, cells were left
195
untreated or exposed during 15 min to 120 μM CORM-3 or iCORM-3. The fluorescent carbon monoxide binding probe COP-1 (1 196
μM) was added to the medium, and after 15 min of incubation cells were harvested, centrifuged (10 min, 2400 x g), washed with PBS 197
(1x) (10 min, 2400 x g) and resuspended in a volume of PBS to a final OD600 of ~5. Cells suspensions (3 μl) were loaded on the
198
surface of a polymerized thin agarose layer (1.7%) extended over microscopy slides and covered with lamellas. The fluorescence 199
microscopic images were acquired as described before (14). In brief, a Leica DM6000B microscope equipped with a phase contrast 200
Uplan F1 10× objective (100× to bacteria) and a CCD Ixon camera (Andor Technologies) was used and images were acquired and 201
13
analysed using the Metamorph software suite version 5.8 (Universal Imaging). The excitation of the COP-1 probe was done with a 202
488 nm Ar laser, and the emission was collected using a META detector between 500 and 650 nm. 203
204
Statistical analysis 205
Statistics was performed using GraphPad Prism (GraphPad software version 5.01, San Diego, CA, United States). Results were 206
compared using two tailed unpaired Student’s t-tests with a confidence interval of 95%. The heatmap with metabolite abundances was 207
obtained using GraphPad Prism (GraphPad software version 7.05, San Diego, CA, United States). 208
209
RESULTS 210
Escherichia coli was used as model for Gram-negative pathogens to study the effects of the water-soluble CORM-3. In this 211
metabolomics study, we have analysed aerobically/anaerobically grown cells of E. coli treated with CORM-3 using 1H-NMR and 212
mass spectrometry, and tested their membrane permeability and enzyme´s activities. It should be noted that our studies were 213
performed with a growth inhibitory but non-lethal concentration of CORM-3 (120 µM) with the objective of maintaining E. coli cells 214
metabolically active and with the capacity to recover from the stress so that their metabolism and permeability could be analysed. In 215
contrast, the effect of several metabolites, added at different concentrations, on the growth of E. coli was tested in cells treated with a 216
complete growth inhibitory concentration of CORM-3, allowing for clear visualization and determination of the metabolites that were 217
able to rescue the lethal effect of CORM-3. 218
14 219
Extracellular metabolic end-products of E. coli cells treated with CORM-3 220
1
H-NMR was used to identify the E. coli metabolic end-products excreted by CORM-3 treated cells grown under aerobic and 221
anaerobic (fermentative) conditions and consuming glucose, which is one of the main glycolytic carbon sources available to bacteria 222
in the host. The metabolites were quantified at two cellular growth stages, namely, at 1 h and 3 h after CORM-3 (120 μM) addition. 223
For comparison purposes, cells grown similarly but in the absence of CORM-3 were also analysed. In this way, the impact of CORMs 224
on the bacterial metabolism during adaptation and recovery phases was assessed. 225
E. coli cells grown under aerobic conditions and not exposed to CORM-3 consumed high amounts of glucose and the major end-226
product excreted was acetate (Fig. 1A). When treated with CORM-3, cells uptake glucose from the extracellular medium as well as 227
small amounts of citrate (the first intermediary of the TCA cycle). After 1 h of CORM-3 exposure, a small but significant increase of 228
the excreted acetate was observed when compared to that of untreated cells (Fig. 1A). However, the major metabolic differences were 229
observed 3 h after the addition of the CORM-3. At this stage, E. coli cells exhibited a significantly higher consumption of glucose 230
(over 40%), a 2.5-fold increase of the succinate accumulated extracellularly and extracellular accumulation of glutamate that, in 231
general, is not an excreted end-product of carbon metabolism (Fig. 1A, Fig. S1). The extracellular accumulation of glutamate reached 232
its maximum concentration after 3 h of CORM-3 stress, after which no alterations in its level was observed (Fig. S2A). Moreover, the 233
extracellular glutamate levels accumulated in E. coli supernatants increased with the CORM-3 concentration (Fig. S2B). 234
15
E. coli cells grown anaerobically (fermentative conditions) and unexposed to stress exhibited high consumption of both glucose 235
and citrate and a mixed-acid fermentation pattern with acetate, succinate, ethanol and formate being excreted as the major end-236
products (Fig. 1B). When cells were treated with CORM-3 for 1 h and 3 h, the amounts of all excreted metabolites, excepting 237
succinate, increased significantly as compared to those excreted by untreated cells. In contrast to aerobically grown E. coli, 238
anaerobically cultured cells did not extrude glutamate after prolonged exposure to CORM-3, i.e., 3 h after the addition of the 239
compound (Fig. 1B). 240
241
Intracellular metabolites in E. coli cells treated with CORM-3 242
The 1H-NMR analysis of the extracellular metabolic end-products was particularly informative on the cellular metabolic 243
alterations that occurred at prolonged time of exposure to CORM-3. To get insights into the impact of CORM-3 at the early growth 244
stage, the intracellular metabolites accumulated in cells treated with CORM-3 for 1 h was also quantified by mass spectrometry (Fig. 245
2). Since 1H-NMR data indicated that the main metabolic alterations occurred at the level of glycolysis (Embden-Meyerhof-Parnas 246
pathway), TCA cycle and nitrogen metabolism we chose to quantify the intermediates of these processes, as well as, the compounds 247
related to the energy and redox status of cells. 248
For E. coli grown aerobically and exposed to CORM-3, the mass spectrometry results showed that, when compared to untreated 249
cells, it accumulated higher amounts of glycolysis-related intracellular metabolites, such as glucose 6-phosphate, fructose 1,6-250
16
bisphosphate, glyceraldehyde 3-phosphate/dihydroxyacetone phosphate, phosphoenolpyruvate and pyruvate (Fig. 2A). In particular, 251
the amounts of glucose 6-phosphate, phosphoenolpyruvate and pyruvate were significantly increased (Fig. 2B). 252
E. coli growing aerobically on glucose uses the TCA cycle enzymes in the non-reductive direction (17). We observed that on what 253
concerned the intermediates of the first half of the TCA cycle, cells treated with CORM-3 accumulated significantly higher amounts 254
of precursors of α-ketoglutarate, namely (iso)citrate and aconitase (Fig. 2). However, although the fluxes from α-ketoglutarate to 255
glutamate are usually high (17), we did not observe an increased accumulation of glutamate, which is synthesized from α-256
ketoglutarate or glutamine (Fig. 2B). The mass spectrometry results also showed that amino acids that can generate glutamate, such as 257
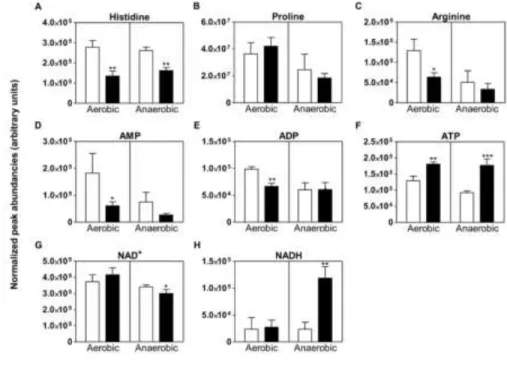
histidine and arginine, were significantly less accumulated in stressed cells (Fig. 2A and Fig. 3A-C). For the products of the second 258
half of the TCA cycle, cells exposed to CORM-3 under aerobic conditions had no altered intracellular levels of succinate and malate, 259
and contained approximately two times more fumarate (Fig. 2). 260
On the energy status of cells, exposure of E. coli to CORM-3 led to a decrease of the intracellular content of ADP and AMP, and 261
higher accumulation of ATP (Fig. 3D-F). This observation is consistent with the increased accumulation of intracellular 262
phosphoenolpyruvate and pyruvate (Fig. 2B), and of extracellular acetate (Fig. 1A). Indeed, the conversion of phosphoenolpyruvate 263
into pyruvate, the last step of glycolysis, and the acetate formed from pyruvate by the action of acetate kinase on acetyl-coA both lead 264
to production of ATP (Fig. 2B). Furthermore, CORM-3 did not alter the redox balance shortly after the stress as the [NAD+]/[NADH] 265
ratio was similar to that in unstressed cells (Fig. 2 and Fig. 3G-H). 266
17
Under anaerobic conditions, E. coli growing on glucose uses two independent fluxes that diverge from oxaloacetate of the TCA 268
cycle (17): i) a flux that occurs reversely, i.e., from oxaloacetate to malate, fumarate and to succinate, which is extruded, and ii) a 269
second flux, which has a rate that is approximately half of the first, that goes from oxaloacetate to citrate, isocitrate, α-ketoglutarate, 270
and finally to glutamate. 271
Anaerobically grown cells of E. coli treated with CORM-3 had increased contents of intracellular glycolytic intermediates, such as 272
glucose 6-phosphate, fructose 1,6-bisphosphate, glyceraldehyde 3-phosphate/dihydroxyacetone phosphate, phosphoenolpyruvate and 273
pyruvate (Fig. 2), which indicates that CORM-3 induces glycolysis. The same cells contained higher amounts of oxaloacetate, but not 274
of other TCA cycle intermediates (Fig. 2B). Moreover, a significantly lower amount of malic acid was present (Fig. 2B), suggesting a 275
metabolic constraint or redirection upstream or downstream of malate production (Fig. 2B). Additionally, and despite the fact that 276
CORM-3 exposed cells contained more oxaloacetate, the intermediates of the non-reverse half of the TCA cycle, such as (iso)citrate, 277
aconitase and α-ketoglutarate, and of the central nitrogen assimilation pathways, namely glutamate and glutamine, did not accumulate 278
more, which indicates a metabolic constraint in the first half of the TCA cycle. Also, the histidine content was significantly lower but 279
not that of glutamate, glutamine, arginine and proline (Fig. 2 and Fig. 3A-C). 280
Concerning the energy cofactors, anaerobically grown cells of E. coli exposed to CORM-3 exhibited lower accumulation of AMP 281
and similar amounts of ADP when compared to untreated cells (Fig. 3D-F). Moreover, cells contained significantly higher amounts of 282
ATP, which is in line with the higher rate of glycolysis and acetate production. 283
18
In what regards the redox cofactors, CORM-3 treated cells had higher and lower levels of NADH and NAD+, respectively, (Fig. 284
3G-H), i.e., a lower [NAD+/ NADH] ratio. This redox imbalance is consistent with the increased content of ethanol observed for 285
CORM-3 treated cells (Fig. 1B), as ethanol production is accompanied by regeneration of NAD+ via the bifunctional acetaldehyde 286
CoA/alcohol dehydrogenase that acts on acetyl-CoA derived from pyruvate, which is the final product of glycolysis (Fig. 2B). 287
288
CORM-3 inhibits nitrogen assimilation 289
Our observation that aerobically grown E. coli cells after prolonged exposure to CORM (3 h) extruded glutamate to the 290
extracellular compartment led us to investigate whether glutamate could act as an osmoregulator during bacterial stress response 291
and/or cause alterations of the cell permeability, similarly to what was reported in stress responses of other bacteria (18, 19). For this 292
purpose, we tested whether the addition of other osmoregulatory solutes, such as K+ and Na+, would modify the susceptibility of E. 293
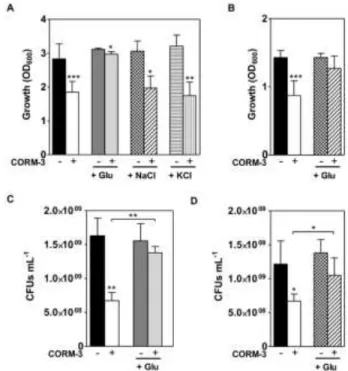
coli to CORM-3. The results of Fig. 4A show that while addition of glutamate fully rescued the impairment caused by CORM-3 on 294
cellular growth, the presence of sodium chloride or potassium chloride did not. Interestingly, addition of glutamate also allowed 295
recovery of the damage caused by CORM-3 in anaerobically grown cells (Fig. 4B). 296
In the following experiments, the cell permeability of CORM-treated cells of E. coli grown aerobically was analysed by 297
fluorescence microscopy. In Figure S3, using the Live/Dead BacLight viability system, cells with a compromised membrane and dead 298
cells exhibited red colour due to staining by propidium iodide, and those with intact membranes are stained green by SYTO 9 (20). 299
The results showed that cells treated with CORM-3, in the same concentration used in the experiments described above (120 µM), did 300
19
not induce an increase in cell membrane permeability either after 1 h or 3 h of exposure. Therefore, we concluded that the extrusion of 301
glutamate did not result from alterations in cell permeability. However, it is worthy of note that when higher concentrations of 302
CORM-3 (200 µM) were tested modifications did occur, and approximately half of the population of aerobically grown E. coli cells 303
exhibited more permeable membranes, a number that increased with time (Fig. S3). Studies performed by us and others reported that 304
high CORM concentrations inhibit the respiratory chain and stimulate the production of ROS, which is consistent with modifications 305
induced by CORMs on membrane potential, ion transport and membrane permeability of the bacterial cells (8–10, 21). Thus, the 306
extracellular accumulation of glutamate in cells following prolonged treatment with low concentration of CORM-3 was not due to 307
generation of hypo osmotic stress or increased cell permeability. Most probably, it resulted from an excessive production of this 308
metabolite in order to compensate the depletion that occurs at the initial times of exposure, a hypothesis that is further examined 309
below. The de novo synthesis of glutamate occurs mainly from α-ketoglutarate by the action of glutamate dehydrogenase and 310
glutamate synthase, but it may be also produced from other amino acids, such as histidine, proline, and arginine. Therefore, we tested 311
whether external addition of these central nitrogen intermediates and glutamate precursors would protect E. coli from a lethal 312
concentration of CORM-3 (200 μM). Supplementation of the medium with glutamate and histidine in CORM-3–treated cells 313
abolished the effect of the drug, while arginine and glutamine did not, a behaviour that was observed independently of the oxygen 314
growth conditions (Fig. 5). An exception was proline, the addition of which only cancelled the toxic effect of CORM-3 in cells 315
cultured aerobically (Fig. 5D). 316
20
Glutamate is also used for the synthesis of reduced glutathione (GSH), which has been described to rescue the growth of CORM-317
3 stressed cells (9, 22). To analyse whether depletion of glutamate might also be related with a high requirement for glutathione by 318
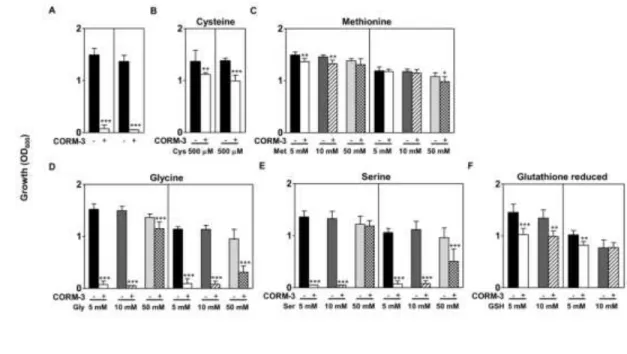
CORM-3 stressed cells, we tested the effect of supplementing the medium with other glutathione precursors (Fig. 6), such as cysteine, 319
glycine and glutamate. Note that cysteine per se may be produced from homocysteine, which is a product of the methionine 320
metabolism, and from serine. Therefore, we analysed the effect of adding all these amino acids to E. coli cells exposed to a lethal 321
concentration of CORM-3. Addition of cysteine (500 µM) rescued to a large extent the toxicity caused by CORM-3 on E. coli, which 322
occurred independently of the oxygen growth conditions (Fig. 6A-B). It was also interesting to observe that when anaerobically 323
growing cells were supplemented with cysteine at concentrations (5-10 mM) that are toxic to untreated cells, CORM-3 no longer 324
caused bacterial death (data not shown). In all cases, addition of glutathione and methionine also abolished almost completely the 325
antimicrobial action of CORM-3 on E. coli (Fig. 6C-F). Although glycine and serine had a limited impact under anaerobic conditions, 326
their action on cancelling CORM-3 toxicity was effective in oxygen-respiring cells (Fig. 6D- E). 327
Taken together, the results showed that CORM-3 initially causes intracellular depletion of glutamate, which is offset by an 328
increase in glutamate production, with the consequence that at the later stages of growth the accumulated glutamate is extruded into 329
the extracellular medium (Fig. 1A). 330
331 332 333
21 CORM-3 inhibits the TCA cycle
334
Besides the effect of CORM-3 on glutamate metabolism, the data above reported also suggested that CORM-3 restrains the E. 335
coli TCA cycle. In particular, mass spectrometry data showed that CORM-3 modifies the abundance of TCA intermediates (Fig. 2). 336
Therefore, we reasoned that addition of TCA cycle intermediates, such as citrate, isocitrate, α-ketoglutarate, succinate, fumarate and 337
malate, to the growth medium would alleviate the toxic effect of CORM-3. Therefore, experiments were carried out using media 338
supplemented, separately, with each of these metabolites, for cells cultured under aerobic and anaerobic conditions and exposed to 339
CORM-3. We observed that the presence of citrate, isocitrate, succinate, and malate in the medium had no impact on the growth rate 340
(Fig. 7A-C, E and G). In contrast, CORM-3-treated E. coli cells grown in the presence of α-ketoglutarate or fumarate partially 341
recovered their growth to levels that resemble those of untreated cells, and in a degree that was dependent on the concentration of the 342
metabolite (Fig. 7A, D and F). Then we sought to determine if glycolysis was the limiting factor for the production of intermediates in 343
the TCA cycle. We proved that this was not the case as supplementation of the cellular medium with phosphoenolpyruvate or pyruvate 344
did not cancel the CORM-3 effect (Fig. 7A, H and I). 345
The fact that intermediates, such as α-ketoglutarate, fumarate and glutamate, relieved the toxicity of CORM-3 led us to evaluate 346
the cellular activities of three TCA cycle enzymes, namely aconitase B, isocitrate dehydrogenase and fumarase, and of glutamate 347
synthase (GOGAT) (Fig. 2). We have previously shown that under aerobic conditions, CORM-2 inhibits the cellular aconitase B and 348
glutamate synthase activities (9). However, under such conditions reactive oxygen species also contribute to the inactivation of these 349
enzymes. Therefore, in this work we determined these activities in anaerobically grown cells. We observed that CORM-3 decreased 350
22
the glutamate synthase, aconitase B and fumarase activities of E. coli cells by approximately 40%, 50%, and 60 % (Fig. 8). 351
Interestingly, the activity of isocitrate dehydrogenase, which is the only enzyme that does not contain an iron-sulfur centre, was not 352
inhibited by the drug (Fig. 8). 353
Next, it was analysed whether CORM-3 directly inhibited the activity of iron-sulfur enzymes by testing aconitase. For this 354
purpose, we overexpressed the acnB gene in E. coli and measured the AcnB activity in cell extracts incubated with CORM-3. The cell 355
extract overexpressing AcnB and incubated with CORM-3 presented a 50% decrease in the activity of this enzyme relatively to 356
unstressed cells (Fig. 8), suggesting that CORM-3 affects this protein at a post-translational level. Interestingly, the aconitase and 357
glutamate synthase activities were not altered in E. coli cells stressed with the following ruthenium(II) compounds: iCORM-3, 358
inactivated by buffering a solution of CORM-3 for 18 h and flushing it with nitrogen to remove liberated CO; and RuCl2(DMSO)4 that
359
does not contain CO (Fig. 8). In accordance, the extracellular metabolic end-products profile of E. coli exposed to iCORM-3 and 360
RuCl2(DMSO)4 was similar to that of unstressed cells (Fig. S4). Moreover, fluorescence microscopy of cells incubated with the COP-1
361
probe showed that while CO was detected in CORM-3 treated cells, no fluorescence was observed when cells were exposed to 362
iCORM-3 (Fig. S5). Additionally, the flushing E. coli cells with CO also caused a significant decrease of the aconitase activity when 363
comparing with that of cells flushed with N2. As expected, due to the low solubility of CO the decrease of the aconitase activity was
364
smaller than that caused by CORM-3 (Fig. 8 and Fig. S6). These observations clearly show that the inhibitory effect on the activities 365
of E. coli iron-sulfur enzymes is linked to the capacity of CORM-3 to release carbon monoxide. 366
23
Altogether, our results reveal that exposure of E. coli to CORM-3 perturbs the TCA cycle metabolism due to inhibition of their 367
main enzymes, and modifies the content of the intracellular intermediate metabolites. 368
369
DISCUSSION 370
Despite their antimicrobial potential against bacteria and parasites, the mechanisms of action of CORMs remain incompletely 371
understood. In this work, we resorted to metabolomics to uncover how the prototype CORM-3 acts on the central metabolism of the 372
model facultative anaerobe E. coli. The results are discussed taking into consideration the use of a sublethal concentration of CORM-373
3, so that interference on the metabolism (and not full impairment) was imposed. Furthermore, by analysing cells at the onset and after 374
prolonged exposure to CORM-3, we assessed not only the effects but also the response of the cells to the drug. 375
We observed that for E. coli growing aerobically inhibition caused by CORM-3 was cancelled upon supplementation of the 376
medium with glutamate. Furthermore, and despite the fluxes through the oxidative branch of the TCA cycle, which provide α-377
ketoglutarate for the synthesis of glutamate, being generally lower in anaerobically grown cells (17, 23), a similar effect was observed 378
under anaerobic conditions (Fig. 4). However, extracellular glutamate accumulation was observed in aerobically grown cells 379
prolonged treated with CORM-3. Although correlation between glutamate accumulation and increased bacterial cell permeability or 380
hypo osmotic stress have been proposed (18, 24), this was not the case here as no significant alterations of these factors were 381
observed. Instead, we found that shortly after CORM-3 treatment there is an inhibition of the activity of glutamate synthase GOGAT, 382
an iron-sulfur containing enzyme that forms glutamate at the expenses of the TCA cycle intermediates, such as α-ketoglutarate 383
24
(supplied in the oxidative branch of the TCA cycle), glutamine and NADPH (Fig. 8, (25)). Further confirmation that CORM-3 inhibits 384
GOGAT and the TCA cycle arises from the capacity of exogenously added histidine, whose intracellular degradation leads to the 385
formation of glutamate (26), to cancel the inhibitory action of CORM-3 (Fig. 5). Corroborating this observation is the complete 386
consumption of the histidine (2.6 mM) from the extracellular medium by CORM-3 stressed cells in relation to unstressed cells, which 387
only consumed a slight amount (data not shown). Proline, whose degradation also forms glutamate, only provided protection to 388
CORM-3 stressed cells that were grown aerobically (Fig. 5). This can be explained by the fact that the degradation of proline 389
consumes oxygen (27). In contrast, arginine, whose degradation is generally activated by nitrogen limitation or low ammonium (low 390
glutamine) (28), and glutamine were not able to restore the growth of CORM-3 stressed cells (Fig. 5), indicating that the protection 391
against CORM-3 is specific for glutamate and not for its derivative glutamine. 392
The boost of glutamate synthesis is most probably linked to the need to restore the levels of glutathione (GSH). One important 393
way of controlling the biosynthesis of GSH is through the availability of the amino acids precursors (29). The need to restore GSH 394
levels can also be inferred by the protection conferred by the glutathione amino acids precursors, namely methionine, cysteine, serine 395
and glycine, and glutathione itself to CORM-3 treated cells (Fig. 6). Other authors reported that only cysteine and reduced glutathione 396
could fully protect cells from CORM-3 (30). However, when we used higher concentrations of amino acids ,in the range of those 397
determined intracellularly (31), we observed protection, which indicates that CORM-3 causes amino acids deficiency. Also, addition 398
of several non-sulfur amino acids and non-thiol compounds (e.g. proline, histidine, and TCA cycle intermediates) protect E. coli 399
25
against CORM-3. Hence, it is plausible to consider that the need for the glutathione precursor glutamate is a direct consequence of the 400
inhibition of the TCA cycle by CORM-3 (Fig. 2). 401
GSH protection in E. coli cells grown aerobically has been associated with the maintenance of the proper oxidation state of 402
protein thiols (29). In light of our results, an answer to the question as to why glutathione is important during CORM-3 stress in 403
anaerobically grown cells where no reactive oxygen species are formed is not so straightforward. Yet, GSH has also been implicated 404
in several other processes, such as protection from low pH and to promote reactivation of damaged iron-sulfur centre of FNR 405
regulator, which binds to DNA and controls the expression of a large number of genes responsible for growth under 406
anaerobic/fermentative conditions (29). 407
Altogether, our data show that CORM-3 interferes with the nitrogen assimilation pathway, and we propose that this inhibition is 408
then followed by an exacerbated production to restore the normal glutamate´s levels when the stress is dissipating that, ultimately, 409
leads to excessive accumulation and consequent extrusion of this metabolite after long exposure to the drug. 410
CORM-3 triggers on E. coli a glycolysis/fermentation pattern, which occurs independently of oxygen growth conditions and time 411
of exposure. Indeed, it caused higher glucose consumption, increased accumulation of several intracellular glycolytic intermediates 412
and extracellular end-products derived from the reduction of pyruvate (the last product of glycolysis), and the failure of exogenously 413
added phosphoenolpyruvate and pyruvate to overcome the inhibitory action of CORM-3 (Figs. 1, 2 and 7). 414
Moreover, CORM-3 significantly decreases the activity not only of GOGAT, but also of other iron-sulfur enzymes such as aconitase 415
B and fumarase (Fig. 8). In vivo, this inhibition modifies the intracellular accumulation of TCA cycle intermediates (e.g., oxaloacetate, 416
26
malate, fumarate and (iso)citrate) (Fig. 2). Impairment of the cycle is also shown by the capacity of exogenously added TCA cycle 417
intermediates, namely fumarate and α-ketoglutarate, in cancelling the toxicity of CORM-3 (Fig. 7). 418
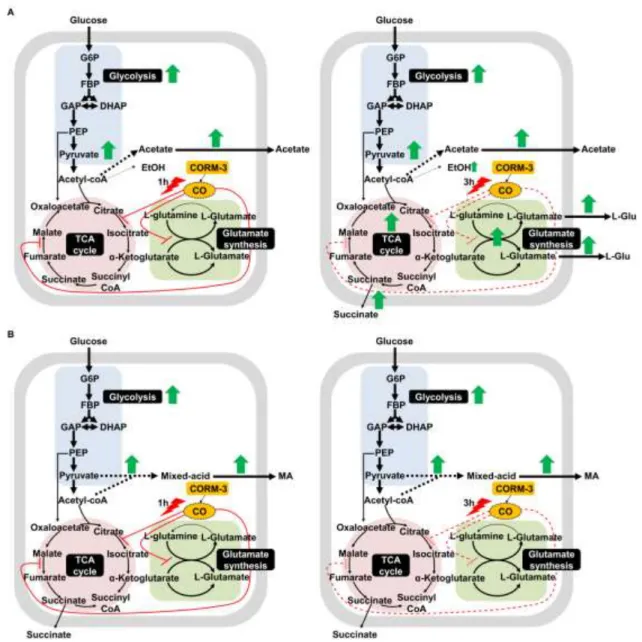
Under aerobic conditions, E. coli cells operate with a full oxidative TCA cycle (17). Therefore, to overcome the stress, cells 419
exposed to CORM-3 for 1 h, had the metabolic flux slightly increased to produce acetate and ATP, through the activities of 420
phosphotransacetylase (PTA) and acetate kinase (AK) (Fig. 2). These results are consistent with observed increased excretion of 421
acetate by E. coli cells as a consequence of the need to regenerate NAD+ consumed during glycolysis and to recycle the coenzyme A 422
required to convert pyruvate into acetyl-coA in cells with a TCA cycle that is not fully operating (32). 423
Under anaerobic conditions, E. coli cells operate with a branched TCA cycle: the reductive half of the TCA cycle produces succinate 424
as by-product and regenerates NAD+ and FAD, and the oxidative half synthesizes α-ketoglutarate, a precursor for the biosynthesis of 425
many metabolites, including glutamate (Fig. 2, (17)). Hence, to survive, the cells exposed to CORM-3 for 1 h, increased the flux of 426
glucose into mixed-acid products (acetate, formate, ethanol), which was accompanied by ATP production and NAD+ regeneration. 427
This response represents an advantage to compensate the inhibition of enzymes of the bifurcated TCA cycle (Figs. 1, 2, 8). These 428
results obtained for cells treated under anaerobic conditions, show that the toxicity of CORM-3 goes well beyond the generation of 429
ROS. 430
CORMs carry three types of components with potential biological activity: carbon monoxide CO, the transition metal (which for 431
CORM-3 is Ru(II)), and the molecular scaffold of the complex or its decomposition products. Our data supports that the antimicrobial 432
effects are related to the CO delivered, which is based on the following results. Fresh solutions of CORM-3 inhibit the iron-sulfur 433
27
enzymes of the TCA cycle whereas iCORM-3 solutions do not (Fig. 8). This observation mirrors those reported in a very large 434
number of studies, where CORM-3 but not iCORM-3 solutions recapitulate the therapeutic and cytoprotective effects of CO gas in 435
animals, animal tissues and cells in vivo, ex vivo and in vitro, reviewed in (33). 436
Both CORM-3 and iCORM-3 contain [Ru(CO)x]2+ fragments bound to trivial ligands like H2O, glycinate, Cl −
, and buffer anions. 437
However, the [Ru(CO)3]2+ fragment in CORM-3 has a very complex chemistry in H2O decaying to iCORM-3 as the final product or
438
mixture of products. iCORM-3 still contains [Ru(CO)2]2+ fragments which, experiment show, are unable to promote the therapeutic
439
biological effects seen with CORM-3 (34). Solutions of cis-RuCl2(DMSO)4, another common control for Ru-CORMs activity, also
440
failed to inhibit the iron-sulfur enzymes of the TCA cycle. This control compound doesn’t contain CO but may generate Ru(II) species 441
which might be toxic and inhibit such enzymes. However, like iCORM-3, cis-RuCl2(DMSO)4 is inactive to such enzymes (Fig. 8).
442
One might argue that the cis-RuCl2(DMSO)4 scaffold is too stable preventing interactions of Ru(II) with cell components. On the
443
contrary, upon dissolution in water cis-RuCl2(DMSO)4 rapidly loses its O-bound DMSO ligand and more slowly a Cl− ligand creating
444
easily available Ru(II) coordination sites for biomolecules (35). Accordingly, cis-RuCl2(DMSO)4 interacts with DNA and has
anti-445
tumoral activity. In contrast, and in agreement with our observations, it is not toxic to E. coli cells (36). Interestingly, the isomeric 446
trans-RuCl2(DMSO)4 which is much more reactive, rapidly exchanging two DMSO ligands with water, followed by a slower aquation
447
of Cl− (35), is 20-fold more toxic to animal cells than the cis-isomer and yet remains non-toxic to E. coli (36). This suggests that Ru(II) 448
species, at the concentrations used, are not toxic to E. coli cells and don’t inhibit the iron-sulfur enzymes in general. The fact that CO 449
28
is the active inhibitor of these enzymes is also consistent with the recently reported binding of CO to iron-sulfphur clusters in different 450
redox states (37, 38). 451
Therefore, we may conclude that the therapeutic effect of CORM-3 is not due to its trivial ligands or to Ru(II) ions, and that the 452
cytoprotective effects of CORM-3 derive from CO delivered from CORM-3 and not from iCORM-3. Thus, if CORM-3 can deliver 453
CO inside animal cells, albeit by an unknown mechanism, it is highly plausible it does the same in bacterial cells. Indeed, use of the 454
turn-on fluorescent probe COP-1 detected significant amounts of CO intracellularly either in animal cells or in E. coli exposed to 455
CORM-3 (14, 39). Also, high concentrations of Ru were detected in bacterial cells treated with CORM-3 (30). 456
457
In summary, the work provides several evidences that CORM-3 inhibits the glutamate synthesis and iron-sulfur enzymes of the 458
TCA cycle, and that the glycolysis pathway is triggered in order to establish an energy and redox homeostasis balance (Fig. 9). 459
Moreover, our results show that CO is indeed toxic to E. coli cells being responsible for the metabolic alterations caused by CORM-3 460
under conditions where CO depleted Ru(II) species are also inactive. 461
462
ACKNOWLEDGEMENTS 463
The NMR data was acquired at CERMAX, ITQB-NOVA, Oeiras, Portugal with equipment funded by FCT, project AAC 464
01/SAICT/2016. This work was financially supported by Project LISBOA-01-0145- FEDER-007660 (Microbiologia Molecular, 465
Estrutural e Celular) funded by FEDER funds through COMPETE2020 – Programa Operacional Competitividade e 466
29
Internacionalização (POCI) and national funds through Fundação para a Ciência e a Tecnologia PTDC/SAU-INF/29313/2017 project. 467
This work has also received funding from the European Union's Horizon 2020 research and innovation program under grant 468 agreement number 810856. 469 470 REFERENCES 471
1. Nobre LS, Seixas JD, Romão CC, Saraiva LM. 2007. Antimicrobial action of carbon monoxide-releasing compounds. 472
Antimicrob Agents Chemother 51:4303–4307. 473
2. Bang CS, Kruse R, Demirel I, Önnberg A, Söderquist B, Persson K. 2014. Multiresistant uropathogenic extended-spectrum ß-474
lactamase (ESBL)-producing Escherichia coli are susceptible to the carbon monoxide releasing molecule-2 (CORM-2). Microb 475
Pathog 66:29–35. 476
3. Tavares AF, Parente MR, Justino MC, Oleastro M, Nobre LS, Saraiva LM. 2013. The bactericidal activity of carbon monoxide-477
releasing molecules against Helicobacter pylori. PLoS One 8(12): e83157. 10.1371/journal.pone.0083157. 478
4. Ward JS, Morgan R, Lynam JM, Fairlamb IJS, Moir JWB. 2017. Toxicity of tryptophan manganese (I) carbonyl (Trypto-479
CORM), against Neisseria gonorrhoeae. Med Chem Commun 8:346–352. 480
5. Simpson P V, Nagel C, Bruhn H, Schatzschneider U. 2015. Antibacterial and antiparasitic activity of manganese(I) tricarbonyl 481
complexes with ketoconazole, miconazole, and clotrimazole ligands. Organometallics 34:3809-3815. 482
6. Pena AC, Penacho N, Mancio-Silva L, Neres R, Seixas JD, Fernandes AC, Romão CC, Mota MM, Bernardes GJL, Pamplona 483
30
A. 2012. A novel carbon monoxide-releasing molecule fully protects mice from severe malaria. Antimicrob Agents Chemother 484
56:1281–1290. 485
7. Long R, Salouage I, Berdeaux A, Motterlini R, Morin D. 2014. CORM-3, a water soluble CO-releasing molecule, uncouples 486
mitochondrial respiration via interaction with the phosphate carrier. Biochim Biophys Acta - Bioenerg 1837:201–209. 487
8. Davidge KS, Sanguinetti G, Yee CH, Cox AG, McLeod CW, Monk CE, Mann BE, Motterlini R, Poole RK. 2009. Carbon 488
monoxide-releasing antibacterial molecules target respiration and global transcriptional regulators. J Biol Chem 284:4516– 489
4524. 490
9. Tavares AFN, Teixeira M, Romão CC, Seixas JD, Nobre LS, Saraiva LM. 2011. Reactive oxygen species mediate bactericidal 491
killing elicited by carbon monoxide-releasing molecules. J Biol Chem 286:26708–26717. 492
10. Wilson JL, Wareham LK, McLean S, Begg R, Greaves S, Mann BE, Sanguinetti G, Poole RK. 2015. CO-releasing molecules 493
have nonheme targets in bacteria: transcriptomic, mathematical modeling and biochemical analyses of CORM-3 [Ru(CO) 3 494
Cl(glycinate)] actions on a heme-deficient mutant of Escherichia coli. Antioxidants {&} Redox Signal 25:148–162. 495
11. Nobre LS, Al-Shahrour F, Dopazo J, Saraiva LM. 2009. Exploring the antimicrobial action of a carbon monoxide-releasing 496
compound through whole-genome transcription profiling of Escherichia coli. Microbiology 155:813–824. 497
12. Bang CS, Demirel I, Kruse R, Persson K. 2017. Global gene expression profiling and antibiotic susceptibility after repeated 498
exposure to the carbon monoxide-releasing molecule-2 (CORM-2) in multidrug-resistant ESBL-producing uropathogenic 499
Escherichia coli. PLoS One 12(6): e0178541. . 10.1371/journal.pone.0178541. 500
31
13. Wareham LK, Begg R, Jesse HE, Van Beilen JWA, Ali S, Svistunenko D, McLean S, Hellingwerf KJ, Sanguinetti G, Poole 501
RK. 2016. Carbon Monoxide gas is not inert, but global, in its consequences for bacterial gene expression, iron acquisition, and 502
antibiotic resistance. Antioxidants {&} Redox Signal 24:1013–1028. 503
14. Nobre LS, Jeremias H, Romão CC, Saraiva LM. 2016. Examining the antimicrobial activity and toxicity to animal cells of 504
different types of CO-releasing molecules. Dalt Trans 45:1455–1466. 505
15. Carvalho SM, de Jong A, Kloosterman TG, Kuipers OP, Saraiva LM. 2017. The Staphylococcus aureus α-acetolactate synthase 506
ALS confers resistance to nitrosative stress. Front Microbiol 8:12731. 10.3389/fmicb.2017.01273. 507
16. Silva LSO, Baptista JM, Batley C, Andrews SC, Saraiva LM. 2018. The di-iron RIC protein (YtfE) of Escherichia coli interacts 508
with the DNA-binding protein from starved cells (Dps) to diminish RIC protein-mediated redox stress. J Bacteriol 200(24). 509
e.00527-18. 510
17. Gonzalez JE, Long CP, Antoniewicz MR. 2017. Comprehensive analysis of glucose and xylose metabolism in Escherichia coli 511
under aerobic and anaerobic conditions by 13C metabolic flux analysis. Metab Eng 39:9–18. 512
18. Wood JM. 2015. Bacterial responses to osmotic challenges. J Gen Physiol 145:381–388. 513
19. Csonka LN. 1989. Physiological and genetic responses of bacteria to osmotic stress. Microbiol Rev 53:121–147. 514
20. Boulos L, Prévost M, Barbeau B, Coallier J, Desjardins R. 1999. LIVE/DEAD(®) BacLight(TM): Application of a new rapid 515
staining method for direct enumeration of viable and total bacteria in drinking water. J Microbiol Methods 37:77–86. 516
21. Tavares AFN, Nobre LS, Saraiva LM. 2012. A role for reactive oxygen species in the antibacterial properties of carbon 517
32 monoxide-releasing molecules. FEMS Microbiol Lett 336:1–10. 518
22. McLean S, Begg R, Jesse HE, Mann BE, Sanguinetti G, Poole RK. 2013. Analysis of the bacterial response to 519
Ru(CO)3Cl(Glycinate) (CORM-3) and the inactivated compound identifies the role played by the ruthenium compound and 520
reveals sulfur-containing species as a major target of CORM-3 action. Antioxid Redox Signal 19:1999–2012. 521
23. Choudhary MK, Yoon JM, Gonzalez R, Shanks J V. 2011. Re-examination of Metabolic Fluxes in Escherichia coli during 522
Anaerobic Fermentation of Glucose Using 13C Labeling Experiments and 2-dimensional Nuclear Magnetic Resonance (NMR) 523
Spectroscopy. Biotechnol Bioprocess Eng 16:419-437. 524
24. Wenzel M, Chiriac AI, Otto A, Zweytick D, May C, Schumacher C, Gust R, Albada HB, Penkova M, Krämer U, Erdmann R, 525
Metzler-Nolte N, Straus SK, Bremer E, Becher D, Brötz-Oesterhelt H, Sahl H-G, Bandow JE. 2014. Small cationic 526
antimicrobial peptides delocalize peripheral membrane proteins. Proc Natl Acad Sci U S A 111:E1409-18. 527
25. Yan D. 2007. Protection of the glutamate pool concentration in enteric bacteria. Proc Natl Acad Sci 104:9475-80. 528
26. Bender RA. 2012. Regulation of the Histidine Utilization (Hut) system in bacteria. Microbiol Mol Biol Rev 76:565-584. 529
27. Zhang L, Alfano JR, Becker DF. 2015. Proline metabolism increases katG expression and oxidative stress resistance in 530
Escherichia coli. J Bacteriol 197:431-440. 531
28. Schneider BL, Kiupakis AK, Reitzer LJ. 1998. Arginine catabolism and the arginine succinyltransferase pathway in 532
Escherichia coli. J Bacteriol 180:4278-4286. 533
29. Masip L, Veeravalli K, Georgiou G. 2006. The many faces of glutathione in bacteria. Antioxid Redox Signal 8:753-762. 534
33
30. Southam HM, Smith TW, Lyon RL, Liao C, Trevitt CR, Middlemiss LA, Cox FL, Chapman JA, El-Khamisy SF, Hippler M, 535
Williamson MP, Henderson PJF, Poole RK. 2018. A thiol-reactive Ru(II) ion, not CO release, underlies the potent 536
antimicrobial and cytotoxic properties of CO-releasing molecule-3. Redox Biol 18:114–123. 537
31. Bennett BD, Kimball EH, Gao M, Osterhout R, Van Dien SJ, Rabinowitz JD. 2009. Absolute metabolite concentrations and 538
implied enzyme active site occupancy in Escherichia coli. Nat Chem Biol 5:593–599. 539
32. Wolfe AJ. 2008. Quorum sensing “flips” the acetate switch. J Bacteriol 190:5735-5737. 540
33. Motterlini R, Otterbein LE. 2010. The therapeutic potential of carbon monoxide. Nat Rev Drug Discov 9:728-U24. 541
34. Santos-Silva T, Mukhopadhyay A, Seixas JD, Bernardes GJL, Romão CC, Romão MJ. 2011. CORM-3 reactivity toward 542
proteins: The crystal structure of a Ru(II) dicarbonyl-lysozyme complex. J Am Chem Soc 133:1192-1195. 543
35. Alessio E, Sava G, Zorzet S, Mestroni G, Attia WM, Calligaris M, Nardin G. 2005. Cis- and trans-dihalotetrakis(dimethyl 544
sulfoxide)ruthenium(II) complexes (RuX2(DMSO)4; X = Cl, Br): synthesis, structure, and antitumor activity. Inorg Chem 545
27:4099–4106. 546
36. Shukla SN, Gaur P, Kaur H, Srivastava RS. 2011. Synthesis, spectroscopic characterization and antibacterial activity of some 547
chloro dimethylsulphoxide/tetramethylenesulphoxide ruthenium (II)/(III) complexes with 1, 2, 3-benzotriazole. Acta Chim Slov 548
8:542-8. 549
37. Arnett CH, Chalkley MJ, Agapie T. 2018. A Thermodynamic Model for Redox-Dependent Binding of Carbon Monoxide at 550
Site-Differentiated, High Spin Iron Clusters. J Am Chem Soc 140:5569–5578. 551
34
38. Stripp S, Sanganas O, Happe T, Haumann M. 2009. The structure of the active site H-cluster of [FeFe] hydrogenase from the 552
green alga Chlamydomonas reinhardtii studied by X-ray absorption spectroscopy. Biochemistry 48:5042–5049. 553
39. Michel BW, Lippert AR, Chang CJ. 2012. A reaction-based fluorescent probe for selective imaging of carbon monoxide in 554
living cells using a palladium-mediated carbonylation. J Am Chem Soc 134:15668–15671. 555 556 557 558 559 560 561 562 563 564 565 566 567 568 569
35 570
571
572 573
Figure 1. Quantification of extracellular metabolites in E. coli cells exposed to CORM-3. Substrates consumed and major end-574
products accumulated in cells grown under aerobic (A) and anaerobic (B) conditions, in the absence of CORM-3 (control, Ctr) and 1 h 575
and 3 h after the addition of CORM-3 (120 μM). Colour code of graphs bars: black-glucose (Glc); dark citrate (Cit); grey-576
glutamate (Glu); white-acetate (Ac); horizontally striped-succinate (Succ); vertically striped-ethanol (EtOH); right transversally 577
striped-formate (For); squared-lactate (Lact); light grey-pyruvate (Pyr). The concentrations are normalized to the OD600nm value of the
36
cell culture at the time of collection. Error bars represent mean ± SEM (n = 4 biological replicates). Asterisks represent data 579
statistically significant relative to the control; ∗P < 0.05 and ∗∗P < 0.01 and ∗∗∗P < 0.0001. 580
581 582 583
37 584
38
Figure 2. Metabolite abundance in aerobically and anaerobically-grown E. coli exposed to 585
CORM-3. (A) Heatmap of metabolite abundances in cells treated with CORM-3, for 1 h at 120 586
μM, were centred by subtracting the total metabolite’s mean for each metabolite and scaled by 587
dividing the centred metabolite by its standard deviation. Average abundances are represented by 588
zero values and shown in white; abundances below average have negative values and are 589
depicted in blue, and abundances above average have positive values and are presented in red. 590
The red and blue colour gradient indicates increase accumulation and depletion of metabolites, 591
respectively. (B) Central metabolic pathways and relative abundance of intracellular metabolites 592
in CORM-3-treated cells. Graphs represent the relative abundance of intracellular metabolites 593
accumulated by E. coli grown aerobically (left side) and anaerobically (right side), untreated 594
(white bars) and treated with CORM-3 (black bars). The size (y-axis) of the graph bars represent 595
metabolite peak abundances determined by mass spectrometry and normalized to internal 596
standards and sample weight, and are only comparable for the same metabolite. Error bars are 597
mean values ± SD (n = 4 biological replicates). Asterisks represent statistically significant data 598
relative to untreated cells; ∗P < 0.05 and ∗∗P < 0.01 and ∗∗∗P < 0.0001. The main operative 599
pathways under aerobic and anaerobic conditions are depicted in orange and blue, respectively. 600
Abbreviations: G6P, glucose 6-phosphate (hexose 6-phosphate); FBP, fructose 1,6- bisphosphate 601
(hexose 1,6-bisphosphate); GAP, glyceraldehyde 3-phosphate; DHAP, dihydroxyacetone 602
phosphate; PEP, phosphoenolpyruvate. 603
604 605 606 607
39 608
609
610 611
Figure 3. Relative abundance of intracellular amino acids and energy and redox cofactors 612
in E. coli cells exposed to CORM-3. Graphs represent the relative abundance of 613
intracellular histidine (A), proline (B), arginine (C), AMP (D), ADP (E), ATP (F), NAD+ 614
(G) and NADH (H) accumulated in cells grown aerobically (left side of the graph) and 615
anaerobically (right side of the graph), left untreated (white bars), and treated for 1 h with 616
120 μM CORM-3 (black bars). The graph size bars represent metabolite peak abundances 617
obtained by mass spectrometry normalized to internal standards and sample weight, and are 618
only comparable for the same metabolite. Error bars are mean values ± SD (n = 4 biological 619
replicates). Asterisks represent statistically significant data relative to untreated cells; ∗P < 620
0.05, ∗∗P < 0.01 and ∗∗∗P < 0.0001. 621