A cooperative multicriteria group decision aiding tool –
A guide tour of the desktop application
Sérgio Fernandes1, 2, João Clímaco3, M. Eugénia Captivo4, 2
1 Escola Superior de Tecnologia — Instituto Politécnico de Setúbal,
Campus do IPS, 2910-761 Setúbal, Portugal
2 Centro de Matemática, Aplicações Fundamentais e Investigação Operacional, Faculdade
de Ciências, Universidade de Lisboa, 1749-016 Lisboa, Portugal
3 Instituto de Engenharia de Sistemas e Computadores de Coimbra,
Rua Sílvio Lima, Pólo II, 3030-290 - Coimbra, Portugal
4 Faculdade de Ciências — Universidade de Lisboa,
Campo Grande, 1749-016 Lisboa, Portugal
Abstract. The main features of the adaptation to a face-to-face cooperative
group approach of an interactive decision support tool previously developed with the aim of supporting decisions concerning multicriteria location problems are described. In the application implemented there is no inter-criterion aggregation, so there is no need to reduce the various evaluation dimensions into the same scale. It allows for the individual intervention of several elements of the group, includes some logical tools as well as the possibility of introducing constraints. Furthermore, it propitiates an extensive use of interactive graphics. A guided tour of the desktop application emphasizing its potentialities and limitations is presented.
Keywords: Cooperative group decision, Multicriteria analysis, Interactive decision support tool
1 Motivation
In the past, the authors of this communication developed an interactive decision support tool named SABILOC. It is aimed at supporting decisions concerning multicriteria location problems [1]. The tool combines an interactive bicriteria mathematical programming module with a multi-attribute analysis module allowing the decision makers to proceed with a more detailed analysis of a subset of solutions selected from the first interactive phase. The application of this DSS to problems involving environmental issues involves complex and multi-disciplinary tasks dealing with psychological, sociological, cognitive and political issues. In these circumstances, we designed a multi-attribute module adequate to combine ill-structured Human intervention with the computational decision support. The first version of the software is described in [2, 3] and it is based on an interactive implementation of the conjunctive method, enabling the consideration of up to three performance thresholds, having in mind to classify the objects under evaluation, and extensively using graphic tools in order to improve human-computer interaction. This
software is in essence very simple. There is no inter-criterion aggregation, so there is no need to reduce the various evaluation dimensions into the same scale, thereby avoiding all possible associated distortions, which are very common for instance when the aggregation is based on the use of weights. It is our conviction that aggregation procedures that reduce the multidimensional evaluation of objects to a scalar, although they enable the ranking of those objects, are reductive since, even in the cases where the used aggregation rules are technically acceptable, they involve a subjective character and often an ideological charge. Reducing the multidimensional evaluation of objects to a scalar by recurring to aggregation procedures enables, the ranking of those objects, but it is our conviction that these procedures are reductive since, even in the cases where the used aggregation rules are technically acceptable, they involve a subjective character and often an ideological charge. So, the contents and the architecture of those indices are conditioned by the ideological/interest positions of the involved politic, economic and social actors.
In [4] this approach was tested by assessing the Rio de Janeiro State’s Green Economy considering the most representative sectors of activity. It was a success namely because it avoids the use of a single index of green economy. Furthermore, [5] carried out a study regarding the quality of life and sustainability. Both studies show the usefulness of the approach in complex decision problems involving very subjective options of the decision makers. Furthermore, these problems usually involve multiple actors suggesting the necessity of adapting the software to this issue. It must be reminded that Group Decision is a complex process involving multidisciplinary topics from psychology, sociology, organizational and political sciences, etc. Effective Group Decision Support Systems involve not only new information and communication technologies (ICT) and Operations Research/Management Science (OR/MS) models, but also take into account behavioral issues.
The main features required to a face-to-face cooperative group approach were suggested in [6], based on the previous case dealing with quality of life and sustainability. Recently this work was deepened and the software implemented. This communication consists in a guided tour of the desktop application emphasizing its potentialities and limitations.
The next section starts by a review of the original software. It continues by presenting the main features of the Group Decision module, namely:
a. Allowing the individual intervention of several elements of the group. The graphical representations put in evidence the actions of the different actors and, when there is no consensus, the software allows identifying how far they are from each other;
b. Some logical tools allowing a simple identification of the conclusions supported by all elements of the group or by any pre-specified subset of them; those supported by at least one element of the group; and those supported by at least a pre-specified number of elements of the group;
c. The software allows the introduction of hidden constraints on the feasible variations of the above referred to thresholds. It will be put in evidence that this issue is particularly useful in what concerns group decision settings.
2 A summary of the desktop application’s guided tour
2.1 The single user software tool – a brief review
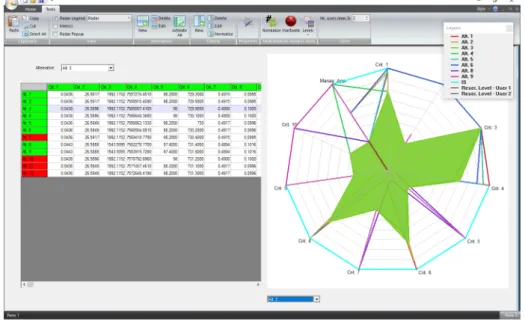
The software’s desktop interface (Fig. 1) presents on the left-hand side the performance matrix, in which each row describes an alternative and each column describes the performance (quantitatively or qualitatively) of the alternatives against each attribute. On the right-hand side these performances are represented through a radar chart, enabling the decision-makers to easily visualize the peculiar differences between alternatives when facing all the criteria. On this radar, each axis represents an attribute and the performances of alternatives are plotted along the axes. Each alternative is represented in the chart through a star, filled or not, in which the vertices lie on the axes (in example of Fig. 1 we can see the filled star relative to alternative 3 in the foreground).
Fig. 1 Single user software’s desktop interface.
Some tools are available to start analyzing the performance matrix. The application allows the users to disregard redundant criteria, by inactivating those in which all the alternatives have exactly the same or similar (considering a small tolerance) performance values. Moreover, it also allows the users to inactivate dominated, or even quasi-dominated1, alternatives (in example of Fig.1 alternatives 7, 10, 11 and 12 are inactivated, so they appear in red).
1 The concept of quasi-dominance extends the concept of dominance between alternatives considering a tolerance 𝜀 > 0.
As already mentioned, the multi-attribute analysis module stands for an interactive implementation of a version of the conjunctive method2. To put into practice the method, the software enables the consideration of up to three performance thresholds, having in mind to classify the alternatives under evaluation into four classes: “unacceptable”, “acceptable”, “good” and “excellent”. For details about the manipulation of the application, please see [1, 2, 3].
2.2 Main features of the Group Decision module: outline and exemplification 2.2.1 Individual intervention of the elements of the group
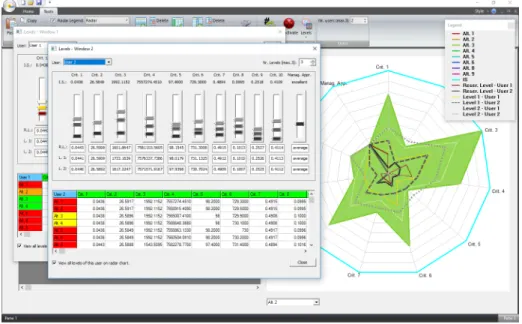
The process of setting the thresholds for the various attributes (through the sliding controls or through the adjustable pinpoints on the radar chart) may be carried out by each one of the decision-makers. The representation of the thresholds in the radar chart to delimitate classes is made through different colors, depending on the threshold and on the decision-maker. Fig. 2 shows the windows where the elements of the group can set their thresholds, in this case the first two decision-makers, and the matrix of the objects under evaluation with the corresponding performance on each attribute.
Fig. 2 Setting of thresholds.
When a user manipulates/changes the thresholds, the first column of the matrix automatically informs through colors which class the objects under study belong to, giving an immediate feedback about his/her choices.
2 In its elementary version consists in eliminating alternatives that do not reach specific performance levels for all the criteria here considered.
The representation in the radar chart of the three thresholds, corresponding to level 0, level 1 and level 2, is made through unfilled polygons using colored solid, dashed and dotted lines. Depending on the user, the colors are different but in any case, the dark color represents level 0, the intermediate color level 1 and the light color represents level 2. Since the implemented algorithm uses the conjunctive rule the alternatives will appear with the following colors: red if at least one of its attributes does not reach the reservation level (level 0 or “acceptable” threshold); orange if every attributes satisfy level 0 but at least one attribute does not reach the “good” threshold (level 1); yellow if every attributes satisfy the “good” threshold but at least one attribute does not reach the “excellent” threshold (level 2) and green if every attributes satisfy the “excellent” threshold.
By moving the mouse over a cell relative to an alternative, the application gives some important information about it, namely:
• The performance thresholds, defined by the user, responsible for the current classification of the alternative;
• For each threshold identified in the previous point, how far (in absolute value and also in percentage) is the alternative’s performance from the threshold;
• Also for each threshold identified, in the absence of consensus between decision-makers, the comparison between the user requirements.
For the example shown in Fig. 2, the information associated with alternative 3, for the decision-maker 2, is, in short: a) the classification in class “good” is due to the level 2 thresholds not satisfied by attributes 2 and 5; b) the alternative’s performance is 6% worse than level 2 threshold of attribute 2 and 7.5% worse than level 2 threshold of attribute 5; c) for both attributes, the other decision-maker is less demanding. For the other user this alternative is classified in class “excellent”.
This way, the manipulation of the controls and the analysis of the various information provided by the software allow users to gradually become aware of the problem under study and give rise to a complete understanding of the behavior of the alternatives when dealing with the levels required for the criteria.
2.2.2 Logical tools
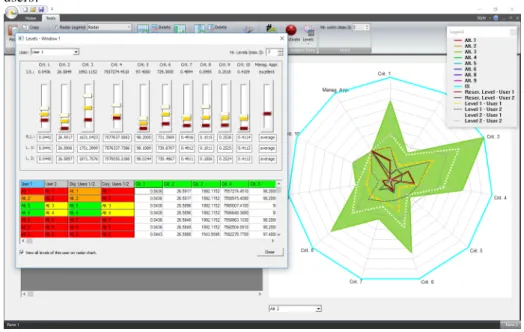
In order to facilitate the perception of all the information, the software allows making logical operations between the considerations of the users. At present, the operations implemented are disjunction and conjunction between 2 or 3 users. In case of the operator disjunction, an object is classified in the class corresponding to the highest threshold if satisfies for at least one of the users involved in the operation. The operator conjunction assigns an object to the class corresponding to the highest threshold it satisfies for all the users involved in the operation. Fig. 3 shows the result of disjunction and conjunction operators between decision-makers 1 and 2, in the same window where the attribute’s thresholds of both users are presented. In this case, alternatives 3 and 4 are yellow for the conjunction and green for the disjunction, confirming that both are good for one of the users and excellent for the other. In a situation with more users this can be useful. Once again, some new information can be attained by moving the mouse over a cell relative to an alternative in an operator column.Finally, it is also possible to identify the class that guarantees the satisfaction of at least any two decision-makers. Of course, if considering more than three
users/decision makers it should be possible to make this analysis for any sub-set of users.
Fig. 3 Disjunction and conjunction operators.
2.2.3 Constraints on threshold variations
Another tool presented here, which can be very useful, especially in the case of several decision agents, is the possibility of including hidden constraints in the definition of each one of the thresholds, for each one of the decision-makers.
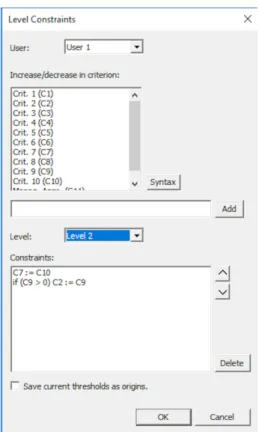
In many situations, there are dependencies among indicators and so among the corresponding thresholds. The computational tool under development can be very useful, because it allows the introduction, in the background, of linear constraints on the variations in the thresholds, limiting or imposing their joint variation / fixation. The tool supports numerous forms of functional and logic processing semantics. Fig. 4 shows an example in which two constraints, in level 2 threshold, were added for the first decision-maker.
The first constraint
C7 := C10 (1)
assigns the increase or decrease of the value of level 2 threshold in criterion 10 to the same threshold variation (in %) in criterion 7. So, any change in the value of level 2 threshold of criterion 10 is also applied to the level 2 threshold of criterion 7.
The second constraint
if (C9 > 0) C2 := C9 (2)
assigns the increase, and only the increase, of the level 2 threshold value in criterion 9 to the same threshold variation (in %) in criterion 2.
Fig. 4 Level threshold constraints dialogue box.
3 A case study: Software test in progress
In [4], the single user/decision maker version of this software was used to assess the Rio de Janeiro State’s green economy level, considering the most representative activity sectors. It was concluded that the usefulness of this user-oriented tool is mostly due to its simplicity, both conceptually and from the operational point of view, as well as to the extensive interactive graphic representations and to its flexibility of use. Furthermore, we realized that one of the limitations of the application was not being able to deal explicitly with a cooperative and diversified group of actors involved in this complex problem. Of course, this was one of the motivations for the development the new module of the desktop application here presented. The software demo in the conference presentation will be supported by the previously mentioned case study simulating the cooperation of three decision makers privileging economic, environmental and social issues, respectively. This experience now in progress will be reported in a paper to be submitted after the conference.
References
1. Fernandes, S., Captivo, M.E., Clímaco, J.: A DSS for bicriteria location problems. Decision Support Systems 57, 224–244 (2014) http://dx.doi.org/10.1016/j.dss.2013.09.014
2. Clímaco, J., Captivo, M.E., Fernandes, S.: Classificação Multi‐Atributo Suportada por uma Versão Interactiva do Método Conjuntivo, CIO − Working Paper 9/2011 (2011) (in Portuguese).
3. Fernandes, S., Captivo, M.E., Clímaco, J.: A multi-attribute analysis module for SABILOC —a DSS for location problems. In: A. Respício, F. Burstein (eds.) Fusing DSS Into the Fabric of the Context, IOS Press, pp. 197–208 (2012)
4. Valle, R., Clímaco, J.: A new tool to facilitate quantitative assessment of green activities — A trial application for Rio de Janeiro. Technological Forecasting & Social Change 98, 336– 344 (2015)
5. Clímaco, J., Craveirinha, J.: A New Interactive System dedicated to the Evaluation of Quality of Life and Sustainability. Proceedings of the ISORAP 2013, Marrakesh (2013) 6. Clímaco, J., Craveirinha, J.: Multi-Actor Multidimensional Quality of Life and Sustainable
Impact Assessment – Discussion Based on a New Interactive Tool. Proceedings of GDN 2013, Stockholm, pp. 454-457 (2013)