Lucía
Fernández
Fernández
Degradação de 17β-estradiol em meio aquoso por
processos de fotossensibilização e biodegradação
Degradation of 17β-estradiol in water media by
photosensitized and biodegradation processes
Lucía
Fernández
Fernández
Degradação de 17β-estradiol em meio aquoso por
processos de fotossensibilização e biodegradação
Degradation of 17β-estradiol in water media by
photosensitized and biodegradation processes
Doctoral thesis submitted to the Universidade de Aveiro to fulfill the
requirements to obtain the degree of Doctor of Chemistry from Universidade de Aveiro. This doctoral thesis was prepared under the supervision of Doctor João Paulo Costa Tomé, Associate Professor at Centro de Química Estrutural, Instituto Superior Técnico, Universidade de Lisboa; Doctor Maria Ângela Sousa Dias Alves Cunha, Assistant Professor at the Department of Biology,
Universidade de Aveiro; and Doctor Valdemar Inocêncio Esteves, Assistant Professor at the Department of Chemistry, Universidade de Aveiro.
Financial support came from FCT/MEC to QOPNA (FCT UID/QUI/00062/2013), CESAM (FCT UID/MAR/LA0017/2013), CICECO (FCT UID/CTM/50011/2013) and CQE (FCT UID/QUI/0100/ 2013) research units, through national funds, and where applicable cofinanced by the FEDER, within the PT2020 Partnership Agreement. This work was also supported by the Seventh Framework
o júri
presidente Prof. Dr. Fernando Joaquim Fernandes Tavares Rocha Cathedratic Professor - Department of Geosciences - Universidade de Aveiro
Dr. Maria de Fátima Costa Guedes da Silva
Associate Professor with Aggregation - Department of Chemical Engineering - Instituto Superior Técnico – Universidade de Lisboa
Dr. Anthony Joseph Burke
Assistant Professor with Aggregation - Department of Chemistry – Universidade de Évora
Dr. Adelaide Almeida
Associate Professor with Aggregation - Department of Biology - Universidade de Aveiro
Dr. Maria Eduarda Bastos Henriques dos Santos
Assistant Professor - Department of Chemistry - Universidade de Aveiro
Dr. Rudolf Josef Schneider
Head of Division - BAM Federal Institute for Materials Research and Testing, Berlin, Germany
Dr. Kevin Huvaere
Principal Researcher (Chief Scientist), EcoSynth, Ostend, Belgium
Dr. João Paulo Costa Tomé (supervisor)
Associate Professor – Department of Chemical Engineering – Instituto Superior Técnico - Universidade de Lisboa
agradecimentos acknowledgments
I would like to express my sincere acknowledgment to my main supervisor, Dr. João Tomé, for giving me the opportunity to join this adventure, encouraging my research and making me grow as scientist. Thank you for all the support, motivation and knowledge. This has been hard, but also fun. I would like to thank my co-supervisors, Dr. Ângela Cunha and Dr. Valdemar Esteves, for their continuous help and inspiration, insightful expertise and enthusiasm.
My true acknowledgment also goes to Dr. Rudolf J. Schneider, who provided me the opportunity to join his team at the Federal Institute for Materials Research and Testing, in Berlin, for nine months. Thank you for all the access to the amazing laboratory and research facilities, for your friendliness and for your dedication.
I would like to thank Dr. Kevin Huvaere, for hosting me at EcoSynth, in Ostend, for just one month, but probably one of the most fruitful period within this work. Thank you for all the care and dedication during my stay, and for your wise advices.
I would especially like to thank all technicians from QOPNA and BAM, because their indispensable work has been essential in achieving my goals. Thank you for your availability and knowledge.
A big acknowledgment goes to my labmates in Aveiro, for all the help and stimulating discussions, and above all, for all the fun and affection. I thank to Antonio Louvado, who helped me a lot in the area of microbiology. I would also like to thank all my colleagues in BAM. In particular, I am especially grateful to Holger Hoffmann and Gabriela Alfaro Espinoza, for all their help and kindness in every moment.
I thank my colleagues from the SO2S project, for all the motivation and nice
times we spent. Especial acknowledgments go to Wioleta Borzęcka, Margarida Carvalho and Mafalda Bispo, because it was really nice to travel together a part of this trip.
I would like to thank to Sara Pena, Paula G. Cochón and Noemi Fernández, for all their inspiration, friendship and love.
A big acknowledgment goes to my partner and my love, Xose Lois.
Gracias infinitas a mi familia, especialmente a mis padres, por su apoyo incondicional y por todo su amor. Gracias a mi hermana por creer en mí. Y a Nico, por la magia y su ternura.
palavras-chave Tratamento de águas, desinfecção de águas, poluentes orgânicos,
17β-estradiol, fotodegradação, porfirina, ftalocianina, nanopartículas magnéticas, modo de fluxo, biodegradação.
resumo Novos métodos de tratamento de água são requeridos como um resultado a partir da crescente sensibilização para a redução do impacto da poluição no ambiente. As principais vias para a destruição de compostos tóxicos em água são os processos de biodegradação e fotodegradação. A degradação biológica de um composto químico refere-se à eliminação do poluente pela actividade metabólica de microrganismos. A fotodegradação é um mecanismo eficiente para degradar simultaneamente diferentes tipos de compostos orgânicos. No entanto, a fotodegradação pode implicar custos elevados relacionados com a produção dos fotocatalisadores e o consumo energético. Na perspectiva de abordagens sustentáveis para o tratamento da água, sugere-se a combinação de tratamentos de fotodegradação e biológicos.
Os compostos disruptores endócrinos (CDEs) são considerados pela investigação como uma prioridade elevada, pois são uma fonte de potencial adverso para efeitos de saúde ecológica nas águas ambientais. O 17β-estradiol (E2), um recalcitrante CDE, foi seleccionado como poluente alvo neste trabalho.
Nesta dissertação descreve-se a preparação e a avaliação fotocatalítica de novos materiais híbridos à base de nanopartículas de magnetita decoradas com porfirinas ou ftalocianinas. Este estudo apresenta a aplicação destes fotocatalisadores em modos batch e de fluxo, bem como a sua utilização em águas residuais reais para remoção de diferentes poluentes orgânicos. Adicionalmente, modificações ligeiras destes materiais permitem a sua utilização como agentes antimicrobianos para fins de desinfecção da água contra bactérias patogénicas.
O rastreio de estirpes bacterianas capazes de metabolizar o E2 como poluente orgânico alvo em águas provocou a descoberta de utilizações relevantes da estirpe bacteriana Bacillus licheniformis, isolada previamente a partir de sedimentos de profundidade do mar no Golfo de Cádiz. Bacillus licheniformis apresenta uma grande versatilidade em aplicações de remediação de água, sendo capaz de remover diferentes estrogênios em concentrações relevantes (ng·L-1) em águas residuais. Finalmente, o estudo de uma abordagem
combinada para o tratamento de águas foi focado na capacidade de Bacillus licheniformis para tratar a água, a partir da qual foi previamente e parcialmente foto-tratada pela ação de um material híbrido, sob irradiação de luz branca.
keywords Water treatment, water disinfection, organic pollutants, 17β-estradiol,
photodegradation, porphyrin, phthalocyanine, magnetic nanoparticles, flow mode, biodegradation.
abstract New methods for water treatment are required as a result from an increasing awareness in the reduction of the pollution impact in the environment. The main routes for destroying toxic compounds in water are biodegradation and photodegradation processes. Biological degradation of a chemical refers to the elimination of the pollutant by the metabolic activity of microorganisms. Photodegradation is an efficient mechanism for simultaneously degrade different types of organic compounds. However, photodegradation may imply high costs related to the photocatalysts’ production and energetic consumption. In the perspective of sustainable approaches for water treatment, the combination of photo- and biological treatments are proposed.
Endocrine disrupting compounds (EDCs) are considered as high research priority being a source of potential adverse ecological health effects in environmental waters. 17β-estradiol (E2), a recalcitrant EDC, was selected as target pollutant in this work.
In this dissertation, the preparation and photocatalytic evaluation of new hybrid materials based on magnetite nanoparticles decorated with porphyrins or phthalocyanines are described. This study presents the application of these photocatalysts in both batch and flow modes, as well as their use in real wastewaters for the removal of different organic pollutants. In addition, slight modifications of these materials allow their utilization as antimicrobial agents for water disinfection purposes, against pathogenic bacteria.
The screening of bacterial strains able to metabolize E2 as target organic pollutant in water caused the finding of relevant uses of the bacterial strain Bacillus licheniformis, previously isolated from deep sea sediments in the Gulf of Cádiz. Bacillus licheniformis displays great versatility in water remediation applications, being able to remove different estrogens in relevant concentrations (ng·L-1) in wastewaters. Finally, the study of a combined
approach for water treatment was focused on the ability of Bacillus licheniformis to treat water, which previously was partially photo-treated by the action of a hybrid material, under white light irradiation.
TABLE OF CONTENTS
LIST OF FIGURES ... VII LIST OF TABLES ... XIV ABBREVIATIONS ... XVI SYMBOLS ... XIX
CHAPTER 1- INTRODUCTION ... 1
1.1. OVERVIEW:GENERAL CONSIDERATIONS ABOUT WATER POLLUTION ... 5
1.2. WATER TREATMENT PROCESSES FOR ORGANIC POLLUTANTS REMOVAL ... 9
1.3. PORPHYRINS AND PHTHALOCYANINES AS PHOTOSENSITIZERS IN WATER TREATMENT APPLICATIONS ...14
1.3.1. General considerations of porphyrins and phthalocyanines ...14
1.3.2. Synthetic strategies for the preparation of porphyrins ...16
1.3.3. Synthesis of meso-substituted porphyrins ...17
1.3.4. Synthetic strategies for the preparation of phthalocyanines ...19
1.3.5. Water-stable porphyrins and phthalocyanines ...21
1.3.6. Photocatalytic performance of immobilized porphyrins and phthalocyanines in the degradation of organic pollutants in water ...23
1.4. DEGRADATION OF ORGANIC POLLUTANTS BY BACTERIA ...26
1.4.1. General considerations about biodegradation of organic pollutants ..26
1.4.2. Estrogen-degrading bacteria ...29
1.4.3. Pathways of aerobic biodegradation of estrogens ...31
1.5. COMBINED PHOTODEGRADATION AND BIOLOGICAL PROCESSES FOR WATER TREATMENT ...33
CHAPTER 2 - NANOMAGNET-PHOTOSENSITIZER HYBRID MATERIALS FOR THE DEGRADATION
OF 17Β-ESTRADIOL IN BATCH AND FLOW MODES ...39
2.1. INTRODUCTION ...43
2.2. RESULTS AND DISCUSSION ...44
2.2.1. Synthesis and characterization of non-immobilized porphyrin and phthalocyanine based PSs ...44
2.2.2. Photophysical properties of non-immobilized porphyrin and phthalocyanine based PSs ...52
2.2.3. Synthesis and characterization of immobilized porphyrins and phthalocyanines (NP-PS) ...54
2.2.4. Photophysical properties of NP-PS ...57
2.2.5. pH stability studies of PS and NP-PS ...58
2.2.6. 1O2 generation by PS and NP-PS ...61
2.2.7. Radicals generation by PS and NP-PS ...62
2.2.8. Batch mode photodegradation studies of E2 in presence of PS and NP-PS ...65
2.2.9. Flow mode photodegradation studies of E2 in presence of PS and NP-PS ...69
2.3. CONCLUSIONS ...76
2.4. EXPERIMENTAL SECTION ...77
2.4.1. Apparatus and characterization ...77
2.4.2. Materials and reagents ...78
2.4.3. Synthesis of 5,10,15,20-tetrakis(2,3,4,5,6-pentafluorophenyl)porphyrin (TPPF20) ...78
2.4.4. Synthesis of 2,3,4,6-tetra-O-acetyl-glucosyl thioacetate (GlcAcSAc) .. ...78
2.4.5. Synthesis of 5,10,15,20-tetrakis[4-(2,3,4,6-tetra-O-acetyl-β-D-glucopyranosylthio)-2,3,5,6-tetrafluorophenyl)]porphyrin (TPPF16(SGlcAc)4) ...79
2.4.6. Synthesis of 5,10,15,20-tetrakis[4-(β-D-glucopyranosylthio)-2,3,5,6-tetrafluorophenyl)]porphyrin (TPPF16(SGlc)4) ...80 2.4.7. Synthesis of 5,10,15-tris[4-(2,3,4,6-tetra-O-acetyl-β–D- glucopyranosylthio)-2,3,5,6-tetrafluorophenyl)]-20-(2,3,4,5,6-pentafluorophenyl)porphyrin (TPPF17(SGlcAc)3) ...80 2.4.8. Synthesis of 5,10,15-tris[4-(β-D-glucopyranosylthio)-2,3,5,6-tetrafluorophenyl)]-20-bis(2,3,4,5,6-pentafluorophenyl)porphyrin (TPPF17(SGlc)3) ...81 2.4.9. Synthesis of 1,4,8,11,15,18,22,25-octafluoro-2,3,9,10,16,17,23,24-octakis(2,3,4,6-tetra-O-acetyl-β–D-glucopyranosylthio)phthalocyaninato zinc (II) (ZnPc(SGlcAc)8) ...82
2.4.10. Synthesis of 1,4,8,11,15,18,22,25-octafluoro-2,3,9,10,16,17,23,24-octakis(β-D-glucopyranosylthio)phthalocyaninato zinc (II) (ZnPc(SGlc)8) ...82
2.4.11. Synthesis of magnetic nanoparticles coated with silica (Fe3O4@SiO2 -PrNH2) ...82
2.4.12. Synthesis of the Nanomagnet-Photosensitizer hybrids ...83
2.4.13. Photostability tests ...83
2.4.14. pH stability test ...84
2.4.15. Determination of sensitized 1O2 generation ...84
2.4.16. Determination of sensitized generation of radicals...85
2.4.17. Photodegradation of E2 in batch mode ...85
2.4.18. Photodegradation of E2 in flow mode ...85
2.4.19. Quantification of E2 ...86
CHAPTER 3 - ANTIMICROBIAL PHOTODYNAMIC ACTIVITY OF CATIONIC NANOPARTICLES DECORATED WITH GLYCOSYLATED PORPHYRINS OR PHTHALOCYANINES FOR WATER DISINFECTION ...87
3.1 INTRODUCTION ...91
3.2.1 Preparation of NP+-PS...92
3.2.2 Characterization of NP+-PS ...93
3.2.3 Evaluation of photophysical properties of NP+-PS ...97
3.2.4 Bioluminescence versus viable counts of an overnight culture of E. coli ...99
3.2.5 Photosensitization of E. coli ... 100
3.2.6 Recycling of NP+-PS in successive PDI cycles ... 104
3.3 EXPERIMENTAL SECTION ... 107
3.3.1 Apparatus and characterization ... 107
3.3.2 Materials and reagents ... 107
3.3.3 Synthesis of the cationic nanomagnet-PS hybrids (NP+-PS)... 107
3.3.4 Photostability and aqueous stability tests ... 108
3.3.5 Determination of sensitized 1O2 generation ... 108
3.3.6 Bacteria growth conditions ... 109
3.3.7 Screening assays with a bioluminescent E. coli strain ... 109
3.3.8 Assays of photodynamic inactivation with a bioluminescent strain .. 109
3.3.9 Recycling studies of NP+-PS ... 110
CHAPTER 4 - BIODEGRADATION OF ESTROGENS BY BACTERIA ISOLATED FROM NATURAL ENVIRONMENTS ... 111
4.1. INTRODUCTION ... 115
4.2. BACTERIAL STRAIN SELECTED FOR ESTROGEN REMOVAL ... 118
4.3. RESULTS AND DISCUSSION ... 119
4.3.1. Identification of isolates from deep sea sediments (LF1-LF5) ... 119
4.3.2. E2 degradation under aerobic conditions ... 121
4.3.3. Influence of NaCl content and temperature on E2 degradation by LF1, LF3 and LF5 ... 131
4.3.4. Influence of initial concentration of E2 in biodegradation tests with LF1,
LF3 and LF5 ... 132
4.3.5. Simultaneous biodegradation of E1, E2, E3 and EE2 with LF1, LF3 and LF5 ... 134
4.3.6. Biodegradation of E2 by LF1, LF3 and LF5 in presence of other carbon sources ... 136
4.3.7. Biodegradation of estrogens in real water samples from a WWTP . 139 4.3.8. Transformation products in E2 biodegradation with LF5 ... 143
4.3.9. E2 degradation under anaerobic conditions with LF1, LF3 and LF5 .... ... 151
4.4. CONCLUSIONS ... 153
4.5. MATERIALS AND METHODS ... 154
4.5.1. Materials and equipment ... 154
4.5.2. Bacterial growth conditions ... 154
4.5.3. Identification of strains LF1 to LF5 ... 155
4.5.4. Estrogen degradation tests under aerobic conditions ... 155
4.5.5. Estrogen degradation tests at lower concentrations ... 156
4.5.6. E1, E2, E3 and EE2 degradation tests ... 157
4.5.7. Estrogen degradation tests in presence of D-(+) glucose ... 157
4.5.8. Estrogen degradation in wastewater ... 158
4.5.9. Estrogen degradation tests under anaerobic conditions ... 158
4.5.10. Quantification of estrogens with HPLC-UV ... 159
4.5.11. Quantification of estrogens and evaluation of metabolites with LC-MS ... 160
4.5.12. Quantification of D-(+) glucose ... 161
4.5.13. Growth related degradation ... 162
CHAPTER 5 - WATER TREATMENT BY COMBINATION OF PHOTOCATALYTIC AND BIOLOGICAL
PROCESSES ... 163
5.1 INTRODUCTION ... 167
5.2 RESULTS AND DISCUSSION ... 168
5.2.1 Nitrogen adsorption-desorption isotherm and pore size distribution of NP+-TPPF 17(SGlc)3 ... 168
5.2.2 Photostability studies of NP+-TPPF 17(SGlc)3 under UVA radiation . 170 5.2.3 Photocatalytic performance of NP+-TPPF 17(SGlc)3 in recycling studies of E2 photodegradation ... 171
5.2.4 Photodegradation of pharmaceuticals in real water samples of a WWTP influent in presence of NP+-TPPF 17(SGlc)3 ... 172
5.2.5 17β-Estradiol removal by combination of photocatalytic and biological processes with NP+-TPPF 17(SGl)3 and Bacillus licheniformis (LF5)... 176
5.3 CONCLUSIONS ... 179
5.4 MATERIALS AND METHODS ... 180
5.4.1 Materials and equipment ... 180
5.4.2 Photostability studies of NP+-TPPF 17(SGlc)3 under UVA radiation . 180 5.4.3 Photocatalytic performance of NP+-TPPF 17(SGlc)3 in recycling studies of E2 photodegradation ... 180
5.4.4 Photodegradation of pharmaceuticals in real water samples of a WWTP influent in presence of NP+-TPPF 17(SGlc)3 ... 181
3.3.1 Combined water treatment approach... 182
5.4.5 Quantification of organic pollutants and evaluation of metabolites with LC-MS ... 182
CHAPTER 6- GENERAL CONCLUSIONS AND FUTURE PERSPECTIVES ... 187
List of figures
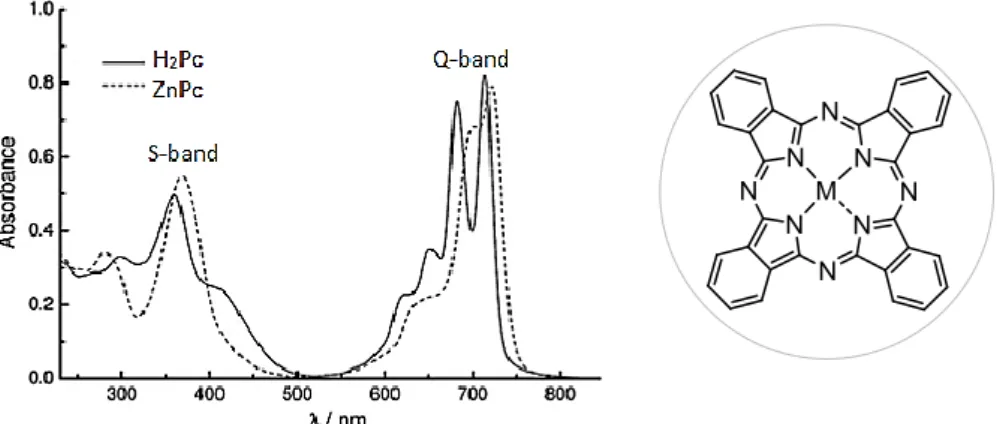
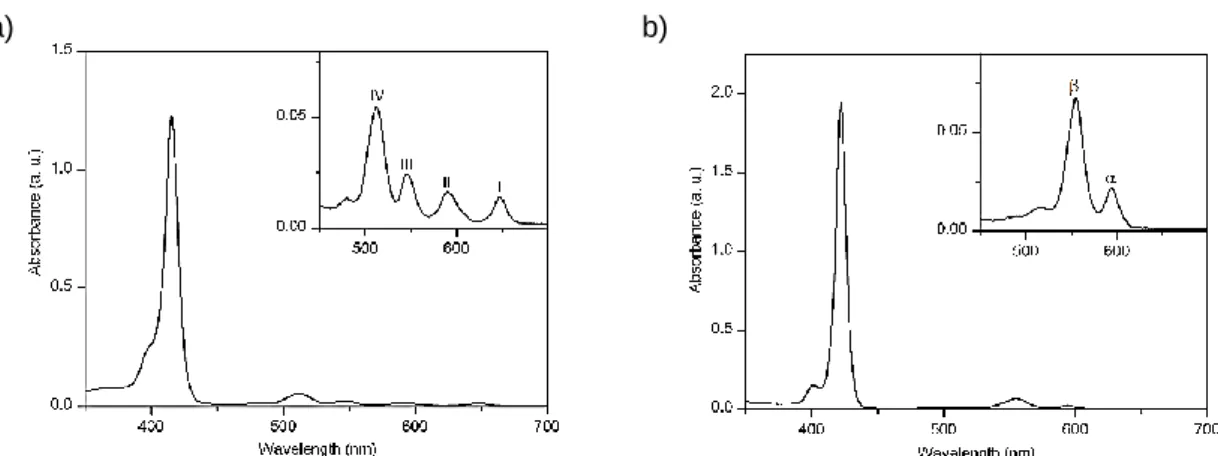
Figure 1.1. Mechanism of action for a steroid hormone. ... 7 Figure 1.2. Molecular structure of a) natural and b) synthetic estrogens. ... 8 Figure 1.3. Scopus search for relevant publications in the field of water treatment, reported by year. ...10 Figure 1.4. Schematic representation of ROS generation by photochemical processes. .13 Figure 1.5. Molecular structure of a) porphine, the simplest Por macrocycle; and (b) free-base Pc...14 Figure 1.6. Structure and typical absorption spectra of free-base Pc (black line, M = H2)
and metal complex ZnPc (dashed line, M = Zn) ...15 Figure 1.7. Typical UV–vis absorption spectra for (a) a free-base Por and (b) a Por–metal complex. ...16 Figure 1.8. Historically important Pors prepared by Fischer: a) ethio porphyrin III, b) octamethytlporphyrin, c) protoporphyrin IX. ...16 Figure 1.9. Most common substitution patterns found around the Por macrocycle: a) β- and meso-unsubstituted porphine, b) β-substituted OAPs, c) meso-aryl substituted Por. ...17 Figure 1.10. Schematic representation of (a) MPc(SO3H)4 and (b) MPc(CO2H)8, both
immobilized onto Amberlite®IRA-900 ...24 Figure 1.11. Covalent attachment of ZnPc(CO2H)8 onto MNPs. ...25
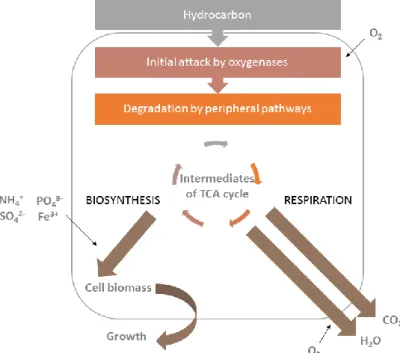
Figure 1.12. General schemes to biodegrade organic pollutants: a) oxidative biodegradation and b) reductive biodegradation ...27 Figure 1.13. Main principle of aerobic degradation of hydrocarbons by microorganisms. 28 Figure 2.1. 19F NMR spectrum of TPPF
20 in CDCl3. ...45
Figure 2.2. 1H NMR spectrum of GlcAcSAc in CDCl
3. ...46 Figure 2.3. 1H NMR spectrum of TPPF 16(SGlc)4 in DMSO-d6. ...47 Figure 2.4.19F NMR spectrum of TPPF 16(SGlc)4 in DMSO-d6. ...48 Figure 2.5. 1H NMR spectrum of TPPF 17(SGlcAc)3 in CDCl3. ...49
Figure 2.6. ESI-QTOF-HRMS spectrum of TPPF17(SGlcAc)3, with m/z: 2007.2867 Da
(M+H)+ and 1004.8048 Da (M+2H)2+. ...49
Figure 2.7. ESI-QTOF-HRMS spectrum of TPPF17(SGlc)3, with m/z: 1503.1650 Da (M+H)+.
...50 Figure 2.8. 1H NMR spectrum of TPPF
17(SGlc)3 in DMSO-d6. ...50 Figure 2.9. 19F NMR spectrum of TPPF
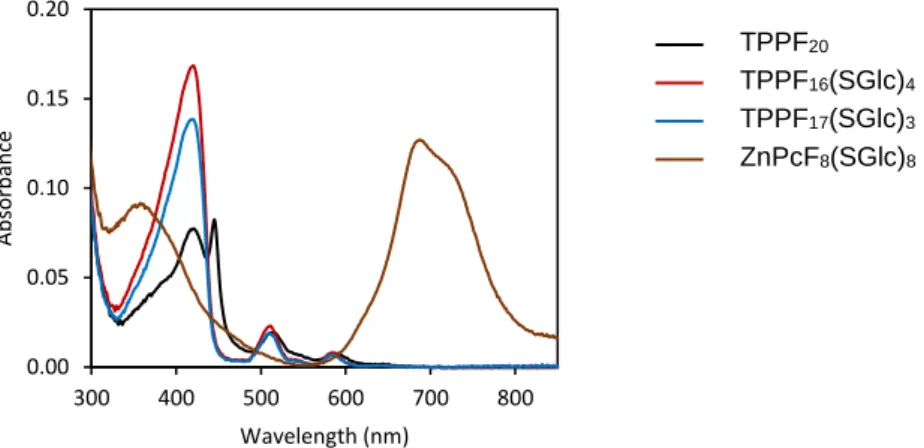
17(SGlc)3 in DMSO-d6. ...51 Figure 2.10. UV-Vis absorption spectra of DMSO solutions containing TPPF20,
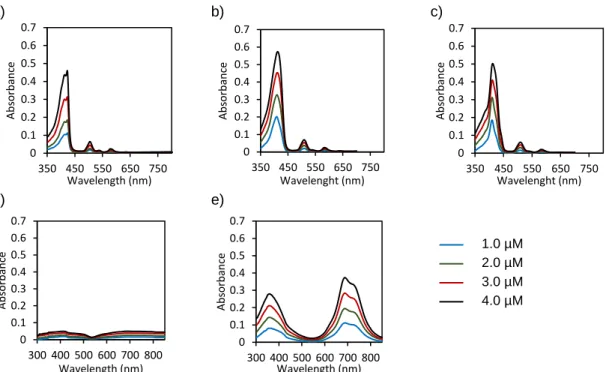
Figure 2.11. UV-Vis absorption spectra of water solutions with 1 vol % DMSO containing different concentrations of (a) TPPF20; (b) TPPF16(SGlc)4; (c) TPPF17(SGlc)3; (d) ZnPcF16;
(e) ZnPcF8(SGlc)8. ...53
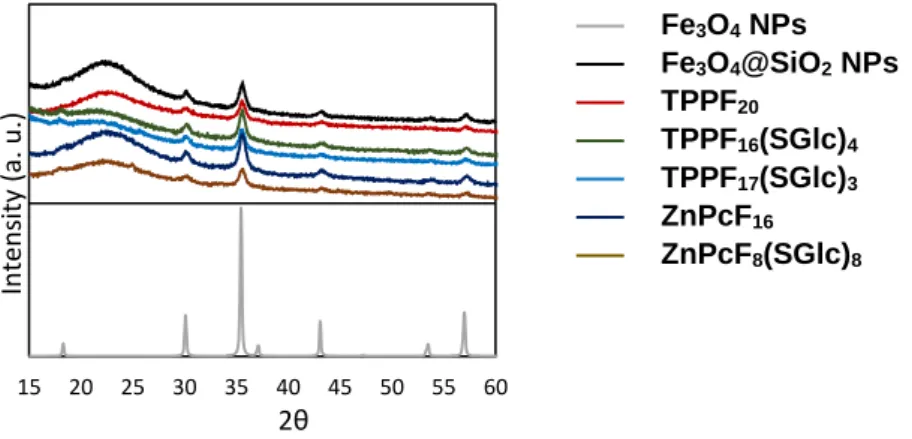
Figure 2.12. XRD patterns of Fe3O4@SiO2 and NP-PSs. ...56
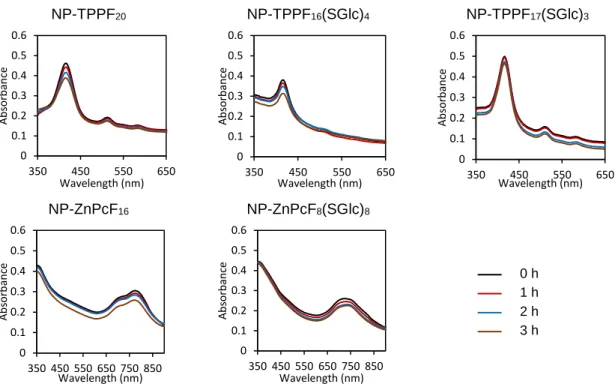
Figure 2.13. Typical TEM image of the prepared hybrid materials showing that the particle size is ca. 15 nm. ...56 Figure 2.14. UV-Vis absorption spectra of aqueous suspensions containing NP-PS at 2 µM upon different times of artificial white light irradiation. ...58 Figure 2.15. UV-Vis absorption spectra of aqueous samples (pH 3) containing a non-immobilized PS at 2 µM after 24 h. ...59 Figure 2.16. UV-Vis absorption spectra of liquid fractions resulting from filtrating aqueous suspensions of NP-PSs subjected to different conditions of pH for 24 h. ...59 Figure 2.17. DLS size distributions of NP-ZnPcF8(SGlc)8 at 2 µM in water at: a) pH 4; b)
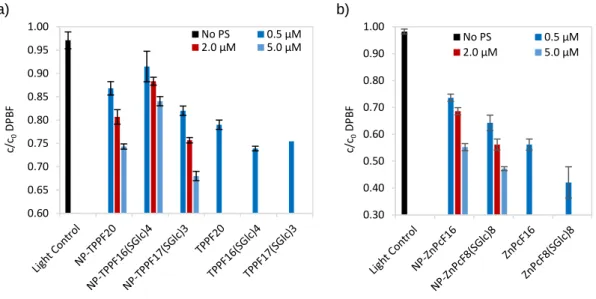
pH 5; c) pH 7; d) pH 8. ...60 Figure 2.18. Degradation of DPBF (50 µM) in DMF/H2O (9:1) upon irradiation with a red
LED array at a fluence rate of 4.0 mW cm-2 and room temperature for: (a) 20 min with or
without Por-based PS; (b) for 5 min with or without Pc-based PSs. ...61 Figure 2.19. Profile of E2 (5 mg·L-1) in presence of NaN
3 (100 mM) as quencher of 1O2
upon: (a) 90 min of artificial white light irradiation with non-immobilized PS (5 µM); and (b) 8 h with NP-PSs (10 µM) with artificial white light irradiation or dark conditions. c) Light control sample of E2, and light control of E2 in presence of NaN3 (100 mM). ...63
Figure 2.20. Visible-light assisted photodegradation of E2 in batch mode in presence of different concentrations of non-immobilized PSs. Values correspond to the average of three independent experiments. ...66 Figure 2.21. Pseudo-first order photodegradation kinetics of E2 in presence of different concentrations of non-immobilized PSs. Values correspond to the average of three independent experiments. ...67 Figure 2.22. a) Isothermal adsorption curves of E2 onto NP-PSs; b) and c) photodegradation of E2 in batch mode in presence of NP-PSs at 10 µM of PS. Values correspond to the average of two independent experiments. ...68 Figure 2.23. Reuse of NP-PSs after recovering and washing processes. ...69 Figure 2.24. Design of the flow photoreactor setup used for photodegradation assays. ..70 Figure 2.25. Photodegradation of E2 in flow mode in presence of: a) non-immobilized PSs at 10 µM, b) NP-PS at 10 µM of PS. Values correspond to the average of two independent experiments. Pseudo-first order photodegradation kinetics of E2 in flow mode in presence
of: c) non-immobilized PSs at 10 µM, d) NP-PS at 10 µM. Values correspond to the average of three independent experiments. ...71 Figure 2.26. Effect of NP-PSs’ concentration in flow mode tests of E2 photodegradation. Blue bars represent E2 adsorbed into the hybrid material; red bars represent E2 in solution, after 35 min of residence time. ...73 Figure 2.27. Effect of the pH on visible-light photodegradation of E2 in flow mode assays with NP-PSs. Blue bars represent E2 adsorbed onto the hybrid material; red bars represent E2 in solution after 35 min of residence time. ...74 Figure 2.28. Recycling tests of visible-light assisted photodegradation of E2 in flow mode. ...75 Figure 3.1. XRD powder spectra of the cationic hybrid materials. Patterns show that magnetite is the main crystal phase. ...94 Figure 3.2. a) Photographs of aqueous dispersions of NP+-TPPF
17(SGlc)3 in vials without
and in presence of a magnetic field for 2 minutes; b) TEM images of NP+-TPPF
17(SGlc)3
and NP+-ZnPcF
8(SGlc)8, which show average particle sizes less than 10 nm. ...94
Figure 3.3. Normalized UV-Vis spectra of non-immobilized PS, NP-PS and NP+-PS in
water. ...95 Figure 3.4. Size distribution analysis of NP-PS using DLS experiments in water. Curves represent the relative population of the corresponding aggregate size given in a logarithmic scale in the x-axis. ...95 Figure 3.5. Size distribution analysis of NP+-PS using DLS experiments in water. Bars
represent the relative population of the corresponding aggregate size given in a logarithmic scale. ...96 Figure 3.6. Schematic representation of NP+-PS according to the reactivity of the starting
PS (represented by yellow stars) for covalent attachment onto NP by nucleophilic attack. ...97 Figure 3.7. Degradation of DPBF (50 µM) in DMF/H2O (9:1) upon irradiation with a red LED
array at a fluence rate of 4.0 mW cm-2 and room temperature for 20 min of irradiation in
absence of PS, or in presence of a Por-based PS (0.5 µM) for 20 min, or in presence of a Pc-based PS (0.5 µM) for 5 min. ...98 Figure 3.8. UV-Vis absorption spectra of aqueous suspensions of hybrid materials at 2 µM upon different times of artificial white light irradiation at 4 mW·cm-2. ...99
Figure 3.9. Relation between bioluminescence and viable counts in overnight cultures of recombinant E. coli (≈ 108 CFU·mL-1); R2 = 0.9964. Values represent the mean of three
Figure 3.10. Schematic illustration of PDI mechanism of NP+-PS on E. Coli as a model
Gram-negative bacteria. ... 101 Figure 3.11. Photodynamic inactivation of E. coli with a) 20 µM of non-immobilized PS or b) neutral nanomagnet-photosensitizer hybrid (NP-PS). Tests were performed under permanent magnetic stirring (mean ± standard deviation of three PDI experiments of 270 min with a fluence rate of 4 mW·m-2). ... 102
Figure 3.12. Photodynamic inactivation of E. coli with a) 10 or b) 20 µM of cationic nanomagnet photosensitizer hybrid (NP+-PS). Tests were performed under a permanent
magnetic stirring (mean ± standard deviation of three PDI experiments of 270 min with a fluence rate of 4 mW·m-2). ... 103
Figure 3.13. Photodynamic inactivation of E. coli (starting bacterial suspension contained log (RLU)= 7.9 ± 0.3) with recycling of materials, conducted at a concentration of 20 µM of NP+-TPPF
16(SGlc)4, NP+-TPPF17(SGlc)3, or NP+-ZnPcF8(SGlc)8, under a permanent
magnetic field (mean ± standard deviation of three PDI cycles of 270 min with a fluence rate of 4 mW·m-2). ... 105
Figure 4.1. a) Map of the SW Iberia-Gulf of Cadiz and b) enlargement of tectonic map of mud volcanoes of this region were LF1-LF5 were isolated ... 118 Figure 4.2. Abiotic control samples in absence of bacteria, under dark conditions. Data shown represent the average values of E2 (blue bars) and E1 (red bars), and errors of three independent experiments. ... 122 Figure 4.3. E2 degradation (5 mg·L-1) profiles by strains strains isolated from compost, LF6
and LF7, under aerobic conditions. Data shown represent the average values of E2 (blue bars), E1 (red bars) and bacterial OD measured at 600 nm (green triangles), and errors of three independent experiments. ... 124 Figure 4.4. E2 degradation profiles by strains isolated from Ria de Aveiro, LF8-LF11, under aerobic conditions. Data shown represent the average values of E2 (blue bars), E1 (red bars) and bacterial OD measured at 600 nm (green triangles), and errors of three independent experiments. ... 126 Figure 4.5. Sediment plume along Gulf of Cádiz. Image taken on 12th November 2012 by
NASA’s Aqua satellite. ... 127 Figure 4.6. E2 degradation profiles by strains isolated from deep sea sediments, LF1-LF5, under aerobic conditions. Data shown represent the average values of E2 (blue bars), E1 (red bars) and bacterial OD measured at 600 nm (green triangles), and errors of three independent experiments. ... 129
Figure 4.7. Effects of temperature and NaCl content on E2 (5 mg·L-1) removal in PBS mod by
LF1, LF3 and LF5 after 5 days of incubation. Data shown represent the average values of E2 (blue bars) and bacterial OD measured at 600 nm (green triangles), and errors of three independent experiments. ... 131 Figure 4.8. E2 degradation profiles by strains LF1, LF3 and LF5, under aerobic conditions, with initial E2 concentrations of a) 5 mg·L-1, b) 1 mg·L-1, c) 100 µg·L-1 and d) 2 µg·L-1. Data
shown represent the average values (red diamonds represent LF1, blue diamonds represent LF3, green diamonds represent LF5,) and errors of three independent experiments. ... 133 Figure 4.9. E1, E2, E3, EE2 co-degradation (100 µg·L-1 each) profiles by strains LF1, LF3
and LF5, under aerobic conditions. Data shown represent the average values (blue bars represent E2, red bars represent E1, orange bars represent E3, purple bars represent EE2) and errors of three independent experiments, and bacterial OD measured at 600 nm (green triangles). ... 135 Figure 4.10. D-(+) Glucose calibration curve. Data shown represent the average values and errors of three independent experiments. R2 = 0.9986. ... 137
Figure 4.11. E2 degradation (100 µg·L-1) profiles by strains LF1, LF3 and LF5, under
aerobic conditions, in presence of D-(+) glucose (10 mg·L-1). Data shown represent the
average values (blue bars represent E2, red bars represent E1, green triangles represent D-(+) glucose) and errors of three independent experiments. ... 138 Figure 4.12. a) Map of the Berlin waterways: clear water discharge (Klarwassereinleitung), water bodies (Gewässer) and the locations of the STPs (Klärwerk), and b) picture of the Ruhleben STP. ... 139 Figure 4.13. Schematic representation of the biodegradation procedure with real water samples collected from WWTP in Ruhleben, Berlin. ... 140 Figure 4.14. Water sample of the influent stream of Ruhleben STP before (left) and after (right) filtration. ... 140 Figure 4.15. Selected HPLC chromatograms corresponding to samples collected from incubation of LF5 with 5 mg·L-1 of E2 after 0, 1 and 3 days. Retention time of E2 is 10.46
min. Retention time of E1 is 10.98 min. ... 144 Figure 4.16. Proposed pathways for E2 degradation by LF5, under aerobic conditions.145 Figure 4.17. a) LC-ESI-MS extracted chromatogram for m/z 271,1; b) Product-ion spectra from collisionally activated decompositions of the ESI produced [M-H]– ion m/z 271.17. 146
Figure 4.18. a) LC-ESI-MS extracted chromatogram for m/z 269,1 and proposed structure; b) Product-ion spectra from collisionally activated decompositions of the ESI produced [M-H]– ion m/z 269.1. ... 146 Figure 4. 19. a) LC-ESI-MS extracted chromatogram for m/z 269,1 and proposed structure; b) Product-ion spectra from collisionally activated decompositions of the ESI produced [M-H]– ion m/z 269.1. ... 147 Figure 4.20. a) Enlargement of a HPLC chromatogram corresponding to a sample collected from incubation of LF5 with 5 mg·L-1 of E2 after 4 days; b) LC-ESI-MS extracted
chromatogram for m/z 287,1 and proposed structure; c) Product-ion spectra from collisionally activated decompositions of the ESI produced [M-H]– ion m/z 287.1. ... 148 Figure 4.21. a) LC-ESI-MS extracted chromatogram for m/z 285,1 and proposed structure; b) Product-ion spectra from collisionally activated decompositions of the ESI produced [M-H]– ion m/z 285.1. ... 149 Figure 4.22. a) LC-ESI-MS extracted chromatogram for m/z 287.2 and proposed structure; b) Product-ion spectra from collisionally activated decompositions of the ESI produced [M-H]– ion m/z 287.2. ... 150 Figure 4.23. Profile of E2 degradation by LF5 under anaerobic conditions. Values represent the average (squares represent E2, triangles represent E1) and errors bars represent the standard error of duplicates of one experiment. ... 152 Figure 5. 1. Structural representation of NP+-TPPF
17(SGlc)3. ... 168
Figure 5. 2. a) N2 isothermal adsorption-desorption curves with NP+-TPPF17(SGlc)3; b) pore
size distribution of NP+-TPPF
17(SGlc)3 (BJH adsorption cumulative pore volume). ... 169
Figure 5. 3. a) Set-up of the photostability studies of NP+-TPPF
17(SGlc)3 under UVA
radiation; b) emission spectrum of the UVA lamp used; c) absorption spectra of NP+
-TPPF17(SGlc)3 suspensions in water upon different times of irradiation with UVA light. . 170
Figure 5. 4. XRD spectra of magnetite (light blue line) and NP+-TPPF
17(SGlc)3 before (black
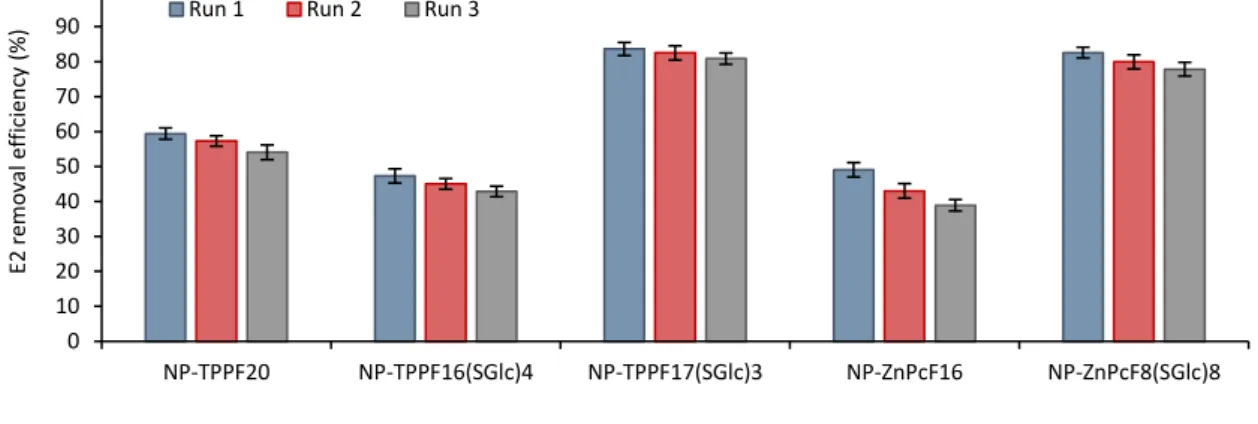
line) and after different exposure times of UVA irradiation (red, blue, pink, green and dark blue lines, corresponding to 1-6 h). ... 171 Figure 5. 5. Reuse of NP+-TPPF
17(SGlc)3 after recovering and washing processes, in the
photodegradation of 5 mg·L-1 of E2 for 6 h, under white light (4 mW·cm-2). Results represent
the average values of three independent studies, bars represent standard deviations. .. 172 Figure 5. 6. Photodegradation of pharmaceuticals in real water samples of a WWTP influent in presence of NP+-TPPF
Figure 5. 7. Selected HPLC chromatograms corresponding to samples collected from photodegradation of 10 mg·L-1 of E2 with NP+-TPPF
17(SGlc)3 at 10 µM after 0, 1 and 4
hours under white light (4 mW·cm-2). Retention time of E2 is 10.93 min... 177
Figure 5. 8. Product-ion spectra from collisionally activated decompositions of the ESI produced [M-H]– ions: a) m/z 287.17, extracted at 5.34 min; and b) m/z 253.10, extracted at 9.71 min. ... 178
List of tables
Table 1.1. Properties and relative estrogenic activity related to 17β-estradiol of free and conjugated estrogens... 8 Table 1.2. Daily excretions (µg) of estrogenic steroids in humans ... 9 Table 1.3. Partial list of estrogen-degrading bacteria. ...30 Table 2.1. Detailed experimental data of the preparation of NP-PSs, by introduction of Pors or Pcs on Fe3O4@SiO2-PrNH2 NPs. ...55
Table 2.2. Ability of PS (5 µM) and NP-PS (10 µM) to generate radicals in situ under irradiation (90 min or 8 h), in presence of NaN3 (100 mM) as 1O2 quencher, using E2 (5
mg·L-1) as a model of organic pollutant. Values correspond to the average of three
independent experiments. ...64 Table 2.3. Kinetic parameters for the photodegradation of E2 in batch mode in presence of different concentrations of non-immobilized PSs. Values correspond to the average of three independent experiments. ...67 Table 2.4. Kinetic parameters for the photodegradation of E2 in flow mode in presence of a non-immobilized PS (10 µM) or a NP-PS (10 µM). Values correspond to the average of three independent experiments. ...71 Table 4.1. Concentration of estrogens in treated effluents. ... 116 Table 4.2. Concentration of estrogens in river waters. ... 116 Table 4.3. BLAST results obtained for the 16S rDNA gene sequence alignments. ... 120 Table 4.4. Incubation time (h) required by LF1, LF3 and LF5 to eliminate 5 mg·L-1, 1 mg·L -1, 100 µg·L-1 and 2 µg·L-1 of E2. ... 134
Table 4.5. Values of TOC, TC and IC of water samples taken from the influent and effluent streams of Ruhleben STP. ... 141 Table 4.6. Concentrations (ng·L-1) of E1, E2, E3 and EE2 and removal rates (%) determined
in water samples taken from the influent and effluent streams of Ruhleben STP during July, 2016. ... 142 Table 4.7. Concentrations (ng·L-1) of E1, E2, E3 and EE2 and removal rates (%) determined
simultaneous estrogens degradation by LF1, LF3 and LF5, in water samples taken from the influent stream of Ruhleben STP during July, 2016. ... 142 Table 4. 8. Retention times, precursor ions, product ions, and MRM conditions used in LC-ESI-MS measurement. ... 161 Table 5. 1. Chemical structures of the environmentally relevant analytes: CBZ, CET, SMX. ... 173
Table 5. 2. Concentrations (ng·L-1) of E1, E2, E3, EE2, CBZ, CET and SMX determined in
water samples taken from the influent stream of Ruhleben STP during August, 2016. ... 174 Table 5. 3. Values of TOC, TC and IC of water samples taken from the influent stream of Ruhleben STP. ... 174 Table 5. 4. Summary of the selected reaction monitoring (SRM) transitions for CBZ, CET, SMX and the deuterated internal standard and some useful tandem mass spectrometry parameters: declustering potential (DP), collision energy (CE), collision cell exit potential (CXP). ... 183
Abbreviations
Amp
Ampicillin
ANOVA
Analysis of variance
AOP
Advanced oxidation process
APTES
(3-Aminopropyl) triethoxysilane
BET
Brunauer–Emmett–Teller
BF
3Boron trifluoride etherate
BJH
Barrett, Joyner, and Halenda
BLAST
Basic Local Alignment Search Tool
br
Broad signal
BSA
Bovine serum albumin
BOD
5Five-day biochemical oxygen demand
ca.
Circa
CBZ
Carbamazepine
CE
Collision energy
CET
Cetirizine dihydrochloride
CFU
Colony-forming units
Cm
Chloramphenicol
COD
Chemical oxygen demand
CTAB
Cetyl trimethylammonium bromide
CXP
Collision cell exit potential
d
Doublet
DBN
Diazabicyclo(4.3.0)non-5-ene
DBP
Disinfection by-product
dd
Doublet of doublets
ddd
Doublet of doublet of doublets
DDQ
2,3-Dichloro-5,6-dicyanobenzoquinone
DEA
Diethylamine
DLS
Dynamic light scattering
DMAE
Dimethylethanolamine
DMF
Dimethylformamide
DMSO
Dimethyl sulfoxide
DNA
Deoxyribonucleic acid
DP
Declustering potential
DPBF
Diphenylisobenzofuran
dt
Doublet of triplets
E. coli
Escherichia coli
E0
Estratetraenol
E1
Estrone
E2
17β-Estradiol
E3
Estriol
EDC
Endocrine disrupting compound
EDTA
Ethylenediaminetetraacetic acid
EE2
17α-Ethinylestradiol
EP
Entrance potential
ESI
Electrospray ionization
GS2
Turbo gas
HMDS
Hexamethyldisilazane
HPLC
High-performance liquid chromatography
IC
Inorganic carbon
ISC
Intersystem crossing
IUPAC
International Union of Pure and Applied Chemistry
LB
Luria Bertani
LOD
Limit of detection
LOQ
Limit of quantification
LED
Light-emitting diode
m
Multiplet
MALDI
Matrix-assisted laser desorption/ionization
MeEE2
3-Methyl ether of ethinylestradiol
MNP
Magnetic nanoparticle
MO
Methyl orange
MPc
Metallophthalocyanine
MPor
Metalloporphyrin
MS
Mass spectrometry
n.a.
Not analysed
N/A
Not applicable
n.d.
Not detected
NAS
Nitrifying activated sludge
NMR
Nuclear magnetic resonance spectroscopy
NP
+-PS
Cationic nanoparticles-photosensitizer
NP-PS
Nanoparticles-Photosensitizer
OAP
Octalkylporphyrin
OD
Optical density
o-DCB
o-Dichlorobenzene
OG
Orange G
PBS
Phosphate buffer saline
PBS
NPhosphate buffer saline with a nitrogen source
Pc
Phthalocyanine
PCR
Polymerase chain reaction
PDI
Photodynamic inactivation of microorganisms
Por
Porphyrin
PS
Photosensitizer
PVDF
Polyvinylidene fluoride
q
Quartet
RDP
Ribosomal database project
RLU
Relative light units
ROS
Reactive oxygen species
rRNA
Ribosomal ribonucleic acid
rt
Room temperature
s
Singlet
SDS
Sodium dodecyl sulfate
SMX
Sulfamethoxazol
SPE
Solid-phase extraction
STP
Sewage treatment plant
SWNT
Single-walled carbon nanotube
t
Triplet
TC
Total carbon
td
Triplet of doublets
TEM
Transmission electron microscopy
TIC
Total ion current
TLC
Thin-layer chromatography
TMS
Tetramethylsilane
TOC
Total organic carbon
TOF
Time-of-flight
TSA
Tryptic soy agar
TSB
Tryptic soy broth
UV-vis
Ultraviolet–visible spectroscopy
WWTP
Wastewater treatment plant
Symbols
ø
Diameter
δ
Chemical shift
ε
Molecular absorption coefficient
λ
Wavelength
3
Σ
Triplet oxygen
HO
•Hydroxyl radical
J
Coupling constant
k
Kinetic rate constant
K
OWOctanol-water partition coefficient
m/z
Mass to charge ratio
n
Number of data
1
O
2
or
1Δ
Singlet oxygen
O
2- •Superoxide anion radical
pKa
Acid dissociation constant
R
•Radical
ROO
•Peroxyl radical
r
Correlation coefficient
S
1Singlet state
S
1*Singlet excited state
S
oSinglet ground state
T
1*Triplet excited state
CHAPTER 1
INTRODUCTION
Fernández, L., Esteves, V.I., Cunha, Â., Schneider, R.J., Tomé, J.P.C., Photodegradation of organic pollutants in water by immobilized porphyrins and phthalocyanines. J. Porphyrins Phthalocyanines. 2016, 20, 150-166
Summary
The main routes for destroying toxic compounds in water are biodegradation and photodegradation processes. Photodegradation is an important mechanism for degrading aromatic hydrocarbons, chlorinated aromatic hydrocarbons, chlorinated phenols and many pesticides. In photolysis, a photosensitizer absorbs light and transfers the energy to the dissolved oxygen or another substrate in the medium to generate reactive oxygen species (ROS), such as singlet oxygen and radicals, which are the responsible species for the degradation of the target compounds.
Photosensitized processes in presence of porphyrins (Pors) and phthalocyanines (Pcs) can be very suitable, due to their ability to absorb several wavelengths in the UV-Vis range and generate ROS at high rates. The use of magnetic supports for the dispersion of Pors and Pcs in water can facilitate its recovery just by applying a magnetic field, thus allowing their reuse on further photocatalytic cycles. In addition, the versatility of these photomaterials allows their use in the photoinactivation of microorganisms, for water disinfection purposes.
The possibility of combining photodegradation processes with biological treatments is desirable to make the water treatment more cost effective. Biological degradation of a chemical refers to the elimination of the pollutant by the metabolic activity of living organisms, usually microorganisms such as bacteria.
The present work envisages the elimination of endocrine disruptor compounds, such as 17β‐estradiol, estrone, estriol, or 17α‐ethinylestradiol, in the context of water treatment applications.
1.1. Overview: General considerations about water pollution
Water is essential to all forms of life and a fundamental player in environmental health and management. Consequently, the presence of organic pollutants in waste and surface waters represents a major risk for ecosystem sustainability and human health. Environmental recovery and protection are key issues within the current chemical research. New methods for water treatment are required for the implementation of strict regulations, such as the European Water Framework Directive, 2008/105/EC,1 which results of an
increasing awareness of the need to reduce the impact of pollution in the environment. In line with this, green chemistry approaches have been proposed for the development of alternative sustainable technologies, favouring the design of processes that minimize the energetic requirements and the use of hazardous products, while maximizing global efficiency and reuse of materials.
Various types of organic pollutants, such as pesticides, petroleum hydrocarbons, phenols, plasticizers, chlorinated biphenyls, detergents, or pharmaceuticals, among others, have been found in different water bodies.2 Special attention relies on pharmaceuticals,
which are a large and varied class of compounds with diverse properties and applications. In the European Union there are more than 3000 active substances currently available in the market.3 In 1960s and 1970s, some studies reported the incomplete removal at
wastewater treatment plants (WWTPs) of certain pharmaceuticals, which consequently were discharged into environmental waters.4 This problem captured the attention of
researchers during 1990s,5 with the development of analytical techniques able to determine
compound concentrations in the range of a few nanograms per litre.6
The main origins of pharmaceuticals reaching the environment come from patient use in residential areas, discharges from hospitals and other clinical centres which are connected to the sewerage system, and, in some cases, wastewaters from pharmaceutical manufacturing.7 In addition, veterinary pharmaceuticals can be introduced into the
environment from farms and aquaculture. Other pharmaceuticals may be introduced in agricultural land via the application of biosolids to fields.8 There are two main pathways to
release pharmaceuticals into the environment:
▪ Ordinary use of pharmaceuticals. After the uptake of a medicine, a proportion of the active substance passes through the body unchanged.9 The quantity excreted
depends on the kind of medicine and the person being treated for a medical issue. This travels by the sewage system to a WWTP, where can be fully or partially
removed by the treatment process before the effluent is finally discharged into receiving waters.10
▪ Disposal of unused and expired pharmaceuticals. Drugs disposed in this way are in an unmodified form and may therefore contribute disproportionately to environmental contamination.11
Endocrine disrupting compounds (EDCs) are one of the highest research priorities as sources of potential adverse ecological health effects. Despite the low levels of many pharmaceuticals found in the environment, hormonally active chemicals can affect organisms even at low concentrations ranging ng·L-1. In 2002, the World Health
Organization defined an EDC as an exogenous substance or mixture that alters function(s) of the endocrine system and consequently causes adverse health effects in an intact organism, or its progeny, or (sub) populations.12
According to the classification developed by the European Commission in 1999,13
there are two classes of substances which can cause endocrine disruption:
▪ Natural hormones, including estrogens, progesterone and testosterone, which are found naturally in the body of humans and animals, and phytoestrogens, which are substances contained in some plants and may display estrogen-like activity when ingested.
▪ Man-made substances, which include:
– Synthetically-produced hormones, including those hormones which are alike to natural hormones, such as oral contraceptives, hormone replacement therapy and some animal feed additives. They have been designed purposely to modulate and interfere with the endocrine system. – Man-made chemicals designed for use in industry, such as in some industrial cleaning agents; in agriculture, such as in some pesticides; and in consumer goods, such as in some plastic additives. This category also includes chemicals produced as by-products of industrial processes, such as dioxins, which are suspected of interfering with the endocrine systems of humans and wildlife.
Hormones act at extremely low concentrations, being present in plasma at typical concentrations of 1-10 ng·mL-1. Hormones act through high affinity intracellular receptors,
thus very low concentrations of hormone can bind to the receptor population and initiate important biological effects.14
Figure 1.1. Mechanism of action for a steroid hormone.15
Natural estrogens, estrone (E1), 17ß-estradiol (E2), and estriol (E3), and synthetic estrogens, as the contraceptive 17α-ethinylestradiol (EE2) and 3-methyl ether of ethinylestradiol (MeEE2), used as the active ingredient in birth control pills and in other drugs administered during menopause, appear to be the most probable cause of endocrine disruption effects observed in wild fish.16 In addition to the natural origin of E2, the European
Medicines Agency has approved the use of E2 as a pharmaceutical indicated to treat some symptoms of menopause, prevent osteoporosis in postmenopausal women, treat dysmenorrhea and prevent pregnancy, replace estrogen levels in women with ovarian failure or other conditions that cause a lack of natural estrogen in the body, and sometimes is used as part of cancer treatment in women and men.
There is a growing body of scientific research which indicates that EDCs in the environment may interfere with the normal function of the endocrine system of humans and wildlife by mimicking and antagonizing the effect of endogenous hormones, disrupting the synthesis and metabolism of endogenous hormones, or disturbing the synthesis of the specific hormone receptors.17
Estrogens are steroids constituted by 18 carbon atoms, which are distributed in three hexagonal and one pentagonal rings. The different positions of hydroxyl groups in the cyclopentane-phenanthrene nucleus differentiate these molecules. In synthetic estrogens, the addition of ethynyl and methyl groups to E2 forms, respectively, EE2 and MeEE2, which are the molecules used in the formulation of the contraceptive pill (Fig. 1.2).18
a)
b)
Figure 1.2. Molecular structure of a) natural and b) synthetic estrogens.
Estrogens are the primary female sex hormones and play important roles in both reproductive and non-reproductive systems. In humans and animals, estrogens are produced mainly in the ovary, but can also be synthesized in other organs such as the testis, brain, hypothalamus, adipose tissue, and placenta. In the organism, the catabolism of estrogens occurs in the liver, where they are conjugated to sulfate, glucuronide or sulfoglucuronide forms, made up by the substitution of hydroxyl groups of free estrogens. These substitutions may increase estrogen aqueous solubility and facilitate their elimination via urine. However, a fraction of estrogens is eliminated via feces in the unconjugated or free forms.19 Conjugated estrogens display very low estrogenic activity compared to
unconjugated forms (Table 1.1).
Table 1.1. Properties and relative estrogenic activity related to 17β-estradiol of free and conjugated estrogens.18 Compound Molecular weight Water solubility (mg·L-1 at 20 °C) Log KOW Relative estrogenic activity Non-conjugated estrogens E1 270.4 13 3.43 25.4 E2 272.4 13 3.94 100.0 E3 288.4 32 2.81 17.6 EE2 296.4 4.8 4.15 246.0 MeEE2 310.4 0.3 4.67 11.0 Conjugated estrogens ß-E2 3-sulfate 352.4 3.6 2.9 2.6x10⁻² ß-E2 3ß-D-glucuronide 448.4 347 1.46 2.4x10⁻² E1-sulfate 350.4 5.9 0.29 5.0x10⁻³ E1-ß-D-glucuronide 446.4 303 1.9 <1x10⁻³
Conjugated hormones excreted are broken down by intestinal and faecal flora, producing estrogenically active free forms. It can be anticipated that after excretion, conjugated estrogens in urine will follow deconjugation, becoming more hydrophobic, and will be partially eliminated from the liquid fraction by sorption onto solids. Free estrogens eliminated via faeces remain associated to the hydrophobic fraction of this matrix. Estrogen loss by volatilization is insignificant in both cases.20
Humans and animals excrete estrogens, which end up in the environment through sewage discharge and animal waste disposal (Table 2.1).21 Those steroids have been
detected in effluents of WWTPs and surface water.
Table 1.2. Daily excretions (µg) of estrogenic steroids in humans.21
Category E2 E1 E3 EE2 Males 1.6 3.9 1.5 - Menstruating females 3.5 8 4.8 - Menopausal females 2.3 4 1 - Pregnant women 259 600 6000 - Women - - - 35
1.2. Water treatment processes for organic pollutants removal
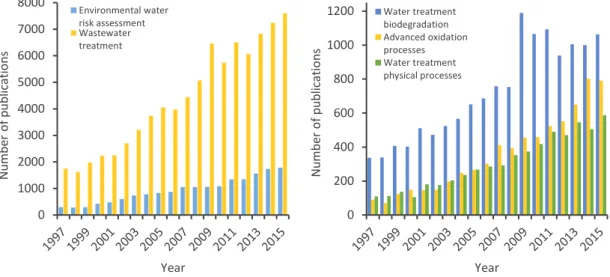
To assess the relevance of water treatment as a research topic in the context of environmental quality, a literature search was performed (Fig. 1.3) using Scopus as a data base of peer-reviewed literature, with the following variables: document type, all; data range, 1997–2015 (included); subject areas, all; and search for, “Environmental water risk assessment” (1782 items in 2015) and “Wastewater treatment” (7612 items in 2015). It is quite evident that in the last 2 decades, the number of studies dealing with these topics has greatly increased. There are different processes for the elimination of organic pollutants from water, grouped according to their nature. To refine the search, these studies were screened by “Water treatment biodegradation” (1064 items in 2015), “Water treatment physical processes” (588 items in 2015), and “Advanced oxidation processes” (791 items in 2015). The following sections will present and discuss the major findings on these topics.
Figure 1.3. Scopus search for relevant publications in the field of water treatment, reported by year.
▪ Physical processes
The sorption elimination is a physical process based on the uptake of pollutants from the aqueous onto a solid phase. Isotherm equations are usually used to obtain insight description and predict the removal of a target compound by sorption onto different sorbents. The affinity of a target compound for a sorbent can be calculated by the specific sorption coefficient, which relates the ratio between the sorbed and the freely dissolved concentrations of the compound at the equilibrium. The application of activated carbon is a well-known physical process used to remove different organic pollutants. Various studies have indicated the efficiency of activated carbon for the removal of trace levels of EDCs in water.22 In 2005, Zhang and Zhou studied the removal of E1 and E2 by sorption onto
activated carbon under different environmental parameters, such as adsorbent concentration, pH, salinity and the presence of humic acid and surfactants. The results showed that adsorption capacity of activated carbon decreased with increasing adsorbent concentration, due to the presence of colloids, which may bind to the EDCs. The presence of surfactants and humic acids resulted in a reduction of the adsorption constant, which can be explained by the ability of surfactants to enhance the solubility of pollutants in water and the ability of humic acids in complexing with pollutants.23
The membrane filtration is another physical approach. It is defined as the separation process based on the difference in physical or chemical properties of two phases separated by a semi-permeable membrane. This membrane operates as a separation barrier, through
0 1000 2000 3000 4000 5000 6000 7000 8000 N u mb er o f p u b lic ati o n s Year Environmental water risk assessment Wastewater treatment 0 200 400 600 800 1000 1200 N u mb er o f p u b lic ati o n s Year Water treatment biodegradation Advanced oxidation processes Water treatment physical processes
which certain substances can pass, while others are retained. Membrane processes are acquiring wide use for estrogens removal in wastewater treatment.24
One major drawback of physical process, specifically when dealing with toxic compounds, is that it based on the accumulation and exchange of the pollutants from the aqueous to the adsorbent phase. Therefore, pollutants are not actually destroyed, but just transferred between different phases.
▪ Biological processes
The biological approach for water treatment is based on the natural role of microorganisms in the elemental cycles, such as the C, N and P cycles, which is related to their biodegradation capacity.25 Accordingly, biodegradation is the mechanism by which
microbial organisms transform, through metabolic routes or enzymatic action, the structure of chemicals present into the medium.26 Many factors may induce microorganisms to use
pollutants as substrates or cometabolize them, such as their genetic potential, temperature, pH, and available nitrogen and phosphorus sources. These conditions determine the rate and the extent of the pollutant degradation.27
Some microorganisms have the naturally-occurring metabolic diversity to degrade, transform or accumulate a huge range of compounds including hydrocarbons, polychlorinated biphenyls, polyaromatic hydrocarbons, radionuclides and metals.28 Several
studies have demonstrated that both heterotrophic and autotrophic aquatic microorganisms can degrade estrogens, and that some of them can transform estrogens into non-estrogenic compounds.4b, 29 The mechanisms of biodegradation of estrogens in WWTPs reported in
the literature also include sorption to biosolids30 and sludge.26, 31
▪ Advanced oxidation processes
Generally, organic pollutants present in water media can be degraded by direct photolysis to variable degrees, depending on their chemical structure. The presence of aromatic rings and conjugated π-systems, as well as certain functional groups and heteroatoms, may increase the direct absorption of sunlight. Such structures produce absorption spectral bands in the UVC wavelength range (280-100 nm), with tailing absorption into the UVB (315-280 nm) and in some cases UVA ranges (400-315 nm). The potential spectral overlap with natural sunlight (λ > 290 nm) suggests that these organic pollutants may degrade, at least partially, by direct photolysis.32
Organic pollutants in water can also be degraded by indirect photolysis. Advanced oxidation processes (AOPs) refer specifically to processes in which the oxidation of
compounds occurs primarily through reactions with reactive oxygen species (ROS), such as radicals and singlet oxygen (1O
2).33 These processes comprise two phases: the formation
of ROS under irradiation, and the reaction of these species with the target pollutants. AOPs are considered as effective water treatment techniques for removing organic pollutants which, due to their high chemical stability and/or low biodegradability, are not treatable by ordinary approaches.34 In the last decade, the photocatalytic degradation of various toxic
organic compounds has been analysed35
Semiconductor photocatalysis is one of the most effective AOP technology for the destruction of pollutants in water. In the last two decades, TiO2 has received considerable
interest as a semiconductor photocatalyst due to its photochemical stability, non-toxic nature and low cost.36 However, the efficiency of the use of TiO
2 is limited by its relatively
large band gap energy, which corresponds to the wavelength of 370 nm, where only ca. 3-5% of the solar energy is overlapped and therefore effective. The high recombination rate of electron-hole pairs formed during the photocatalytic process is also a disadvantage of this technology.37 The use of solar energy in photosensitized applications for water
treatment emerges as an affordable approach to a difficult environmental problem.
As previously stated, organic pollutants under solar irradiation in environmental waters can be subjected to direct photolysis. Upon a photon absorption by the pollutant, the excited form will undergo a chemical transformation, thus generating one or more different product species. However, depending on different environmental conditions, such as fluence rate (total number of particles crossing over a sphere of unit cross section which surrounds a point source of radiation) of the solar irradiation, water turbidity, pH of the media, presence of natural organic matter, salinity, biological activity or oxygen content, the degradation of the pollutant can be significantly delayed or inhibited.38 Photodegradation of
pollutants in water may also occur by indirect photolysis, by means of other substances present in water able to absorb solar irradiation and subsequently generate ROS, mainly
1O
2 and hydroxyl (HO•), peroxyl (ROO•) and superoxide anion (O2-•) radicals.39 The
photocatalytic treatment for water remediation is especially convenient because it may achieve the mineralization of the organic pollutant (in particular when high doses of light are applied), which minimizes the release of potential hazardous degradation products,40 in
addition to the possibility of using sunlight as energy source.41 This methodology requires
light of an appropriate wavelength, a photocatalyst or photosensitizer (PS) capable of absorbing that light, and molecular oxygen and/or an appropriate substrate (Fig. 1.4). The excitation of the PS is generally achieved via one photon absorption (hʋ), originating an electron transition between the ground state, S0, and the singlet excited state, S1*.