CERN-PH-EP/2015-240 2016/08/01
CMS-TOP-12-041
Measurement of tt production with additional jet activity,
including b quark jets, in the dilepton decay channel using
pp collisions at
√
s
=
8 TeV
The CMS Collaboration
∗Abstract
Jet multiplicity distributions in top quark pair (tt) events are measured in pp colli-sions at a centre-of-mass energy of 8 TeV with the CMS detector at the LHC using a data set corresponding to an integrated luminosity of 19.7 fb−1. The measurement is performed in the dilepton decay channels (e+e−, µ+µ−, and e±µ∓). The absolute and normalized differential cross sections for tt production are measured as a function of the jet multiplicity in the event for different jet transverse momentum thresholds and the kinematic properties of the leading additional jets. The differential ttb and ttbb cross sections are presented for the first time as a function of the kinematic properties of the leading additional b jets. Furthermore, the fraction of events without additional jets above a threshold is measured as a function of the transverse momenta of the leading additional jets and the scalar sum of the transverse momenta of all additional jets. The data are compared and found to be consistent with predictions from several perturbative quantum chromodynamics event generators and a next-to-leading order calculation.
Published in the European Physical Journal C as doi:10.1140/epjc/s10052-016-4105-x.
c
2016 CERN for the benefit of the CMS Collaboration. CC-BY-3.0 license
∗See Appendix D for the list of collaboration members
1
Introduction
Precise measurements of tt production and decay properties [1–9] provide crucial information for testing the expectations of the standard model (SM) and specifically of calculations in the framework of perturbative quantum chromodynamics (QCD) at high-energy scales. At the energies of the CERN LHC, about half of the tt events contain jets with transverse momentum (pT) larger than 30 GeV that do not come from the weak decay of the tt system [5]. In this paper,
these jets will be referred to as “additional jets” and the events as “tt+jets”. The additional jets typically arise from initial-state QCD radiation, and their study provides an essential test of the validity and completeness of higher-order QCD calculations describing the processes leading to multijet events.
A correct description of these events is also relevant because tt+jets processes constitute impor-tant backgrounds in the searches for new physics. These processes also constitute a challenging background in the attempt to observe the production of a Higgs boson in association with a tt pair (ttH), where the Higgs boson decays to a bottom (b) quark pair (bb), because of the much larger cross section compared to the ttH signal. Such a process has an irreducible nonresonant background from tt pair production in association with a bb pair from gluon splitting. There-fore, measurements of tt+jets and ttbb production can give important information about the main background in the search for the ttH process and provide a good test of next-to-leading-order (NLO) QCD calculations.
Here, we present a detailed study of the production of tt events with additional jets and b quark jets in the final state from pp collisions at √s = 8 TeV using the data recorded in 2012 with the CMS detector, corresponding to an integrated luminosity of 19.7 fb−1. The tt pairs are reconstructed in the dilepton decay channel with two oppositely charged isolated leptons (electrons or muons) and at least two jets. The analysis follows, to a large extent, the strategy used in the measurement of normalized tt differential cross sections in the same decay channel described in Ref. [8].
The measurements of the absolute and normalized differential tt cross sections are performed as a function of the jet multiplicity for different pT thresholds for the jets, in order to probe
the momentum dependence of the hard-gluon emission. The results are presented in a visible phase space in which all selected final-state objects are produced within the detector acceptance and are thus measurable experimentally. The study extends the previous measurement at√s=
7 TeV [5], where only normalized differential cross sections were presented.
The absolute and normalized tt+jets production cross sections are also measured as a function of the pT and pseudorapidity (η) [10] of the leading additional jets, ordered by pT. The CMS
experiment has previously published a measurement of the inclusive ttbb production cross section [11]. In the present analysis, the ttbb and ttb (referred to as “ttbb (ttb)” in the following) cross sections are measured for the first time differentially as a function of the properties of the additional jets associated with b quarks, which will hereafter be called b jets. The ttbb process corresponds to events where two additional b jets are generated in the visible phase space, while ttb represents the same physical process, where only one additional b jet is within the acceptance requirements. In cases with at least two additional jets or two b jets, the cross section is also measured as a function of the angular distance between the two jets and their dijet invariant mass. The results are reported both in the visible phase space and extrapolated to the full phase space of the tt system to facilitate the comparison with theoretical calculations. Finally, the fraction of events that do not contain additional jets (gap fraction) is determined as a function of the threshold on the leading and subleading additional-jet pT, and the scalar sum
2 3 Event simulation and theoretical predictions
of all additional-jet pT. This was first measured in Refs. [5] and [12].
The results are compared at particle level to theoretical predictions obtained with four different event generators: MADGRAPH[13], MC@NLO[14], POWHEG[15], and MG5 AMC@NLO [16],
interfaced with eitherPYTHIA[17] orHERWIG[18], and in the case ofPOWHEGwith both. Addi-tionally, the measurements as a function of the b jet quantities are compared to the predictions from the event generator POWHEL[19].
This paper is structured as follows. A brief description of the CMS detector is provided in Section 2. Details of the event simulation generators and their theoretical predictions are given in Section 3. The event selection and the method used to identify the additional radiation in the event for both tt+jets and ttbb (ttb) studies are presented in Sections 4 and 5. The cross section measurement and the systematic uncertainties are described in Sections 6 and 7. The results as a function of the jet multiplicity and the kinematic properties of the additional jets and b jets are presented in Sections 8–10. The definition of the gap fraction and the results are described in Section 11. Finally, a summary is given in Section 12.
2
The CMS detector
The central feature of the CMS apparatus is a superconducting solenoid of 6 m internal diame-ter, providing a magnetic field of 3.8 T. Within the solenoid volume are a silicon pixel and strip tracker, a lead tungstate crystal electromagnetic calorimeter (ECAL), and a brass and scintilla-tor hadron calorimeter, each composed of a barrel and two endcap sections. Extensive forward calorimetry complements the coverage provided by the barrel and endcap detectors. Muons are measured in gas-ionization detectors embedded in the steel flux-return yoke outside the solenoid. A more detailed description of the CMS detector, together with a definition of the coordinate system used and the relevant kinematic variables, can be found in Ref. [10].
3
Event simulation and theoretical predictions
Experimental effects coming from event reconstruction, selection criteria, and detector resolu-tion are modelled using Monte Carlo (MC) event generators interfaced with a detailed simula-tion of the CMS detector response using GEANT4 (v. 9.4) [20].
The MADGRAPH(v. 5.1.5.11) [13] generator calculates the matrix elements at tree level up to
a given order in αs. In particular, the simulated tt sample used in this analysis is generated
with up to three additional partons. The MADSPIN [21] package is used to incorporate spin correlations of the top quark decay products. The value of the top quark mass is chosen to be mt = 172.5 GeV, and the proton structure is described by the CTEQ6L1 [22] set of parton
distribution functions (PDF). The generated events are subsequently processed with PYTHIA
(v. 6.426) [17] for fragmentation and hadronization, using the MLM prescription for the match-ing of higher-multiplicity matrix element calculations with parton showers [23]. The PYTHIA
parameters for the underlying event, parton shower, and hadronization are set according to the Z2* tune, which is derived from the Z1 tune [24]. The Z1 tune uses the CTEQ5L PDFs, whereas Z2* adopts CTEQ6L.
In addition to the nominal tt MADGRAPHsample, dedicated samples are generated by vary-ing the central value of the renormalization (µR) and factorization (µF) scales and the matrix
element/parton showering matching scale (jet-parton matching scale). These samples are pro-duced to determine the systematic uncertainties in the measurement owing to the theoreti-cal assumptions on the modelling of tt events, as well as for comparisons with the measured
distributions. The nominal values of µR and µF are defined by the Q2 scale in the event: µ2R = µ2F = Q2 = m2t +∑ p2T(jet), where the sum runs over all the additional jets in the event not coming from the tt decay. The samples with the varied scales use µ2R = µ2F = 4Q2 and Q2/4, respectively. For the nominal MADGRAPHsample, a jet-parton matching scale of 40 GeV
is chosen, while for the varied samples, values of 60 and 30 GeV are employed, respectively. These scales correspond to jet-parton matching thresholds of 20 GeV for the nominal sample, and 40 and 10 GeV for the varied ones.
The POWHEG (v. 1.0 r1380) and MC@NLO (v. 3.41) generators, along with the CT10 [25] and
CTEQ6M [22] PDFs, are used, respectively, for comparisons with the data. ThePOWHEG gen-erator simulates calculations of tt production to full NLO accuracy, and is matched with two parton shower MC generators: the PYTHIA (v. 6.426) Z2* tune (designated asPYTHIA6 in the
following), and theHERWIG[18] (v. 6.520) AUET2 tune [26] (referred to asHERWIG6 in the fol-lowing). The parton showering in PYTHIA is based on a transverse-momentum ordering of parton showers, whereasHERWIGuses angular ordering. TheMC@NLOgenerator implements the hard matrix element to full NLO accuracy, matched withHERWIG(v. 6.520) for the initial-and final-state parton showers using the default tune. These two generators, POWHEG and
MC@NLO, are formally equivalent up to the NLO accuracy, but they differ in the techniques used to avoid double counting of radiative corrections that may arise from interfacing with the parton showering generators.
The cross section as a function of jet multiplicity and the gap fraction measurements are com-pared to the NLO predictions of thePOWHEG(v2) [15] and MG5 AMC@NLO [16] generators.
ThePOWHEG(v2) generator is matched to thePYTHIA(v. 8.205) CUETP8M1 tune [27] (referred
to asPYTHIA8),HERWIG6, andPYTHIA6. In these samples theHDAMPparameter ofPOWHEG
-BOX, which controls the matrix element and parton shower matching and effectively regulates the high-pT radiation, is set to mt = 172.5 GeV. The MG5 AMC@NLO generator simulates
tt events with up to two additional partons at NLO, and is matched to the PYTHIA8 parton
shower simulation using the FXFXmerging prescription [28]. The top quark mass value used
in all these simulations is also 172.5 GeV and the PDF set is NNPDF3.0 [29]. In addition, a tt MADGRAPHsample matched toPYTHIA8 for the parton showering and hadronization is used for comparisons with the data.
The ttbb production cross sections are also compared with the predictions by the generator POWHEL[19] (HELAC-NLO [30] +POWHEGBOX[31]), which implements the full ttbb process
at NLO QCD accuracy, with parton shower matching based on the POWHEG NLO matching
algorithm [15, 32]. The events are further hadronized by means of PYTHIA (v. 6.428), using
parameters of the Perugia 2011 C tune [33]. In the generation of the events, the renormalization and factorization scales are fixed to µR = µF = HT/4, where HT is the sum of the transverse
energies of the final-state partons (t, t, b, b) from the underlying tree-level process, and the CT10 PDFs are used.
The SM background samples are simulated with MADGRAPH, POWHEG, orPYTHIA,
depend-ing on the process. The MADGRAPH generator is used to simulate Z/γ∗ production (referred
to as Drell–Yan, DY, in the following), tt production in association with an additional boson (referred to as tt+Z, tt+W, and tt+γ), and W boson production with additional jets (W+jets in the following). Single top quark events (tW channel) are simulated using POWHEG. Diboson (WW, WZ, and ZZ) and QCD multijet events are simulated usingPYTHIA. For the ttb and ttbb measurements, the expected contribution from SM ttH processes, simulated with PYTHIA, is also considered, although the final state has not yet been observed.
nor-4 4 Event reconstruction and selection
malized to an integrated luminosity of 19.7 fb−1 according to their predicted cross sections. These are taken from next-to-next-to-leading-order (NNLO) (W+jets [34] and DY [35]), NLO + next-to-next-to-leading logarithmic (NNLL) (single top quark tW channel [36]), NLO (di-boson [37], tt+Z [38], tt+W [38], and tt+H [39]), and leading-order (LO) (QCD multijet [17]) calculations. The contribution of QCD multijet events is found to be negligible.The predicted cross section for the tt+γ sample is obtained by scaling the LO cross section obtained with the
WHIZARDevent generator [40] by an NLO/LO K-factor correction [41]. The tt simulated
sam-ple is normalized to the total cross section σtt = 252.9 ± 6.4
8.6(scale)±11.7(PDF+αs)pb,
calcu-lated with the TOP++2.0 program to NNLO in perturbative QCD, including soft-gluon resum-mation to NNLL order [42], and assuming mt = 172.5 GeV. The first uncertainty comes from
the independent variation of the factorization and renormalization scales, µRand µF, while the
second one is associated with variations in the PDF and αs, following the PDF4LHC
prescrip-tion with the MSTW2008 68% confidence level (CL) NNLO, CT10 NNLO, and NNPDF2.3 5f FFN PDF sets (see Refs. [43, 44] and references therein and Refs. [45–47]).
A number of additional pp simulated hadronic interactions (“pileup”) are added to each simu-lated event to reproduce the multiple interactions in each bunch crossing from the luminosity conditions in the real data taking. Correction factors for detector effects (described in Sections 4 and 6) are applied, when needed, to improve the description of the data by the simulation.
4
Event reconstruction and selection
The event selection is based on the decay topology of the tt events, where each top quark decays into a W boson and a b quark. Only the cases in which both W bosons decayed to a charged lepton and a neutrino are considered. These signatures imply the presence of isolated leptons, missing transverse momentum owing to the neutrinos from W boson decays, and highly ener-getic jets. The heavy-quark content of the jets is identified through b tagging techniques. The same requirements are applied to select the events for the different measurements, with the exception of the requirements on the b jets, which have been optimized independently for the tt+jets and ttbb (ttb) cases. The description of the event reconstruction and selection is detailed in the following.
Events are reconstructed using a particle-flow (PF) algorithm, in which signals from all sub-detectors are combined [48, 49]. Charged particles are required to originate from the primary collision vertex [50], defined as the vertex with the highest sum of p2
Tof all reconstructed tracks
associated with it. Therefore, charged-hadron candidates from pileup events, i.e. originating from additional pp interactions within the same bunch crossing, are removed before jet cluster-ing on an event-by-event basis. Subsequently, the remaincluster-ing neutral-particle component from pileup events is accounted for through jet energy corrections [51].
Muon candidates are reconstructed from tracks that can be linked between the silicon tracker and the muon system [52]. The muons are required to have pT > 20 GeV, be within|η| < 2.4, and have a relative isolation Irel < 0.15. The parameter Irelis defined as the sum of the pT of
all neutral and charged reconstructed PF candidates, except the muon itself, inside a cone of ∆R ≡ √(∆η)2+ (∆φ)2 < 0.3 around the muon direction, divided by the muon p
T, where∆η
and∆φ are the difference in pseudorapidity and azimuthal angle between the directions of the candidate and the muon, respectively. Electron candidates are identified by combining infor-mation from charged-track trajectories and energy deposition measurements in the ECAL [53], and are required to be within|η| <2.4, have a transverse energy of at least 20 GeV, and fulfill Irel<0.15 inside a cone of∆R<0.3. Electrons from identified photon conversions are rejected.
The lepton identification and isolation efficiencies are determined via a tag-and-probe method using Z boson events.
Jets are reconstructed by clustering the PF candidates, using the anti-kTclustering algorithm [54,
55] with a distance parameter of 0.5. The jet momentum is determined as the vectorial sum of all particle momenta in the jet, and is found in the simulation to be within 5 to 10% of the true momentum over the entire pT range and detector acceptance. Jet energy corrections are
derived from the simulation, and are confirmed with in situ measurements with the energy balance of dijet and photon+jet events [56]. The jet energy resolution amounts typically to 15% at 10 GeV and 8% at 100 GeV. Muons and electrons passing less stringent requirements com-pared to the ones mentioned above are identified and excluded from the clustering process. Jets are selected in the interval|η| < 2.4 and with pT > 20 GeV. Additionally, the jets
iden-tified as part of the decay products of the tt system (cf. Section 5) must fulfill pT > 30 GeV.
Jets originating from the hadronization of b quarks are identified using a combined secondary vertex algorithm (CSV) [57], which provides a b tagging discriminant by combining identified secondary vertices and track-based lifetime information.
The missing transverse energy (E/ ) is defined as the magnitude of the projection on the planeT
perpendicular to the beams of the negative vector sum of the momenta of all reconstructed par-ticles in an event [58]. To mitigate the effect of contributions from pileup on the E/ resolution,T
we use a multivariate correction where the measured momentum is separated into components that originate from the primary and the other collision vertices [59]. This correction improves the E/ resolution byT ≈5%.
Events are triggered by requiring combinations of two leptons (` = e or µ), where one fulfills a pT threshold of 17 GeV and the other of 8 GeV, irrespective of the flavour of the leptons. The
dilepton trigger efficiencies are measured using samples selected with triggers that require a minimum E/ or number of jets in the event, and are only weakly correlated to the dileptonT
triggers used in the analysis.
Events are selected if there are at least two isolated leptons of opposite charge. Events with a lepton pair invariant mass less than 20 GeV are removed to suppress events from heavy-flavour resonance decays, QCD multijet, and DY production. In the µµ and ee channels, the dilepton invariant mass is required to be outside a Z boson mass window of 91±15 GeV, and E/ isT
required to be larger than 40 GeV.
For the tt+jets selection, a minimum of two jets is required, of which at least one must be tagged as a b jet. A loose CSV discriminator value is chosen such that the efficiency for tagging jets from b (c) quarks is ≈85% (40%), while the probability of tagging jets originating from light quarks (u, d, or s) or gluons is around 10%. Efficiency corrections, depending on jet pT and η,
are applied to account for differences in the performance of the b tagging algorithm between data and simulation.
For the ttbb (ttb) selection, at least three b-tagged jets are required (without further require-ments on the minimum number of jets). In this case, a tighter discriminator value [57] is chosen to increase the purity of the sample. The efficiency of this working point is approximately 70% (20%) for jets originating from a b (c) quark, while the misidentification rate for light-quark and gluon jets is around 1%. The shape of the CSV discriminant distribution in simulation is corrected to better describe the efficiency observed in the data. This correction is derived separately for light-flavour and b jets from a tag-and-probe approach using control samples enriched in events with a Z boson and exactly two jets, and tt events in the eµ channel with no additional jets [60].
6 5 Identification of additional radiation in the event
5
Identification of additional radiation in the event
To study additional jet activity in the data, the identification of jets arising from the decay of the tt system is crucial. In particular, we need to identify correctly the two b jets from the top quark decays in events with more than two b jets. This is achieved by following two independent but complementary approaches: a kinematic reconstruction [61] and a multivariate analysis, optimized for the two cases under study, tt+jets and ttbb (ttb), respectively. The purpose of the kinematic reconstruction is to completely reconstruct the tt system based on E/ and theT
information on identified jets and leptons, taking into account detector resolution effects. This method is optimized for the case where the b jets in the event only arise from the decay of the top quark pair. The multivariate approach is optimized for events with more b jets than just those from the tt system. This method identifies the two jets that most likely originated from the top quark decays, and the additional b jets, but does not perform a full reconstruction of the tt system. Both methods are described in the following sections.
5.1 Kinematic reconstruction in tt+jets events
The kinematic reconstruction method was developed and used for the first time in the analysis from Ref. [8]. In this method the following constraints are imposed: E/ is assumed to originateT
solely from the two neutrinos; the W boson invariant mass is fixed to 80.4 GeV [62]; and the top quark and antiquark masses are fixed to a value of 172.5 GeV. Each pair of jets and lepton-jet combination fulfilling the selection criteria is considered in the kinematic reconstruction. Effects of detector resolution are accounted for by randomly smearing the measured energies and directions of the reconstructed lepton and b jet candidates by their resolutions. These are determined from the simulation of signal events by comparing the reconstructed b jets and leptons matched to the generated b quarks and leptons from top quark decays. For a given smearing, the solution of the equations for the neutrino momenta yielding the smallest invariant mass of the tt system is chosen. For each solution, a weight is calculated based on the expected invariant mass spectrum of the lepton and b jet from the top quark decays at the parton level. The weights are summed over 100 randomly smeared reconstruction attempts, and the kinematics of the top quark and antiquark are calculated as a weighted average. Finally, the two jets and lepton-jet combinations that yield the maximum sum of weights are chosen for further analysis. Combinations with two tagged jets are chosen over those with a single b-tagged jet. The efficiency of the kinematic reconstruction, defined as the number of events with a solution divided by the total number of selected tt+jets events, is approximately 94%. The efficiency in simulation is similar to the one in data for all jet multiplicities. Events with no valid solution for the neutrino momenta are excluded from further analysis. In events with additional jets, the algorithm correctly identifies the two jets coming from the tt decay in about 70% of the cases.
After the full event selection is applied, the dominant background in the eµ channel originates from other tt decay channels and is estimated using simulation. This contribution corresponds mostly to leptonic τ decays, which are considered background in the tt+jets measurements. In the ee and µµ channels, the dominant background contribution arises from Z/γ∗+jets produc-tion. The normalization of this background contribution is derived from data using the events rejected by the Z boson veto, scaled by the ratio of events failing and passing this selection, estimated from simulation [63]. The remaining backgrounds, including the single top quark tW channel, W+jets, diboson, and QCD multijet events, are estimated from simulation for all the channels.
pT thresholds and compared to SM predictions. In this figure and the following ones, the tt
sample is simulated using MADGRAPH+PYTHIA6, where only tt events with two leptons (e or µ) from the W boson decay are considered as signal. All other tt events, specifically those originating from decays via τ leptons, which are the dominant contribution, are considered as background. In the following figures, “Electroweak” corresponds to DY, W+jets, and diboson processes, and “tt bkg.” includes the tt+γ/W/Z events. The data are well described by the simulation, both for the low jet pT threshold of 30 GeV and the higher thresholds of 60 and
100 GeV. The hatched regions in Figs. 1– 3 correspond to the uncertainties affecting the shape of the simulated signal and background events (cf. Section 6), and are dominated by modelling uncertainties in the former.
Events 1 10 2 10 3 10 4 10 5 10 6 10 7 10 ( 8 TeV) -1 19.7 fb CMS > 30 GeV T p Data signal t t bkg. t t Single t Electroweak Uncertainty jets N 2 3 4 5 ≥ 6 MC Data 0.6 0.8 1 1.2 1.4 Events 1 10 2 10 3 10 4 10 5 10 6 10 7 10 ( 8 TeV) -1 19.7 fb CMS > 60 GeV T p Data signal t t bkg. t t Single t Electroweak Uncertainty jets N 0 1 2 3 4 ≥ 5 MC Data 0.6 0.8 1 1.2 1.4 Events 1 10 2 10 3 10 4 10 5 10 6 10 7 10 ( 8 TeV) -1 19.7 fb CMS > 100 GeV T p Data signal t t bkg. t t Single t Electroweak Uncertainty jets N 0 1 2 3 ≥ 4 MC Data 0.6 0.8 1 1.2 1.4
Figure 1: Reconstructed jet multiplicity distribution after event selection in data (points) and from signal and background simulation (histograms) for all jets with pT of at least 30 GeV
(top), 60 GeV (bottom left), and 100 GeV (bottom right). The hatched regions correspond to the uncertainties affecting the shape of the distributions in the simulated signal tt events and backgrounds (cf. Section 6). The lower plots show the ratio of the data to the MC simulation prediction. Note that in all cases the event selection requires at least two jets with pT >30 GeV.
Additional jets in the event are defined as those jets within the phase space described in the event selection (cf. Section 4) that are not identified by the kinematic reconstruction to be part of the tt system. The η and pT distributions of the additional jets with the largest and second
largest pTin the event (referred to as the leading and subleading additional jets in the following)
8 5 Identification of additional radiation in the event
all additional jets, HT, the invariant mass of the leading and subleading additional jets, mjj, and
their angular separation,∆Rjj= √
(∆η)2+ (∆φ)2, where∆η and ∆φ are the pseudorapidity and
azimuthal differences between the directions of the two jets. These distributions are shown in Fig. 3. The predictions from the simulation, also shown in the figures, describe the data within the uncertainties. Events / 0.4 1000 2000 3000 4000 5000 6000 ( 8 TeV) -1 19.7 fb
CMS Data MARTINGOERNER
GOERNER MARTIN signal t t GOERNER MARTIN bkg. t t GOERNER MARTIN Single t GOERNER MARTIN Electroweak Uncertainty η
Leading add. jet
-2 -1 0 1 2 MC Data 0.6 0.8 1 1.2 1.4 Events / 20 GeV 1 10 2 10 3 10 4 10 5 10 ( 8 TeV) -1 19.7 fb
CMS Data MARTINGOERNER
GOERNER MARTIN signal t t GOERNER MARTIN bkg. t t GOERNER MARTIN Single t GOERNER MARTIN Electroweak Uncertainty GeV T
Leading add. jet p
50 100 150 200 250 300 350 400 MC Data 0.6 0.8 1 1.2 1.4 Events / 0.4 0 500 1000 1500 2000 2500 3000 ( 8 TeV) -1 19.7 fb
CMS Data MARTINGOERNER
GOERNER MARTIN signal t t GOERNER MARTIN bkg. t t GOERNER MARTIN Single t GOERNER MARTIN Electroweak Uncertainty η
Subleading add. jet
-2 -1 0 1 2 MC Data 0.6 0.8 1 1.2 1.4 Events / 20 GeV 1 10 2 10 3 10 4 10 5 10 ( 8 TeV) -1 19.7 fb
CMS Data MARTINGOERNER
GOERNER MARTIN signal t t GOERNER MARTIN bkg. t t GOERNER MARTIN Single t GOERNER MARTIN Electroweak Uncertainty GeV T
Subleading add. jet p
20 40 60 80 100 120 140 160 180 200 MC Data 0.6 0.8 1 1.2 1.4
Figure 2: Distribution of the η (left) and pT (right) of the leading (top row) and subleading
(bottom row) additional reconstructed jets in data (points) and from signal and background simulation (histograms). The hatched regions correspond to the uncertainties affecting the shape of the simulated distributions in the signal tt events and backgrounds (cf. Section 6). The lower plots show the ratio of the data to the MC simulation prediction.
5.2 Identification of tt jets and additional jets in ttbb events
The multivariate approach uses a boosted decision tree (BDT) to distinguish the b jets stemming from the tt system from those arising from additional radiation for final states with more than two b jets. This method is optimized for ttbb topologies in the dilepton final state of the tt system. The BDT is set up using the TMVA package [64]. To avoid any dependence on the kinematics of the additional jets, and especially on the invariant mass of the two additional jets, the method identifies the jets stemming from the tt system by making use of properties of the tt system that are expected to be mostly insensitive to the additional radiation. The variables combine information from the two final-state leptons, the jets, and E/ . All possibleT
Events / 40 GeV 10 2 10 3 10 4 10 ( 8 TeV) -1 19.7 fb
CMS Data MARTINGOERNER
GOERNER MARTIN signal t t GOERNER MARTIN bkg. t t GOERNER MARTIN Single t GOERNER MARTIN Electroweak Uncertainty GeV T H 0 100 200 300 400 500 600 MC Data 0.6 0.8 1 1.2 1.4 Events / 20 GeV 0 500 1000 1500 2000 2500 3000 3500 4000 ( 8 TeV) -1 19.7 fb
CMS Data MARTINGOERNER
GOERNER MARTIN signal t t GOERNER MARTIN bkg. t t GOERNER MARTIN Single t GOERNER MARTIN Electroweak Uncertainty GeV jj m 0 50 100 150 200 250 300 350 400 MC Data 0.6 0.8 1 1.2 1.4 Events / 0.4 0 1000 2000 3000 4000 5000 ( 8 TeV) -1 19.7 fb
CMS Data MARTINGOERNER
GOERNER MARTIN signal t t GOERNER MARTIN bkg. t t GOERNER MARTIN Single t GOERNER MARTIN Electroweak Uncertainty jj R ∆ 0.5 1 1.5 2 2.5 3 3.5 4 4.5 5 MC Data 0.6 0.8 1 1.2 1.4
Figure 3: Distribution of the scalar sum of the pT of all additional jets HT (top), the invariant
mass of the leading and subleading additional jets mjj(bottom left), and their angular distance
∆Rjj(bottom right) in data (points) and from signal and background simulation (histograms).
The hatched regions correspond to the uncertainties affecting the shape of the distributions in the simulated signal tt events and backgrounds (cf. Section 6). The lower plots show the ratio of the data to the MC simulation prediction.
10 5 Identification of additional radiation in the event
jet and the other to the b jet. This assignment is needed to define the variables used in the BDT and is based on the measurement of the charge of each jet, which is calculated from the charge and the momenta of the PF constituents used in the jet clustering. The jet in the pair with the largest charge is assigned to the b, while the other jet is assigned to the b. The efficiency of this jet charge pairing is defined as the fraction of events where the assigned b and b are correctly matched to the corresponding generated b and b jets, and amounts to 68%.
A total of twelve variables are included in the BDT. Some examples of the variables used are: the sum and difference of the invariant mass of the b`+ and b`− systems, mb`+ ±mb`−; the absolute difference in the azimuthal angle between them,|∆φb`+,b`−
|; the pTof the b`+and b`−
systems, pb`+
T and pb `−
T ; and the difference between the invariant mass of the two b jets and two
leptons and the invariant mass of the bb pair, mbb`+`−−mbb. The complete list of variables can be found in Appendix A. The main challenge with this method is the large number of possible jet assignments, given four genuine b jets and potential extra jets from additional radiation in each event. The basic methodology is to use the BDT discriminant value of each dijet com-bination as a measure of the probability that the comcom-bination stems from the tt system. The jets from the tt system are then identified as the pair with the highest BDT discriminant. From the remaining jets, those b-tagged jets with the highest pT are selected as being the leading
additional ones.
The BDT training is performed on a large and statistically independent sample of simulated ttH events with the Higgs boson mass varied over the range 110–140 GeV. The ttbb events are not included in the training to avoid the risk of overtraining owing to the limited number of events in the available simulated samples. The simulated ttH(bb)sample is suited for this purpose since the four b jets from the decay of the tt system and the Higgs boson have similar kinematic distributions. Since it is significantly harder to identify the jets from the tt system in ttH events than in ttbb events, where the additional b jets arise from initial- or final-state radiation, a good BDT performance with ttH events implies also a good identification in ttbb events. The distributions of the BDT discriminant in data and simulation are shown in Fig. 4 for all dijet combinations in an event, and for the combination with the highest weight that is assigned to the tt system. The subset “Minor bkg.” includes all non-tt processes and tt+Z/W/γ events. There is good agreement between the data and simulation distributions within the statistical uncertainties.
The number of simulated events with correct assignments for the additional b jets in ttH events relative to the total number of events where those jets are selected and matched to the corre-sponding generator jets, is approximately 34%. In ttbb events, this fraction is about 40%. This efficiency is high enough to allow the measurement of the tt cross section as a function of the kinematic variables of the additional b jets (the probability of selecting the correct assignments by choosing random combinations of jets is 17% in events with four jets and 10% in events with five jets). The relative increase in efficiency with respect to the use of the kinematic reconstruc-tion for ttbb is about 15%. Addireconstruc-tionally, the BDT approach improves the correlareconstruc-tion between the generated and reconstructed variables, especially for the distribution of the invariant mass of the two leading additional b jets mbband their angular separation∆Rbb=
√
(∆η)2+ (∆φ)2, where∆η and ∆φ are the pseudorapidity and azimuthal differences between the directions of the two b jets.
The expected fraction of events with additional b jets is not properly modelled in the simula-tion, in agreement with the observation of a previous CMS measurement [11]. This discrepancy between the MADGRAPH+PYTHIAsimulation and data can be seen in the b jet multiplicity dis-tribution, as shown in Fig. 5.
Jet pairs / 0.07 0 20 40 60 80 100 120 140 160 180 200 220 ( 8 TeV) -1 19.7 fb CMS Data ttbb b t t tt2b other t t ttH Minor bkg. Uncertainty BDT discriminant -1 -0.8 -0.6 -0.4 -0.2 0 MC Data 0.5 1 1.5 Events / 0.07 0 5 10 15 20 25 30 35 ( 8 TeV) -1 19.7 fb CMS Data ttbb b t t tt2b other t t ttH Minor bkg. Uncertainty Maximum BDT discriminant -0.7 -0.6 -0.5 -0.4 -0.3 -0.2 -0.1 0 MC Data 0.5 1 1.5
Figure 4: The BDT discriminant of all dijet combinations in data (points) and from signal and background simulation (histograms) per event (left) and dijet combination with the highest discriminant per event (right) in events with at least four jets and exactly four b-tagged jets. The distributions include the correction obtained with the template fit to the b-tagged jet mul-tiplicity (cf. Section 5.2). The hatched area represents the statistical uncertainty in the simulated samples. “Minor bkg.” includes all non-tt processes and tt+Z/W/γ. The lower plots show the ratio of the data to the MC simulation prediction.
Events 1 10 2 10 3 10 4 10 5 10 6 10 7 10 ( 8 TeV) -1 19.7 fb CMS Data ttbb b t t tt2b other t t ttH Minor bkg. Uncertainty b jets N 1 2 3 ≥ 4 MC Data 0.8 1 1.2 Events 1 10 2 10 3 10 4 10 5 10 6 10 7 10 ( 8 TeV) -1 19.7 fb CMS Data ttbb b t t tt2b other t t ttH Minor bkg. Uncertainty b jets N 1 2 3 ≥ 4 MC Data 0.8 1 1.2
Figure 5: The pre-fit distribution of the b jet multiplicity in data (points) and from signal and background simulation (histograms) for events fulfilling the lepton selection criteria, having
≥2 jets,≥1 b-tagged jet (left), and the post-fit distribution (right). The hatched area represents the statistical uncertainty in the simulated samples. “Minor bkg.” includes all non-tt processes and tt+Z/W/γ. The lower plots show the ratio of the data to the MC simulation prediction.
12 6 Systematic uncertainties
To improve the description of the data by the simulation, a template fit to the b-tagged jet mul-tiplicity distribution is performed using three different templates obtained from simulation. One template corresponds to the ttb and ttbb processes, defined at the generator level as the events where one or two additional b jets are generated within the acceptance requirements, pT > 20 GeV and |η| < 2.4, (referred to as “tt+HF”). The ttbb and ttb processes are combined into a single template because they only differ by the kinematic properties of the second addi-tional b jet. Details about the definition of the b jets and the acceptance are given in Section 7. The second template includes the background contribution coming from ttcc and tt+light-jets events (referred to as “tt other”), where ttcc events are defined as those that have at least one c jet within the acceptance and no additional b jets. This contribution is not large enough to be constrained by data, therefore it is combined with the tt+light-jets process in a single template. The third template contains the remaining background processes, including tt2b, which corre-sponds to events with two additional b hadrons that are close enough in direction to produce a single b jet. This process, produced by collinear g→bb splitting, is treated separately owing to the large theoretical uncertainty in its cross section and insufficient statistical precision to con-strain it with data. The normalizations of the first two templates are free parameters in the fit. The third is fixed to the corresponding cross section described in Section 3, except for the cross section for the tt2b process, which is corrected by a factor of 1.74+−0.690.74 [65]. The normalization factors obtained for the template fit correspond to 1.66±0.43 (tt+HF) and 1.00±0.01 (tt other). Details about the uncertainties in those factors are presented in Section 6.1.1. The improved description of the b jet multiplicity can be seen in Fig. 5 (right).
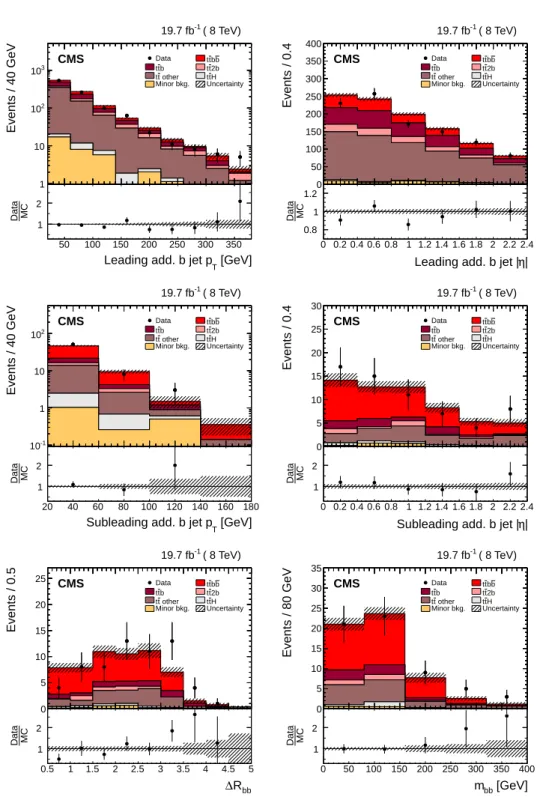
Figure 6 (top) shows the pT and |η| distributions of the leading additional b jet, measured in events with at least three b-tagged jets (using the tighter discriminator value described in Section 4), after the full selection and including all corrections. The distributions of the pT and |η|of the second additional b jet in events with exactly four b-tagged jets,∆Rbb, and mbbare also
presented. The dominant contribution arises from the ttbb process. The tt decays into τ leptons decaying leptonically are included as signal to increase the number of ttb and ttbb events both in data and simulation. It has been checked that the distribution of the variables of relevance for this analysis do not differ between the leptons directly produced from W boson decays and the leptons from τ decays within the statistical uncertainties in the selected ttb and ttbb events. In general, the variables presented are well described by the simulation, after correcting for the heavy-flavour content measured in data, although the simulation tends to predict smaller values of∆Rbb than the data. After the full selection, the dominant background contribution
arises from dilepton tt events with additional light-quark, gluon, and c jets, corresponding to about 50% and 20% of the total expected yields for the ttb and ttbb cases, respectively. Smaller background contributions come from single top quark production, tt in association with Wor Z bosons, and tt events in the lepton+jets decay channels. The contribution from ttH(bb)is also small, amounting to 0.9% and 3% of the total expected events for the ttb and ttbb distributions. The contribution from background sources other than top quark production processes such as DY, diboson, or QCD multijet is negligible.
6
Systematic uncertainties
Different sources of systematic uncertainties are considered arising from detector effects, as well as theoretical uncertainties. Each systematic uncertainty is determined individually in each bin of the measurement by varying the corresponding efficiency, resolution, or model pa-rameter within its uncertainty, in a similar way as in the CMS previous measurement of the tt differential cross sections [8]. For each variation, the measured differential cross section is recalculated and the difference with respect to the nominal result is taken as the systematic
Events / 40 GeV 1 10 2 10 3 10 ( 8 TeV) -1 19.7 fb CMS Data ttbb b t t tt2b other t t ttH Minor bkg. Uncertainty [GeV] T Leading add. b jet p
50 100 150 200 250 300 350 MC Data 1 2 Events / 0.4 0 50 100 150 200 250 300 350 400 ( 8 TeV) -1 19.7 fb CMS Data ttbb b t t tt2b other t t ttH Minor bkg. Uncertainty | η
Leading add. b jet |
0 0.2 0.4 0.6 0.8 1 1.2 1.4 1.6 1.8 2 2.2 2.4 MC Data 0.8 1 1.2 Events / 40 GeV -1 10 1 10 2 10 ( 8 TeV) -1 19.7 fb CMS Data ttbb b t t tt2b other t t ttH Minor bkg. Uncertainty [GeV] T Subleading add. b jet p
20 40 60 80 100 120 140 160 180 MC Data 1 2 Events / 0.4 0 5 10 15 20 25 30 ( 8 TeV) -1 19.7 fb CMS Data ttbb b t t tt2b other t t ttH Minor bkg. Uncertainty | η
Subleading add. b jet |
0 0.2 0.4 0.6 0.8 1 1.2 1.4 1.6 1.8 2 2.2 2.4 MC Data 1 2 Events / 0.5 0 5 10 15 20 25 ( 8 TeV) -1 19.7 fb CMS Data ttbb b t t tt2b other t t ttH Minor bkg. Uncertainty bb R ∆ 0.5 1 1.5 2 2.5 3 3.5 4 4.5 5 MC Data 1 2 Events / 80 GeV 0 5 10 15 20 25 30 35 ( 8 TeV) -1 19.7 fb CMS Data ttbb b t t tt2b other t t ttH Minor bkg. Uncertainty [GeV] bb m 0 50 100 150 200 250 300 350 400 MC Data 1 2
Figure 6: Distributions of the leading additional b jet pT (top left) and |η| (top right), sub-leading additional b jet pT (middle left) and |η| (middle right), ∆Rbb (bottom left), and mbb
(bottom right) from data (points) and from signal and background simulation (histograms). The hatched area represents the statistical uncertainty in the simulated samples. “Minor bkg.” includes all non-tt processes and tt+Z/W/γ. The lower plots show the ratio of the data to the MC simulation prediction.
14 6 Systematic uncertainties
uncertainty. The overall uncertainty in the measurement is then derived by adding all contri-butions in quadrature, assuming the sources of systematic uncertainty to be fully uncorrelated.
6.1 Experimental uncertainties
The experimental sources of systematic uncertainty considered are the jet energy scale (JES), jet energy resolution (JER), background normalization, lepton trigger and identification efficien-cies, b tagging efficiency, integrated luminosity, pileup modelling, and kinematic reconstruc-tion efficiency.
The experimental uncertainty from the JES is determined by varying the energy scale of the reconstructed jets as a function of their pT and η by its uncertainty [56]. The uncertainty from
the JER is estimated by varying the simulated JER by its η-dependent uncertainty [56].
The uncertainty from the normalization of the backgrounds that are taken from simulation is determined by varying the cross section used to normalize the sample, see Section 3, by±30%. This variation takes into account the uncertainty in the predicted cross section and all other sources of systematic uncertainty [5, 8, 66]. In the case of the tW background, the variation of±30% covers the theoretical uncertainty in the absolute rate, including uncertainties owing to the PDFs. The contribution from the DY process, as determined from data, is varied in the normalization by±30% [1, 63].
The trigger and lepton identification efficiencies in simulation are corrected by lepton pT and ηmultiplicative data-to-simulation scale factors. The systematic uncertainties are estimated by varying the factors by their uncertainties, which are in the range 1–2%.
For the tt+jets measurements, the b tagging efficiency in simulation is also corrected by scale factors depending on the pT and η of the jet. The shape uncertainty in the b tagging efficiency
is then determined by taking the maximum change in the shape of the pTand|η|distributions of the b jet, obtained by changing the scale factors. This is achieved by dividing the b jet distri-butions in pT and|η|into two bins at the median of the respective distributions. The b tagging scale factors for b jets in the first bin are scaled up by half the uncertainties quoted in Ref. [57], while those in the second bin are scaled down, and vice versa, so that a maximum variation is assumed and the difference between the scale factors in the two bins reflects the full uncer-tainty. The changes are made separately in the pT and |η| distributions, and independently
for heavy-flavour (b and c) and light-flavour (s, u, d, and gluon) jets, assuming that they are all uncorrelated. A normalization uncertainty is obtained by varying the scale factors up and down by half the uncertainties. The total uncertainty is obtained by summing in quadrature the independent variations.
The uncertainty in the integrated luminosity is 2.6% [67]. The effect of the uncertainty in the level of pileup is estimated by varying the inelastic pp cross section in simulation by±5%. The uncertainty coming from the kinematic reconstruction method is determined from the un-certainty in the correction factor applied to account for the small difference in efficiency be-tween the simulation and data, defined as the ratio bebe-tween the events with a solution and the total number of selected events.
6.1.1 Specific systematic uncertainties associated with the ttbb (ttb) measurements
In the ttbb (ttb) measurements, an additional uncertainty associated with the template fit to the b-tagged jet multiplicity distribution is considered. Since the input templates are known to finite precision, both the statistical and systematic uncertainties in the templates are taken into account. The considered systematic uncertainties that affect the shapes of the templates
are those of the JES, the CSV discriminant scale factors following the method described in [60], the cross section of the ttcc process, which is varied by±50% [60], and the uncertainty in the tt2b cross section. This is taken as the maximum between the largest uncertainty from the measurement described in Ref. [65] and the difference between the corrected cross section and the prediction by the nominal MADGRAPH simulation used in this analysis. This results in a variation of the cross section of about ±40%. This uncertainty is included as a systematic uncertainty in the shape of the background template.
6.2 Model uncertainties
The impact of theoretical assumptions on the measurement is determined by repeating the analysis, replacing the standard MADGRAPHsignal simulation by alternative simulation sam-ples. The uncertainty in the modelling of the hard-production process is assessed by varying the common renormalization and factorization scale in the MADGRAPHsignal samples up and down by a factor of two with respect to its nominal value of the Q in the event (cf. Section 3). Furthermore, the effect of additional jet production in MADGRAPH is studied by varying up and down by a factor of two the threshold between jet production at the matrix element level and via parton showering. The uncertainties from ambiguities in modelling colour reconnec-tion (CR) effects are estimated by comparing simulareconnec-tions of an underlying-event (UE) tune including colour reconnection to a tune without it (Perugia 2011 and Perugia 2011 noCR tunes, described in Ref. [33]). The modelling of the UE is evaluated by comparing two different Pe-rugia 11 (P11) PYTHIA tunes, mpiHi and TeV, to the standard P11 tune. The dependency of the measurement on the top quark mass is obtained using dedicated samples in which the mass is varied by±1 GeV with respect to the default value used in the simulation. The un-certainty from parton shower modelling is determined by comparing two samples simulated
withPOWHEGandMC@NLO, using eitherPYTHIAorHERWIGfor the simulation of the parton
shower, underlying event, and hadronization. The effect of the uncertainty in the PDFs on the measurement is assessed by reweighting the sample of simulated tt signal events according to the 52 CT10 error PDF sets, at the 90% CL [25].
Since the total uncertainty in the ttb and ttbb production cross sections is largely dominated by the statistical uncertainty in the data, a simpler approach than for the tt+jets measurements is chosen to conservatively estimate the systematic uncertainties: instead of repeating the mea-surement, the uncertainty from each source is taken as the difference between the nominal
MADGRAPH+PYTHIA sample and the dedicated simulated sample at generator level. In the
case of the uncertainty coming from the renormalization and factorization scales, the uncer-tainty estimated in the previous inclusive cross section measurement [11] is assigned.
6.3 Summary of the typical systematic uncertainties
Typical values of the systematic uncertainties in the absolute differential cross sections are sum-marized in Table 1 for illustrative purposes. They are the median values of the distribution of uncertainties over all bins of the measured variables. Details on the impact of the different uncertainties in the results are given in Sections 8 to 11.
In general, for the tt+jets case, the dominant systematic uncertainties arise from the uncertainty in the JES, as well as from model uncertainties such as the renormalization, factorization, and jet-parton matching scales and the hadronization uncertainties. For the ttb and ttbb cross sec-tions, the total uncertainty, including all systematic uncertainties, is only about 10% larger than the statistical uncertainty. The experimental uncertainties with an impact on the normalization of the expected number of signal events, such as lepton and trigger efficiencies, have a neg-ligible effect on the final cross section determination, since the normalization of the different
16 7 Differential tt cross section
processes is effectively constrained by the template fit.
Table 1: Summary of the typical systematic uncertainties in the measurements of the tt+jets and ttbb (ttb) absolute differential cross sections and their sources. The median of the distribution of uncertainties over all bins of each measured differential cross section is quoted.
Relative systematic uncertainty (%)
Source tt+jets ttbb (ttb)
Experimental uncertainties
Trigger efficiency 1.3 0.1
Lepton selection 2.2 0.1
Jet energy scale 6.8 11
Jet energy resolution 0.3 2.5
Background estimate 2.1 5.6 b tagging 0.5 12 Kinematic reconstruction 0.3 — Pileup 0.3 1.7 Model uncertainties Fact./renorm. scale 2.7 8.0
Jet-parton matching scale 1.3 3.0
Hadronization 4.5 5.2
Top quark mass 1.4 2.0
PDF choice 0.3 0.9
Underlying event 1.0 2.9
Colour reconnection 1.3 1.9
7
Differential tt cross section
The absolute differential tt cross section is defined as: dσtt dxi = ∑jA −1 ij (N j data−N j bkg) ∆i xL , (1)
where j represents the bin index of the reconstructed variable x, i is the index of the corre-sponding generator-level bin, Ndataj is the number of data events in bin j, Nbkgj is the number of estimated background events, Lis the integrated luminosity, and∆ixis the bin width. Effects from detector efficiency and resolution in each bin i of the measurement are corrected by the use of a regularized inversion of the response matrix (symbolized by A−ij1) described in this section.
For the measurements of tt+jets, the estimated number of background events from processes other than tt production (Nnon tt bkg) is subtracted from the number of events in data (N). The contribution from other tt decay modes is taken into account by correcting the difference N– Nnon tt bkgby the signal fraction, defined as the ratio of the number of selected tt signal events to the total number of selected tt events, as determined from simulation. This avoids the depen-dence on the inclusive tt cross section used for normalization. For the ttb and ttbb production cross sections, where the different tt contributions are fitted to the data, the expected contribu-tion from all background sources is directly subtracted from the number of data events. The normalized differential cross section is derived by dividing the absolute result, Eq. (1), by the total cross section, obtained by integrating over all bins for each observable. Because of the
normalization, the systematic uncertainties that are correlated across all bins of the measure-ment, e.g. the uncertainty in the integrated luminosity, cancel out.
Effects from the trigger and reconstruction efficiencies and resolutions, leading to migrations of events across bin boundaries and statistical correlations among neighbouring bins, are cor-rected using a regularized unfolding method [8, 68, 69]. The response matrix Aij that corrects
for migrations and efficiencies is calculated from simulated tt events using MADGRAPH. The generalized inverse of the response matrix is used to obtain the unfolded distribution from the measured distribution by applying a χ2 technique. To avoid nonphysical fluctuations, a smoothing prescription (regularization) is applied. The regularization level is determined in-dividually for each distribution using the averaged global correlation method [70]. To keep the bin-to-bin migrations small, the width of bins in the measurements are chosen according to their purity and stability. The purity is the number of events generated and correctly re-constructed in a certain bin divided by the total number of rere-constructed events in the same bin. The stability is the ratio of the number of events generated and reconstructed in a bin to the total number of events generated in that bin. The purity and stability of the bins are typically larger than 40–50%, which ensures that the bin-to-bin migrations are small enough to perform the measurement. The performance of the unfolding procedure is tested for possible biases from the choice of the input model (the tt MADGRAPHsimulation). It has been verified
that by reweighting the tt simulation the unfolding procedure based on the nominal response matrix reproduces the altered shapes within the statistical uncertainties. In addition, tt sam-ples simulated withPOWHEGandMC@NLOare employed to obtain the response matrices used in the unfolding for the determination of systematic uncertainties of the model (Section 6.2). Therefore, possible effects from the unfolding procedure are already taken into account in the systematic uncertainties.
The differential cross section is reported at the particle level, where objects are defined as fol-lows. Leptons from W boson decays are defined after final-state radiation, and jets are defined at the particle level by applying the anti-kT clustering algorithm with a distance parameter of
0.5 [54] to all stable particles, excluding the decay products from W boson decays into eν, µν, and leptonic τ final states. A jet is defined as a b jet if it has at least one b hadron associated with it. To perform the matching between b hadrons and jets, the b hadron momentum is scaled down to a negligible value and included in the jet clustering (so-called ghost matching [51]). The b jets from the tt decay are identified by matching the b hadrons to the corresponding orig-inal b quarks. The measurements are presented for two different phase-space regions, defined by the kinematic and geometric attributes of the tt decay products and the additional jets. The visible phase space is defined by the following kinematic requirements:
• Leptons: pT >20 GeV,|η| <2.4,
• b jets arising from top quarks: pT >30 GeV,|η| <2.4,
• Additional jets and b jets: pT >20 GeV,|η| <2.4.
The full phase space is defined by requiring only the additional jets or b jets be within the above-mentioned kinematic range, without additional requirements on the decay products of the tt system, and including the correction for the corresponding dileptonic branching fraction, calculated using the leptonic branching fraction of the W boson [62].
In the following sections, the tt differential cross section measured as a function of the jet mul-tiplicity in the visible phase space and the results as a function of the kinematic variables of the additional jets in the event, measured in the visible and the full phase-space regions, are dis-cussed. The absolute cross sections are presented as figures and compared to different
predic-18 8 tt cross sections as a function of jet multiplicity
tions. The full results are given in tables in Appendix B, along with the normalized differential cross sections measurements.
8
Differential tt cross sections as a function of jet multiplicity
In Fig. 7, the absolute differential tt cross section is shown for three different jet pTthresholds:
pT >30, 60, and 100 GeV. The results are presented for a nominal top quark mass of 172.5 GeV.
The lower part of each figure shows the ratio of the predictions from simulation to the data. The light and dark bands in the ratio indicate the statistical and total uncertainties in the data for each bin, which reflect the uncertainties for a ratio of 1.0. All predictions are normalized to the measured cross section in the range shown in the histogram, which is evaluated by integrating over all bins for each observable. The results are summarized in Table B.1, together with the normalized cross sections. In general, the MADGRAPHgenerator interfaced withPYTHIA6, and
POWHEG interfaced both withHERWIG6 andPYTHIA6, provide reasonable descriptions of the
data. TheMC@NLOgenerator interfaced withHERWIG6 does not generate sufficiently large jet multiplicities, especially for the lowest jet pTthreshold. The sensitivity of MADGRAPHto scale
variations is investigated through the comparison of different renormalization, factorization, and jet-parton matching scales with respect to the nominal MADGRAPHsimulation. Variations
in the jet-parton matching threshold do not yield large effects in the cross section, while the shape and normalization are more affected by the variations in the renormalization and factor-ization scales, which lead to a slightly worse description of the data up to high jet multiplicities, compared to their nominal values.
In Fig. 8, the results are compared to the predictions from MADGRAPHand MG5 AMC@NLO interfaced withPYTHIA8, and thePOWHEGgenerator with the HDAMPparameter set to mt =
172.5 GeV (labelledPOWHEG (hdamp = mt) in the legend), interfaced withPYTHIA6,PYTHIA8,
andHERWIG6. The MADGRAPHand MG5 AMC@NLO simulations interfaced with PYTHIA8
predict larger jet multiplicities than measured in the data for all the considered pTthresholds. In
general, no large deviations between data and the differentPOWHEGpredictions are observed. The total systematic uncertainty in the absolute differential cross section ranges between 6 to 30%, while for the normalized cross section it varies from 2% up to 20% for the bins corre-sponding to the highest number of jets. In both cases, the dominant experimental systematic uncertainty arises from the JES, having a maximum value of 16% for the absolute cross section bin with at least six jets and pT > 30 GeV. Typical systematic uncertainty values range
be-tween 0.5 and 8%, while the uncertainty in the normalized cross section is 0.5–4%. Regarding the modelling uncertainties, the most relevant ones are the uncertainty in the renormalization and factorization scales and the parton shower modelling, up to 6% and 10%, respectively. The uncertainties from the assumed top quark mass used in the simulation and the jet-parton matching threshold amount to 1–2%. Other modelling uncertainties such as PDF, CR, and UE have slightly smaller impact. These uncertainties cancel to a large extent in the normalized results, with typical contributions below 0.5%. The total contribution from the integrated lumi-nosity, lepton identification, and trigger efficiency, which only affect the normalization, is 3.5%. This contribution is below 0.1% for every bin in the normalized results. The uncertainty from the estimate of the background contribution is around 2% for the absolute cross sections and typically below 0.5% for the normalized results.
N_{Jets} 2 3 4 5 ≥6 pb jets dN vis σ d -2 10 -1 10 1 10 ( 8 TeV) -1 19.7 fb CMS > 30 GeV T p Data MadGraph+Pythia6 MC@NLO+Herwig6 Powheg+Pythia6 Powheg+Herwig6 jets N 2 3 4 5 ≥ 6 Data Theory 0.5 1 1.5 Syst. ⊕ Stat. Stat. Jets 2 3 4 5 ≥6 pb jets dN vis σ d -2 10 -1 10 1 10 ( 8 TeV) -1 19.7 fb CMS > 30 GeV T p Data MadGraph+Pythia6 2 = 4Q 2 F µ = 2 R µ MadGraph /4 2 = Q 2 F µ = 2 R µ MadGraph Matching up Matching down jets N 2 3 4 5 ≥ 6 Data Theory 0.5 1 1.5 Syst. ⊕ Stat. Stat. Jets 0 1 2 3 4 ≥5 pb jets dN vis σ d -2 10 -1 10 1 ( 8 TeV) -1 19.7 fb CMS > 60 GeV T p Data MadGraph+Pythia6 MC@NLO+Herwig6 Powheg+Pythia6 Powheg+Herwig6 jets N 0 1 2 3 4 ≥ 5 Data Theory 0.5 1 1.5 Syst. ⊕ Stat. Stat. Jets 0 1 2 3 4 ≥5 pb jets dN vis σ d -2 10 -1 10 1 ( 8 TeV) -1 19.7 fb CMS > 60 GeV T p Data MadGraph+Pythia6 2 = 4Q 2 F µ = 2 R µ MadGraph /4 2 = Q 2 F µ = 2 R µ MadGraph Matching up Matching down jets N 0 1 2 3 4 ≥ 5 Data Theory 0.5 1 1.5 Syst. ⊕ Stat. Stat. N_{Jets} 0 1 2 3 ≥4 pb jets dN vis σ d -2 10 -1 10 1 10 ( 8 TeV) -1 19.7 fb CMS > 100 GeV T p Data MadGraph+Pythia6 MC@NLO+Herwig6 Powheg+Pythia6 Powheg+Herwig6 jets N 0 1 2 3 ≥ 4 Data Theory 0.5 1 1.5 Syst. ⊕ Stat. Stat. N_{Jets} 0 1 2 3 ≥4 pb jets dN vis σ d -2 10 -1 10 1 10 ( 8 TeV) -1 19.7 fb CMS > 100 GeV T p Data MadGraph+Pythia6 2 = 4Q 2 F µ = 2 R µ MadGraph /4 2 = Q 2 F µ = 2 R µ MadGraph Matching up Matching down jets N 0 1 2 3 ≥ 4 Data Theory 0.5 1 1.5 Syst. ⊕ Stat. Stat.
Figure 7: Absolute differential tt cross sections as a function of jet multiplicity for jets with pT >
30 GeV (top row), 60 GeV (middle row), and 100 GeV (bottom row). In the figures on the left, the data are compared with predictions from MADGRAPHinterfaced withPYTHIA6,MC@NLO
interfaced withHERWIG6, andPOWHEGwithPYTHIA6 andHERWIG6. The figures on the right
show the behaviour of the MADGRAPHgenerator with varied renormalization, factorization,
and jet-parton matching scales. The inner (outer) vertical bars indicate the statistical (total) uncertainties. The lower part of each plot shows the ratio of the predictions to the data.
20 8 tt cross sections as a function of jet multiplicity jets N 2 3 4 5 ≥ 6 pb jets dN vis σ d -2 10 -1 10 1 10 ( 8 TeV) -1 19.7 fb CMS > 30 GeV T p Data MadGraph+Pythia6 MadGraph+Pythia8 aMC@NLO+Pythia8 jets N 2 3 4 5 ≥ 6 Data Theory 0.5 1 1.5 Syst. ⊕ Stat. Stat. jets N 2 3 4 5 ≥ 6 pb jets dN vis σ d -2 10 -1 10 1 10 ( 8 TeV) -1 19.7 fb CMS > 30 GeV T p Data Powheg+Pythia6 )+Pythia6 t =m damp Powheg(h )+Pythia8 t =m damp Powheg(h )+Herwig6 t =m damp Powheg(h jets N 2 3 4 5 ≥ 6 Data Theory 0.5 1 1.5 Syst. ⊕ Stat. Stat. jets N 0 1 2 3 4 ≥ 5 pb jets dN vis σ d -2 10 -1 10 1 ( 8 TeV) -1 19.7 fb CMS > 60 GeV T p Data MadGraph+Pythia6 MadGraph+Pythia8 aMC@NLO+Pythia8 jets N 0 1 2 3 4 ≥ 5 Data Theory 0.5 1 1.5 Syst. ⊕ Stat. Stat. jets N 0 1 2 3 4 ≥ 5 pb jets dN vis σ d -2 10 -1 10 1 ( 8 TeV) -1 19.7 fb CMS > 60 GeV T p Data Powheg+Pythia6 )+Pythia6 t =m damp Powheg(h )+Pythia8 t =m damp Powheg(h )+Herwig6 t =m damp Powheg(h jets N 0 1 2 3 4 ≥ 5 Data Theory 0.5 1 1.5 Syst. ⊕ Stat. Stat. jets N 0 1 2 3 ≥ 4 pb jets dN vis σ d -2 10 -1 10 1 10 ( 8 TeV) -1 19.7 fb CMS > 100 GeV T p Data MadGraph+Pythia6 MadGraph+Pythia8 aMC@NLO+Pythia8 jets N 0 1 2 3 ≥ 4 Data Theory 0.5 1 1.5 Syst. ⊕ Stat. Stat. jets N 0 1 2 3 ≥ 4 pb jets dN vis σ d -2 10 -1 10 1 10 ( 8 TeV) -1 19.7 fb CMS > 100 GeV T p Data Powheg+Pythia6 )+Pythia6 t =m damp Powheg(h )+Pythia8 t =m damp Powheg(h )+Herwig6 t =m damp Powheg(h jets N 0 1 2 3 ≥ 4 Data Theory 0.5 1 1.5 Syst. ⊕ Stat. Stat.
Figure 8: Absolute differential tt cross sections as a function of jet multiplicity for jets with pT > 30 GeV (top row), 60 GeV (middle row), and 100 GeV (bottom row). In the figures on
the left, the data are compared with predictions from MADGRAPH interfaced with PYTHIA6
andPYTHIA8, and MG5 AMC@NLO interfaced withPYTHIA8. The figures on the right show
the behaviour of the POWHEG generator without and with HDAMP set to mt, matched with
different versions and tunes of PYTHIAandHERWIG6. The inner (outer) vertical bars indicate the statistical (total) uncertainties. The lower part of each plot shows the ratio of the predictions to the data.
9
Differential tt cross sections as a function of the kinematic
vari-ables of the additional jets
The absolute and normalized differential cross sections are measured as a function of the kine-matic variables of the additional jets in the visible phase space defined in Section 7. The results are compared to predictions from four different generators: POWHEGinterfaced withPYTHIA6
andHERWIG6, MC@NLO+HERWIG6, and MADGRAPH+PYTHIA6 with varied renormalization,
factorization, and jet-parton matching scales. All predictions are normalized to the measured cross section over the range of the observable shown in the histogram in the corresponding figures.
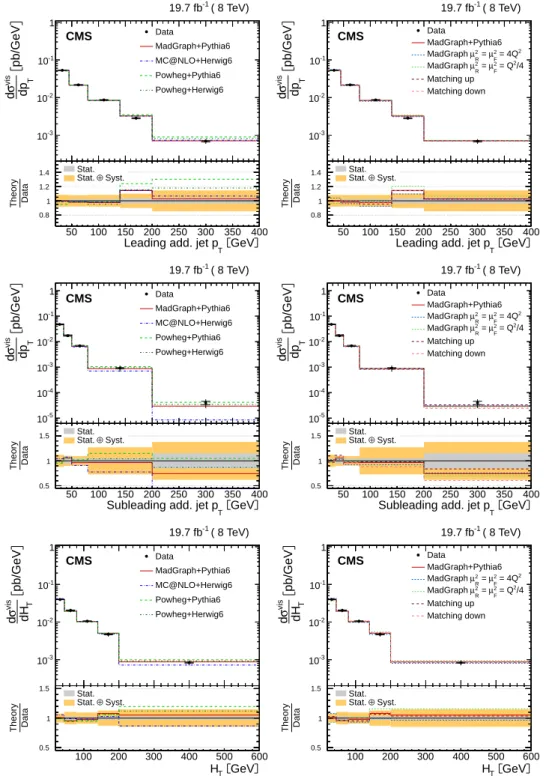
The absolute differential cross sections as a function of the pT of the leading and subleading
additional jets and HT, the scalar sum of the pTof all additional jets in the event, are shown in
Fig. 9. The total uncertainties in the absolute cross sections range from 8–14% for the leading additional jet pTand HT, and up to 40% for the subleading additional jet pT, while the
system-atic uncertainties in the normalized cross sections for the bins with the larger number of events are about 3–4%. The dominant sources of systematic uncertainties arise in both cases from model uncertainties, in particular the renormalization and factorization scales, and the parton shower modelling (up to 10% for the absolute cross sections), and JES (3–6% for the absolute cross sections). The typical contribution of other uncertainties such as the assumed top quark mass in the simulation, background contribution, etc., amounts to 1–3% and 0.5–1.5%, for the absolute and normalized cross sections, respectively.
In general, the simulation predictions describe the behaviour of the data for the leading addi-tional jet momenta and HT, although some predictions, in particularPOWHEG, favour a harder
pT spectrum for the leading jet. TheMC@NLO+HERWIG6 prediction yields the largest
discrep-ancies. The varied MADGRAPHsamples provide similar descriptions of the shape of the data, except for MADGRAPHwith the lower µR =µFscale, which worsens the agreement.
The results as a function of|η|are presented in Fig. 10. The typical total systematic uncertainties in the absolute cross sections vary from 6.5–19% for the leading additional jet and about 11–20% for the subleading one. The uncertainty in the normalized cross section ranges from 1.5–9% and 5–14%, respectively. The shape of the|η|distribution is well modelled byMC@NLO+HERWIG6.
The distributions from MADGRAPHand POWHEG yield a similar description of the data,
be-ing slightly more central thanMC@NLO. Variations of the MADGRAPH parameters have little impact on these distributions.
The differential cross section is also measured as a function of the dijet angular separation ∆Rjjand invariant mass mjjfor the leading and subleading additional jets (Fig. 11). In general,
all simulations provide a reasonable description of the distributions for both variables. All results are reported in Tables B.2–B.4 in Appendix B. Representative examples of the migration matrices are presented in Fig. 24 in Appendix C.
The absolute and normalized differential cross sections are also measured as a function of the kinematic variables of the additional jets and b jets in the event for the full phase space of the tt system to facilitate comparison with theoretical calculations. In this case, the phase space is defined only by the kinematic requirements on the additional jets.
Figures 12 and 13 show the absolute cross sections as a function of the pT and|η|of the lead-ing and subleadlead-ing additional jets and HT, while the results as a function of ∆Rjjand mjjare
presented in Fig. 14.
22 9 tt cross sections as a function of the kinematics of additional jets
GeV T Leading add. jet p
50 100 150 200 250 300 350 400 pb/GeV T dp vis σ d -3 10 -2 10 -1 10 1 ( 8 TeV) -1 19.7 fb CMS Data MadGraph+Pythia6 MC@NLO+Herwig6 Powheg+Pythia6 Powheg+Herwig6 GeV T
Leading add. jet p
50 100 150 200 250 300 350 400 Data Theory 0.8 1 1.2 1.4 Syst. ⊕ Stat. Stat. GeV T Leading add. jet p
50 100 150 200 250 300 350 400 pb/GeV T dp vis σ d -3 10 -2 10 -1 10 1 ( 8 TeV) -1 19.7 fb CMS Data MadGraph+Pythia6 2 = 4Q 2 F µ = 2 R µ MadGraph /4 2 = Q 2 F µ = 2 R µ MadGraph Matching up Matching down GeV T
Leading add. jet p
50 100 150 200 250 300 350 400 Data Theory 0.8 1 1.2 1.4 Syst. ⊕ Stat. Stat. GeV T Subleading add. jet p
50 100 150 200 250 300 350 400 pb/GeV T dp vis σ d -5 10 -4 10 -3 10 -2 10 -1 10 1 ( 8 TeV) -1 19.7 fb CMS Data MadGraph+Pythia6 MC@NLO+Herwig6 Powheg+Pythia6 Powheg+Herwig6 GeV T
Subleading add. jet p
50 100 150 200 250 300 350 400 Data Theory 0.5 1 1.5 Syst. ⊕ Stat. Stat. GeV T Subleading add. jet p
50 100 150 200 250 300 350 400 pb/GeV T dp vis σ d -5 10 -4 10 -3 10 -2 10 -1 10 1 ( 8 TeV) -1 19.7 fb CMS DataMadGraph+Pythia6 2 = 4Q 2 F µ = 2 R µ MadGraph /4 2 = Q 2 F µ = 2 R µ MadGraph Matching up Matching down GeV T
Subleading add. jet p
50 100 150 200 250 300 350 400 Data Theory 0.5 1 1.5 Syst. ⊕ Stat. Stat. GeV T H 100 200 300 400 500 600 pb/GeV T dH vis σ d -3 10 -2 10 -1 10 1 ( 8 TeV) -1 19.7 fb CMS Data MadGraph+Pythia6 MC@NLO+Herwig6 Powheg+Pythia6 Powheg+Herwig6 GeV T H 100 200 300 400 500 600 Data Theory 0.5 1 1.5 Syst. ⊕ Stat. Stat. GeV T H 100 200 300 400 500 600 pb/GeV T dH vis σ d -3 10 -2 10 -1 10 1 ( 8 TeV) -1 19.7 fb CMS DataMadGraph+Pythia6 2 = 4Q 2 F µ = 2 R µ MadGraph /4 2 = Q 2 F µ = 2 R µ MadGraph Matching up Matching down GeV T H 100 200 300 400 500 600 Data Theory 0.5 1 1.5 Syst. ⊕ Stat. Stat.
Figure 9: Absolute differential tt cross section as a function of pT of the leading additional
jet (top) and the subleading additional jet (middle), and HT (bottom) in the visible phase
space of the tt system and the additional jets. Data are compared to predictions from MAD
-GRAPH+PYTHIA6,POWHEG+PYTHIA6,POWHEG+HERWIG6, andMC@NLO+HERWIG6 (left) and
to MADGRAPH with varied renormalization, factorization, and jet-parton matching scales
(right). The inner (outer) vertical bars indicate the statistical (total) uncertainties. The lower part of each plot shows the ratio of the predictions to the data.