AUTOMATIC LAND COVER CLASSIFICATION AT THE
NATIONAL SCALE
by
Hugo Miguel Saiote Carrão
Dissertation submitted to the Instituto Superior de Estatística e Gestão de
Informação da Universidade Nova de Lisboa in partial fulfillment of the
requirements for the Degree of
Doutor em Gestão de Informação – Sistemas de Informação Geográfica
(Doctor of Philosophy in Information Management – Geographic
Information Systems)
Instituto Superior de Estatística e Gestão de Informação
da
Universidade Nova de Lisboa
AUTOMATIC LAND COVER CLASSIFICATION AT THE
NATIONAL SCALE
by
Hugo Miguel Saiote Carrão
Dissertation supervised by
Professor Mário Caetano
Professor Paulo Gonçalves
Instituto Superior de Estatística e Gestão de Informação
da
Universidade Nova de Lisboa
supervisors. As most of the present PhD thesis was completed in the Portuguese Geographic Institute (IGP), under the supervision of Professor Mário Caetano, I wish to thank him for his unflattering trust and constant encouragements, which have been essential to our success through the last four years. Thank you for being an enthusiastic and sagacious individual who provided a steady support in the most difficult times. My apprentice pursuit into the world of science would not have been the same without Professor Paulo Gonçalves’s approach to research and science. I want to extend my appreciation for his patience, for his full devotion, for his great understanding, and for the lessons he gave me on the importance of details for the success of engineering and scientific projects.
I am indebted to my friends and colleagues from IGP for providing me a good environment in which to work. I am grateful to António Araújo, António Nunes, Conceição Pereira and Vasco Nunes for bearing my recurrent bad temper and irascibility trough those last years. Sincere thanks are extended to Professors Fernando Bação and Pedro Coelho, on behalf of making many valuable suggestions which helped improve this thesis.
I wish to express my cordial appreciation to Professors Florence Forbes and Pascale Primet for accepting me as a member of their research teams during my PhD work. Sincere thanks are extended to teams’ members and special friends from Lyon, in particular Dinil Divakaran, Suleyman Baykut and Marianne Schaedel.
I wish to thank to my friends Sérgio Freire, Marco Freire, André Oliveira, Ricardo Armas, André Pinheiro, Susana Dias, Helena Barahona, Inês Pais and Margarida Ferreira for all the emotional support, camaraderie, entertainment, and caring they provided.
I would like to express my heartiest thanks to Marta Jaco and Tatiana Plantier for being with me during the happiest and saddest times, and for their love, tenderness and trust.
I wish to thank to my brother Ricardo, my grandfather José Saiote, and my uncles Fernando Saiote and António Saiote for their encouragements throughout my graduate work.
I owe my parents, Mariana Saiote and Armando Carrão, much of what I have become. I thank them for their love, their support, and their confidence throughout the past thirty-one years. They taught me to value honesty and humility above all other virtues. Thank you for your unwavering support.
• Fundação para a Ciência e Tecnologia (FCT) – SFRH/BD/18447/2004; • Programa Operacional Ciência e Inovação 2010 (POCI 2010);
• European Union (EU);
• European Space Agency (ESA); • Instituto Geográfico Português (IGP);
• Institut National de Recherche en Informatique et Automatique (INRIA)
Rhône-Alpes;
• École Normale Supérieure de Lyon (ENS) - Laboratoire de l’Informatique du
Parallélisme (RESO – INRIA);
• Luso-French Integrated University Actions – 2007-2008;
• Research Centre for Statistics and Information Management (CEGI). • Fundação Luso-Americana (FLAD);
• Fundação Calouste Gulbenkian.
tal que, actualmente, os novos satélites permitem a recolha diária de imagens da superfície terrestre. É inquestionável, que a tendência para uma observação temporal contínua da superfície terrestre irá alargar o âmbito de actuação das actividades relacionadas com a detecção remota. Torna-se inevitável, com o crescimento abrupto da informação temporal disponível, o desenvolvimento de abordagens que combinem o processamento digital de imagens de satélite multi-espectrais com a análise tradicional de séries temporais, para a caracterização da distribuição da ocupação do solo e da sua monitorização. No entanto, métodos quantitativos que demonstrem a proficiência de séries tridimensionais de imagens de satélite (i.e. especial, espectral e temporal), para a classificação automática da ocupação do solo e análise da dinâmica da ocupação do solo, não foram todavia explorados. Nesta dissertação investiga-se a utilidade de séries temporais de imagens de satélite multi-espectrais para a caracterização regular da ocupação do solo a uma escala nacional. Este estudo é realizado no território de Portugal Continental e explora imagens de satélite adquiridas pelo Moderate Resolution Imaging Spectroradiometer (MODIS) e MEdium Resolution Imaging Spectrometer (MERIS). Especificamente, focamo-nos na análise da contribuição da informação temporal de imagens de satélite multi-espectrais para a discriminação automática de classes de ocupação do solo. Os resultados mostram que a informação multi-espectral contribui de forma mais significativa do que a informação multitemporal para a classificação automática de tipos de ocupação do solo. Na sequência, revemos algumas dos pontos mais importantes de qualquer protocolo de produção automática de cartografia de ocupação do solo a partir de imagens de satélite. Propomos uma abordagem metodológica para a produção automática de mapas de ocupação do solo a partir de séries temporais de imagens de satélite e sua validação. Finalmente, desenvolvemos um modelo harmónico não linear para o ajuste temporal de reflectâncias e índices de vegetação derivados de imagens de satélite, para diversas classes de ocupação do solo. A informação multitemporal sintetizada pelo modelo é suficientemente abrangente para descrever as principais características da ocupação do solo e prever a evolução temporal dos seus indivíduos.
generations of satellites commonly provide with Earth’s surface snapshots at very short sampling periods (i.e. daily images). It is unquestionable that this tendency towards continuous time observation will broaden up the scope of remotely sensed activities. Inevitable also, such increasing amount of information will prompt methodological approaches that combine digital image processing techniques with time series analysis for the characterization of land cover distribution and monitoring of its dynamics on a frequent basis. Nonetheless, quantitative analyses that convey the proficiency of three-dimensional satellite images data sets (i.e. spatial, spectral and temporal) for the automatic mapping of land cover and land cover time evolution have not been thoroughly explored. In this dissertation, we investigate the usefulness of multispectral time series sets of medium spatial resolution satellite images for the regular land cover characterization at the national scale. This study is carried out on the territory of Continental Portugal and exploits satellite images acquired by the Moderate Resolution Imaging Spectroradiometer (MODIS) and MEdium Resolution Imaging Spectrometer (MERIS). In detail, we first focus on the analysis of the contribution of multitemporal information from multispectral satellite images for the automatic land cover classes’ discrimination. The outcomes show that multispectral information contributes more significantly than multitemporal information for the automatic classification of land cover types. In the sequence, we review some of the most important steps that constitute a standard protocol for the automatic land cover mapping from satellite images. Moreover, we delineate a methodological approach for the production and assessment of land cover maps from multitemporal satellite images that guides us in the production of a land cover map with high thematic accuracy for the study area. Finally, we develop a nonlinear harmonic model for fitting multispectral reflectances and vegetation indices time series from satellite images for numerous land cover classes. The simplified multitemporal information retrieved with the model proves adequate to describe the main land cover classes’ characteristics and to predict the time evolution of land cover classes’ individuals.
AgRISTARS Agriculture and Resources Inventory Surveys Through Aerospace Remote
Sensing
ANN Artificial Neural Network
ASAR Advanced Synthetic Aperture Radar
AVHRR Advanced Very High Resolution Radiometer BMU Best Matching Unit
BRDF Bidirectional Reflectance Distribution Function CLC CORINE Land Cover
CORINE Co-ordination of Information on the Environment COS Carta de Ocupação do Solo (Land Cover Map)
dB Decibel
DGRF Direcção Geral dos Recursos Florestais (Portuguese Forest Services) DL Double Logistic
EEA European Environment Agency ENS École Normale Supérieure ENVISAT Environmental Satellite EO Earth Observation ESA European Space Agency ETM Enhanced Thematic Mapper EU European Union
EVI Enhanced Vegetation Index FAO Food and Agriculture Organization FDA Fisher Discriminant Analysis FR Full Resolution
GIS Geographic Information Systems GLC Global Land Cover
HRG High Resolution Geometric HT Horvitz-Thomson
ICR Interpretation Confidence Rating
LDC Linear Discriminant Classifier LGN Dutch land use database LR Low Resolution
LULC Land Use and Land Cover LVQ Linear Vector Quantization
MARS Monitoring Agriculture with Remote Sensing MERIS MEdium Resolution Imaging Spectrometer MIR Mid-Infrared
ML Maximum Likelihood MLP Multi-Layer Perceptron MMU Minimum Mapping Unit
MODIS Moderate Resolution Imaging Spectroradiometer MRLC Multi-Resolution Land Characteristics
MSE Mean Square Error
NASA National Aeronautics and Space Administration NDVI Normalized Difference Vegetation Index
NOAA National Oceanic and Atmospheric Administration NRMSE Normalized Root Mean Square Error
PCA Principal Component Analysis Pdf Probability density functions RBF Radially Basis Function RMSE Root Mean Square Error
RMSPE Root Mean Square Prediction Error RR Reduced Resolution
RS Remote Sensing RSU Remote Sensing Unit SAR Synthetic Aperture Radar SD Solar diffuser
SDSM Solar diffuser stability monitor SNR Signal to Noise Ratio
SOM Self-Organizing Map
TOA Top of the Atmosphere US United States
VI Vegetation Index
VIS Visible
ACKNOWLEDGMENTS ...iii
RESUMO... vii
ABSTRACT... ix
LIST OF ABBREVIATIONS AND ACRONYMS... xi
LIST OF TABLES... xix
LIST OF FIGURES ... xxi
1 INTRODUCTION ... 1
1.1. Overall research objectives... 1
1.2. Dissertation organization ... 1
1.3. Context... 5
1.4. References... 19
2 USE OF INTRA-ANNUAL SATELLITE IMAGERY TIME-SERIES FOR LAND COVER CHARACTERIZATION PURPOSE ... 25
Abstract... 25
2.1. Introduction... 25
2.2. Study area and data... 27
2.3. Methodology... 27
2.4. Results and discussion ... 29
2.5. Conclusions... 36
2.6. Acknowledgements... 36
2.7. References... 36
3 CONTRIBUTION OF MULTISPECTRAL AND MULTITEMPORAL INFORMATION TO LAND COVER CLASSIFICATION FROM MODIS IMAGES... 41
Abstract... 41
3.1. Introduction... 42
3.2. Study area and experimental data set... 44
3.3. Data analysis... 48
3.4. Results and discussion ... 55
3.5. Conclusion ... 63
3.6. Acknowledgements... 63
3.7. References... 64
4 SEPARABILITY ANALYSIS OF LAND COVER CLASSES AT REGIONAL SCALE: A COMPARATIVE STUDY OF MERIS AND MODIS DATA... 71
4.3. Dataset... 73
4.4. Methodology... 76
4.5. Results and discussion ... 78
4.6. Conclusion ... 80
4.7. Acknowledgements... 81
4.8. References... 81
5 MERIS BASED LAND COVER CHARACTERIZATION: A COMPARATIVE STUDY ... 85
Abstract... 85
5.1. Introduction... 85
5.2. Study area and data set... 88
5.3. Methodology... 90
5.4. Results and discussion ... 96
5.5. Conclusion ... 99
5.6. Acknowledgements... 100
5.7. References... 100
6 MERIS BASED LAND COVER CLASSIFICATION WITH SELF-ORGANIZING MAPS: PRELIMINARY RESULTS ... 105
Abstract... 105
6.1. Introduction... 105
6.2. Study area and data set... 107
6.3. Methodology... 108
6.4. Results and discussion ... 111
6.5. Conclusion ... 113
6.6. Acknowledgements... 114
6.7. References... 114
7 SAMPLE DESIGN AND ANALYSIS FOR THEMATIC MAP ACCURACY ASSESSMENT: AN APPROACH BASED ON DOMAIN ESTIMATION FOR THE VALIDATION OF LAND COVER PRODUCTS ... 117
Abstract... 117
7.1. Introduction... 117
7.2. Survey sampling... 118
7.3. Analysis and estimation ... 120
7.4. Acknowledgements... 125
Abstract... 127
8.1. Introduction... 127
8.2. Land Cover Nomenclature... 128
8.3. Database Design ... 129
8.4. Database Analysis... 133
8.5. Conclusion ... 134
8.6. Acknowledgments ... 134
8.7. References... 134
9 MULTITEMPORAL MERIS IMAGES FOR LAND COVER MAPPING AT NATIONAL SCALE: THE CASE STUDY OF PORTUGAL ... 137
Abstract... 137
9.1. Introduction... 137
9.2. Land cover nomenclature... 140
9.3. Study area ... 142
9.4. Dataset ... 142
9.5. Methodology... 144
9.6. Results and Discussion ... 151
9.7. Conclusion ... 156
9.8. Acknowledgements... 157
9.9. References... 157
10 A NONLINEAR HARMONIC MODEL FOR FITTING SATELLITE IMAGES TIME SERIES: ANALYSIS AND PREDICTION OF LAND COVER DYNAMICS ... 163
Abstract... 163
10.1. Introduction... 164
10.2. Satellite images time series fitting ... 165
10.3. Case studies... 172
10.4. Conclusion ... 185
10.5. Acknowledgment ... 187
10.6. References... 187
11 CONCLUSIONS... 191
11.1. Main outcomes... 191
11.2. Main difficulties... 196
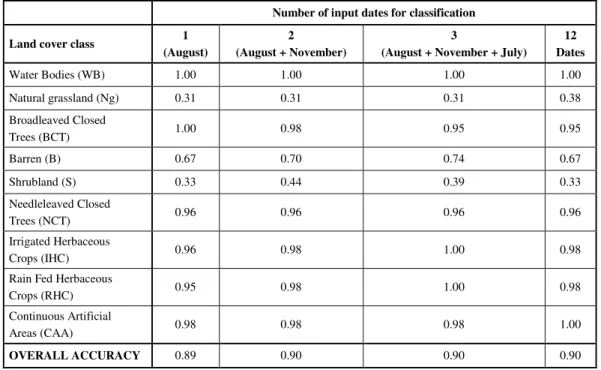
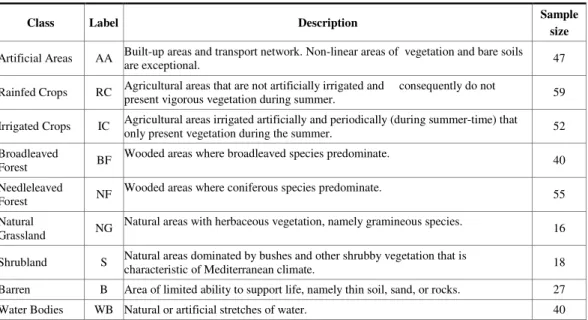
characteristics. ... 9 Table 2.1. User’s and Producer’s accuracies per class. This repartition corresponds to the SVM classification based on reflectances and vegetation indices obtained at a single date (August, 2000)... 31 Table 2.2. Overall land cover classification accuracies obtained with combinatorial subsets of two dates... 32 Table 2.3. Overall classification accuracies from the best single date classification, from the best two and three dates combinatorial sets and from the twelve dates association. The table shows the individual classification accuracy for each class (producer’s accuracy) and overall accuracy. ... 34 Table 2.4. Z values to appraise the significance of the difference between classification accuracies from the best single date classification, from the best two and three dates combinatorial sets and from the twelve dates association. ... 35 Table 3.1. Land cover classes description, label and respective number of collected samples.
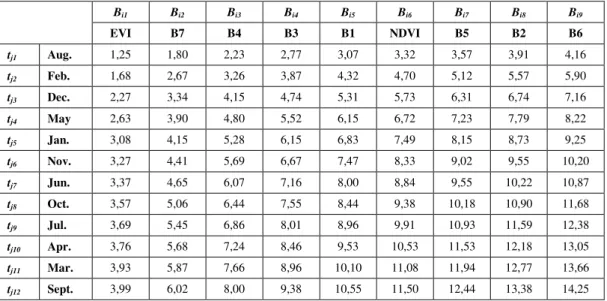
... 45 Table 3.2. Mahalanobis median distances D(Fp,q) between the nine land cover classes. Fp,q
corresponds to the feature subspace composed of the p channels {Bi1,…, Bip} measured at
the q dates {tj1, …, tjq}. ... 56
Table 3.3. Overall classification accuracy C(Fp,q) of the nine land cover classes, obtained
with an optimized SVM trained and tested on Fp,q. Each Fp,q corresponds to the feature
subspace composed of the p channels {Bi1,…, Bip} measured at the q dates {tj1, …, tjq}. 57
Table 9.2. CLC2000 level 3 nomenclature... 143 Table 9.3. Reference sample sizes for training and testing. Test 1 and Test 2 represent, respectively, the number of observations per land cover class collected as primary and secondary reference. ... 145 Table 9.4. Percentage area occupied per mapped land cover class (Nh), and 95% confidence
intervals for percentage area occupied per reference land cover class (Ng), overall
accuracy (P), user’s accuracy (Ph) and producer’s accuracy (Pg). Absolute precision is
represented by d... 151 Table 9.5. Estimated proportion (Nˆ ) of matches between map and reference classes as a hg percentage of the total study area. ... 153 Table 9.6. Comparison between land cover map derived from 2005 multitemporal MERIS images and CLC2000. Each cell represents the classes’ intersection (%) in relation to the total area of the territory. Intersections with correct agreement between the two nomenclatures are in bold face. ... 155 Table 10.1. Model parameters used to synthesize time series data... 169 Table 10.2. Mean SNR and SNR gain for model fits to input time series with different SNRs.
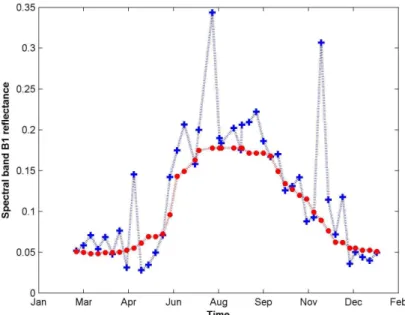
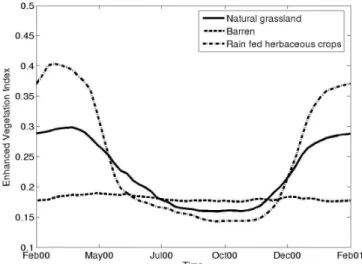
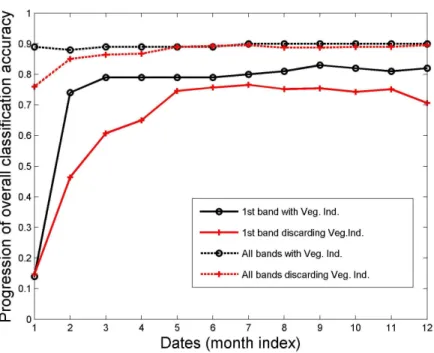
Figure 2.2. Mean EVI values as function of time for “Natural grassland” (Ng), “Barren” (B), and “Rain Fed Herbaceous Crops” (RHC). See (33) for further details on mean profiles calculation... 31 Figure 2.3. Overall classification accuracy per combinatorial subsets of two dates. Each box plot represents the lower quartile, median, and upper quartile of classification accuracy obtained for all pair-wise combinations of each month with each of the remaining eleven months images. Classification values that are considered as outliers are represented by “+”. ... 32 Figure 2.4. Overall classification accuracy obtained with observations from a single date and from combinatorial sets of two and three dates. For each month, only the best overall classification accuracies obtained by combining it with one and two other dates are displayed... 34 Figure 3.1. Typical time series corresponding to the intra-annual evolution of reflectance in MOD09A1 spectral band B1 (red wavelength) for a pixel area of the Rainfed Crop (RC) class. Crosses correspond to the raw observed data. Dots show the output of a time-varying windowed median filter (we used a gaussian window with a width corresponding to a six weeks duration). ... 49 Figure 3.2. EVI time profiles obtained by averaging the sample belonging to the same land cover class. The three displayed classes, Natural Grassland (NG), Barren (B) and Rainfed Crops (RC), mix up in summer time, whereas they are perfectly distinguishable in winter... 57 Figure 3.3. Overall classification accuracy progression when increasing the number of measurements along time. For the two situations: comprising and discarding the vegetation indices, classifications based on a single (best) channel and based on all channels are presented... 61 Figure 5.1. Spatial distribution of collected samples. ... 92 Figure 5.2. Mean spectral signatures for land cover classes derived from the MERIS image of August 14th, 2004. ... 97 Figure 9.1. Land cover map for Continental Portugal derived from multitemporal MERIS images of 2005. ... 152 Figure 10.1. Averagefitting error (%), < eN >θ, corresponding to the same N.... 170 Figure 10.2. Nonlinear model fits for time series synthesized with different SNRs... 171 Figure 10.3. Observed EVI time series for three Rice crops (23) individuals and the respective nonlinear, AG and DL fits... 178 Figure 10.4. Observed EVI time series for three Needleleaved forest (321) individuals and the respective nonlinear, AG and DL fits. ... 178 Figure 10.5. Observed EVI time series for two Eucalyptus forest (3112) individuals and the respective nonlinear, AG and DL fits... 179 Figure 10.6. Rice crops (23) phenological attributes. a) NDVI time series and respective model fit for a single observation; b) first and second derivatives of modelled time series as function of time. Vertical bars represent the times for: Transplanting tT; Onset of
Figure 10.8. Rice crops (23) sample RMSPEs for: a) dates of maturity tM as function of t n; b)
dates of harvesting tH as function of t
n... 183
Figure 10.9. Estimated Rice crops (23) sample probability distribution for M n
eN , where = M −6
n t
t . ... 184 Figure 10.10. Estimated Shrubland (34) sample probability distributions for: a)eTm
20; b)eN20m.
... 184 Figure 10.11. NDVI time series model fits for two Shrubland (34) individuals and respective model predictions for t20. The rectangles represent the standard deviations
foreTm
1
INTRODUCTION
1.1.
Overall research objectives
The broad objective of this research is to investigate the usefulness of intra-annual time series sets of multispectral satellite images with medium spatial resolution for the automatic assessment of land cover distribution and dynamics at the national scale. The goal is to give response to some of the land cover characterization tasks that were attributed to the Portuguese Geographic Institute (IGP) in the framework of the Portuguese R&D National Strategy for Space (approved by the Science Ministry on 5th March 2004), namely the
planning of strategies for the regular mapping of land cover distribution and analysis of land cover dynamics at the national scale.
In a series of nine companion studies, the work described here evaluates the suitability of high temporal and spectral resolution satellite images acquired by the Moderate Resolution Imaging Spectroradiometer (MODIS) and MEdium Resolution Imaging Spectrometer (MERIS) for the periodic characterization of land cover in Continental Portugal. In general, we review some of the major problems related with the numerous steps that constitute a standard protocol for the automatic land cover mapping from satellite images, namely: selection of the most adequate set of Earth Observation (EO) data, nomenclature definition and respective sample data collection, automatic classification problem, and accuracy assessment process. In detail, we aim at understanding and appraising the value of multi-temporality in the context of automatic land cover classification from multispectral satellite images. We first focus on the analysis of the contribution of multitemporal and multispectral information from satellite images for land cover classes’ discrimination. In the sequence, we investigate a mathematical function to methodically describe the intra-annual evolution of multispectral reflectances and vegetation indices (VI) time series sets from satellite images for different land cover classes. The goal is to optimize the contribution of high frequency multitemporal information from multispectral satellite images for the characterization and prediction of land cover classes distribution and dynamics.
1.2.
Dissertation organization
requirements of the respective Peer-Reviewed Journals (4) or Conferences (5) to which the stand-alone manuscripts have been submitted for publication. The individual manuscripts were ordered in this dissertation so as to reproduce the line of research in a natural time sequence, i.e. such that the outcomes of each stand-alone publication directly link with the research premises of the following manuscripts. The order of the publications in this dissertation and their respective citations are:
• Carrão, H., Gonçalves, P. and Caetano, M. (2007), Use of intra-annual satellite imagery time-series for land cover characterization purpose. EARSeL eProceedings, 6, 1-11.
• Carrão, H., Gonçalves, P. and Caetano, M. (2008), Contribution of multispectral and multitemporal information from MODIS images to land cover classification.
Remote Sensing of Environment, 112, 986-997.
• Carrão, H., Sarmento, P., Araújo, A. and Caetano, M. (2007), Separability analysis of land cover classes at regional scale: a comparative study of MERIS and MODIS data. In Proceedings of the ENVISAT Symposium (unpaginated CD-ROM), 23-27 April 2007, Montreaux, Switzerland.
• Carrão, H., Gonçalves, P. and Caetano, M. (2006), MERIS Based Land Cover Characterization: A Comparative Study. In Proceedings of the ASPRS 2006 Annual Conference - Prospecting for Geospatial Information Integration (unpaginated CD-ROM), 1-6 May 2006, Reno, Nevada, USA.
• Carrão, H., Capão, L., Bação, F. and Caetano, M. (2006), MERIS Based Land Cover Classification With Self-Organizing Maps: Preliminary Results. In
Proceedings of the 2nd EARSeL SIG Workshop on Land Use & Land Cover
(unpaginated CD-ROM), 28-30 September 2006, Bonn, Germany.
• Carrão, H., Caetano, M. and Coelho, P. (2007), Sample Design and Analysis for Thematic Map Accuracy Assessment: An Approach Based on Domain Estimation for the Validation of Land Cover Products. In Proceedings of the 32nd International Symposium on Remote Sensing of Environment (unpaginated CD-ROM), 25-29 June 2007, San Jose, Costa Rica.
Remote Sensing Symposium (IGARSS´2007), 23-28 July 2007, Barcelona, Spain, 3967-3970.
• Carrão, H., Araújo, A., Gonçalves, P. and Caetano, M. (2009), Multitemporal MERIS images for land cover mapping at national scale: the case study of Portugal.
International Journal of Remote Sensing, to be published.
• Carrão, H., Gonçalves, P. and Caetano, M. (2009), A nonlinear harmonic model for fitting satellite images time series: analysis and prediction of land cover dynamics.
IEEE Transactions on Geoscience and Remote Sensing, submitted.
Furthermore, in the framework of this research, several parallel studies were developed in close collaboration with master students at the Remote Sensing Unit (RSU) of the Portuguese Geographic Institute (IGP) and were published as manuscripts in Peer-Reviewed Journals (1) and International Conferences (16) within the Remote Sensing community. Next, we present the complete list of published manuscripts:
• Sarmento, P., Carrão, H., Caetano, M. and Stehman, S. V. (2009), Incorporating reference classification uncertainty into the analysis of land cover accuracy.
International Journal of Remote Sensing, to be published.
• Araújo, A., Carrão, H. and Caetano, M. (2009), An operational approach for annual land cover mapping at the national scale with MERIS images. In D. Maktav (Ed.),
Remote Sensing for a Changing Europe (pp. 602-609). Amsterdam: IOS Press. • Costa, H., Carrão, H., Bação, F. and Caetano, M. (2008), Land cover classification
in Portugal with multitemporal AWiFS images: a comparative study. In D. Maktav (Ed.), Remote Sensing for a Changing Europe (pp. 239-246). Amsterdam: IOS Press.
• Araújo, A., Carrão, H. and Caetano, M. (2008), Using estimated land cover classes accuracies in multi-temporal classification. In M. Gomarasca (Ed.), Geoinformation in Europe (pp. 255-365). Rotterdam: Millpress.
• Sarmento, P., Carrão, H. and Caetano, M. (2008), A fuzzy synthetic evaluation approach for land cover cartography accuracy assessment. In J. Zang and M. Goodchild (Ed.), Spatial Uncertainty (pp. 348-355). Liverpool: World Academic Union.
MERIS/(A)ATSR User Workshop, 22-26 September 2008, ESA/ESRIN Frascati (Rome), Italy.
• Costa, H., Araújo, A., Carrão, H. and Caetano, M. (2008), Influência das características técnicas das imagens de satélite na produção de cartografia de ocupação do solo: estudo baseado em imagens MERIS e AwiFS. In Actas do X Encontro de Utilizadores de Informação Geográfica (eSIG’08), 14-16 May 2008, Oeiras, Portugal, in press.
• Sarmento, P., Carrão, H. and Caetano, M. (2008), Avaliação da exactidão temática de cartografias de ocupação do solo através de funções fuzzy: primeira abordagem. In Actas do X Encontro de Utilizadores de Informação Geográfica (eSIG’08), 14-16 May 2008, Oeiras, Portugal, in press.
• Capão, L., Carrão, H., Araújo, A. and Caetano, M. (2007), An approach for land cover mapping with multi-temporal MERIS imagery. IEEE International Geoscience and Remote Sensing Symposium (IGARSS´2007), 23-28 July 2007, Barcelona, Spain, 3836-3839.
• Carrão, H., Sarmento, P. Araújo, A. and Caetano, M. (2007), Retrieving land cover information from MERIS and MODIS data: a comparative study for landscape characterization in Portugal. IEEE International Geoscience and Remote Sensing Symposium (IGARSS´2007), 23-28 July 2007, Barcelona, Spain, 1271-1274.
• Carrão, H., Gonçalves, P. and Caetano, M. (2007), Use of intra-annual satellite imagery time-series for land cover characterization purpose. In Z. Bocheneck (Ed.),
New Developments and Challenges in Remote Sensing (pp. 355-365). Rotterdam: Millpress.
• Carrão, H. and Caetano, M. (2007), A comparison of MERIS and MODIS data for land cover characterization. In Anais XIII Simpósio Brasileiro de Sensoriamento Remoto, Florianópolis, Brasil, 21-26 Abril 2007, INPE, p. 5631-5633.
• Gonçalves, P., Carrão, H. and Caetano, M. (2007), Parametric model for intra-annual reflectance time series. In Z. Bocheneck (Ed.), New Developments and Challenges in Remote Sensing (pp. 367-375). Rotterdam: Millpress.
• Pinheiro, A., Carrão, H., Gonçalves, P. and Caetano, M. (2007), A Toolbox for multi-temporal analysis of satellite imagery, In Z. Bocheneck (Ed.), New Developments and Challenges in Remote Sensing (pp. 395-404). Rotterdam: Millpress.
• Cerdeira, C., Araújo, A., Carrão, H. and Caetano, M. (2006), Validação das Cartografias Globais de Ocupação do Solo, GLC2000 e MOD12Q1, para Portugal Continental. In Actas do IX Encontro de Utilizadores de Informação Geográfica
(unpaginated CD-ROM), 15-17 November 2006, Oeiras, Portugal.
• Gonçalves, P., Carrão, H., Pinheiro, A. and Caetano, M. (2006), Land cover classification with Support Vector Machine Applied to MODIS imagery. In A. Marçal (Ed.), Global Developments in Environmental Earth Observation from Space
(pp. 517-526). Rotterdam: Millpress.
1.3.
Context
1.3.1.Motivation
Land cover, i.e. "the observed biophysical cover on the Earth's surface" (Di Gregorio and Jansen 2000), is key environmental information. It embraces, for example, the quantity and type of surface vegetation, water, and earth materials (Meyer and Turner 1994). Land cover is generally a reflection of the local climate and landforms, though it can be altered by the human use of land. It is important for many scientific domains, resource management and policy purposes, and for a range of human activities (Comber 2008).
Land cover varies at a range of spatial scales, from local to global, and at temporal frequencies of days to millennia (Cihlar 2000). Variations in the composition and distribution of land cover types play an active role in the Earth’s surface energy and water balance, as well as in the carbon cycle (Penner 1994, Kalnay and Cai 2003). In turn, land cover changes can arise in response to natural hazards (drought, wind, floods, and rain erosion) and anthropic stress (industry, overgrazing, fires, land abandonment) (Veldkamp and Lambin 2001).
pressures, both natural and anthropogenic, that lean towards many physical processes and diffusive phenomena over different time periods and spatial scales (Foley et al. 2005). As the need for environmental understanding, management and planning became urgent to mitigate several negative human impacts on the world's landscapes, an accompanying call for updated land cover information emerged in parallel (Loveland et al. 2000, Rogan and Chen 2004). Under this framework, land cover mapping has an important role as it can be a very useful tool for studying the dynamic properties of the Earth’s environment (Stehman et al. 2000). Land cover maps provide important and detailed information about the Earth’s surface that is commonly used for ecological monitoring, natural resources assessment, and policies development (Foody 2002). Land cover maps are easily understandable, managed and combined with other types of information (Veldkamp and Lambin 2001). Therefore, modelling the land cover dynamics, especially if done in a spatially explicit, integrated and multi-scale manner, is an important technique for the projection of alternative pathways into the future, for conducting experiments that test our understanding of environmental key processes, and for describing the latter in quantitative terms (Lambin et al. 2000).
On the one hand, maps of the distribution and status of the Earth’s surface elements are nowadays critical for complex parameterization of climate, agricultural and epidemiological models, as well as for simple local to global scale forestry, industrial, urban and social applications (Muchoney et al. 2000). On the other hand, the ability to inventory and map land cover dynamics and to monitor land cover changes is required for, among other things, modeling the carbon and hydrologic cycles, studying land surface-climate interactions, and establishing rates of deforestation (Foley et al. 2005). Indeed, mapping land cover time evolution, namely in forests, grasslands, wetlands and agricultural lands, contributes significantly to the study of inter-annual land cover dynamics which have a direct impact on the carbon source and sink estimations and predictions (Clevers et al. 2007). Therefore, to protect the environment and to ensure sustainable use of natural resources, a wide variety of national and international mechanisms have been established for environmental monitoring, which on their turn have resulted on many land cover mapping activities. Examples are the European Union (EU) Habitats Directive (Wils 1994), the EU Common Agricultural Policy (Olesen and Bindi 2002) and the Kyoto Protocol (Steffen et al. 1998).
development (Loveland et al. 2000). However, at global scales, we can only expect to successfully monitor the status of pre-established impacts on the environment, but not to detect and effectively plan the mitigation of the causing disturbances at the appropriate times (Veldkamp and Lambin 2001). In contrast, as the spatial resolution of land cover maps becomes finer, the direct actors of land cover change can be identified and process-based relationships can be determined. (Hansen et al. 2000, Veldkamp and Lambin 2001). Therefore, for the establishment of effective environmental protection programs and land cover management applications, there is a need for land cover maps produced at local to regional scales (Skole and Cochrane 2004). Land cover dynamics that are on the basis of the environmental global stresses have important spatial attributes that appear only at those finer scales (Foley et al. 2005). Indeed, relevant land cover changes induced by human activities occur at typical spatial scales in the order of 250-500 m (Zhan et al. 2002). Thus, the development of dynamic models of land cover change for the establishment of national policies for, e.g. forest fire prevention, agricultural practices, water consumption, coastal protection and drought assessment, involves a closer examination of national scale processes (Mücher et al. 2000).
Independently of the spatial scale of analysis, it is extremely difficult to generate spatially and temporally coherent land cover products for monitoring and understanding land surface events from time irregular and geographically sparse records collected at ground stations (Anderson 1976). Because of the synoptic geographical coverage and frequent temporal acquisition of satellite images’ observations, remotely-sensed data possess significant potential for automatic mapping of land cover distribution and dynamics from local to global scales (Rogan and Chen 2004). Satellite images provide more economical snapshots of the Earth’s surface which can be acquired over continuous wide spatial areas. Maps produced from the automatic classification of multispectral satellite images data have the advantages of frequent acquisition and internal consistency of remotely-sensed data sets over traditional ground-based methods (Stehman et al. 2000, Foody 2002, Moran et al. 2004). Indeed, a primary reason for attempting to create maps from remotely-sensed data sets is the potential for the regular production of more accurate and consistent land cover information than past efforts compiled from ground-based methods (Loveland et al. 2000).
distribution and dynamics have, to date, made only limited use of multitemporal remotely sensed image data (Homer et al. 2004). Studies reporting the use of time series sets of satellite images for land cover classification often include relatively few dates, possibly due to a lack of cloud-free images, cost and processing requirements of existing remotely sensed data sets (Knight et al. 2006).
New satellite data
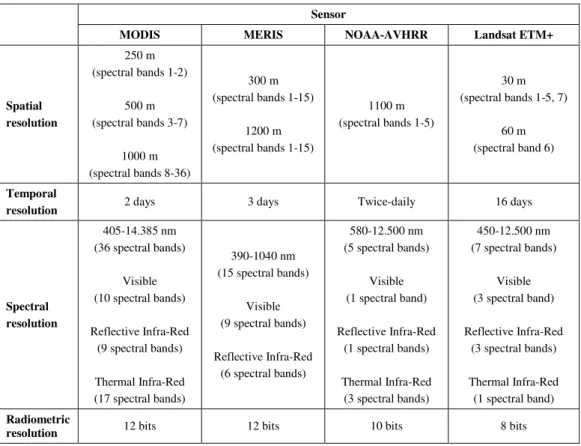
With the launch of MODIS and MERIS sensors, a broad range of new opportunities for automatic land cover mapping at the national scale started (Rast et al. 1999, Zhan et al. 2002, Rogan and Chen 2004). Although these data are too coarse for the purposes of local level land planning and management, they serve as a general product for national agencies (Rogan and Chen 2004). These images exhibit enhanced spectral and temporal resolutions, wide geographical coverage and improved atmospheric correction (Borak and Strahler 1999, Curran and Steele, 2005). Therefore, the gap between fine and coarse spatial resolution sensors can now be filled with imagery at MODIS and MERIS spatial resolutions, i.e. 500 and 300 m, respectively (Clevers et al. 2007). Indeed, both sensors overcome the spatial and spectral resolutions of NOAA-AVHRR sensor, and the temporal resolution of Landsat ETM+ sensor, thus promoting the regular production of land cover maps at the national scale through automatic classification of satellite images (Borak and Strahler 1999, Clevers et al.
2007). In Table 1.1, one presents the main technical characteristics of MODIS, MERIS, NOAA-AVHRR and Landsat ETM+ images.
Table 1.1. MODIS, MERIS, NOAA-AVHRR and Landsat ETM+ main technical characteristics.
Sensor
MODIS MERIS NOAA-AVHRR Landsat ETM+
Spatial resolution
250 m (spectral bands 1-2)
500 m (spectral bands 3-7)
1000 m (spectral bands 8-36)
300 m (spectral bands 1-15)
1200 m (spectral bands 1-15)
1100 m (spectral bands 1-5)
30 m (spectral bands 1-5, 7)
60 m (spectral band 6)
Temporal
resolution 2 days 3 days Twice-daily 16 days
Spectral resolution
405-14.385 nm (36 spectral bands)
Visible (10 spectral bands)
Reflective Infra-Red (9 spectral bands)
Thermal Infra-Red (17 spectral bands)
390-1040 nm (15 spectral bands)
Visible (9 spectral bands)
Reflective Infra-Red (6 spectral bands)
580-12.500 nm (5 spectral bands)
Visible (1 spectral band)
Reflective Infra-Red (1 spectral bands)
Thermal Infra-Red (3 spectral bands)
450-12.500 nm (7 spectral bands)
Visible (3 spectral band)
Reflective Infra-Red (3 spectral bands)
Thermal Infra-Red (1 spectral band)
Radiometric
resolution 12 bits 12 bits 10 bits 8 bits
1.3.2.Problem statement
Whereas the value of satellite images for frequent automatic mapping of land cover distribution and assessment of land cover dynamics is evident, and the need for updated land cover maps is clear, there is a lack of land cover products for national land cover applications. To effectively track land cover composition over national territories and monitor effective land cover changes, it is important that the technical characteristics of land cover products, namely the thematic content, the spatial scale, the date and periodicity of production, and the respective thematic accuracy are adequate (Foody 2002, Pal and Mather 2003, Treitz and Rogan 2004). Indeed, an important concern about land cover mapping for numerous scientific, policy, planning and management purposes is the consistency and reproducibility of the derived land cover products (Cihlar 2000). If the technical characteristics of land cover maps vary across time and space, then it is impossible to properly monitor land cover changes. Therefore, the active involvement of local experts can also help to produce an accurate and repeatable land cover characterization database (Giri et al. 2005).
Current land cover characterization programs
In the last years, several operational land cover mapping programs were established at global (e.g. MODIS Land Cover (MOD12Q1; Hodges 2001, Friedl et al. 2002), Global Land Cover 2000 (GLC2000; Bartholomé and Belward 2005)), regional (e.g. Co-ordination of Information on the Environment (CORINE) Land Cover map for 2000 (CLC2000; EEA 2002), National Land Cover Database (NLCD 2001; Homer et al. 2004)) and national (e.g.
(1) Periodicity of production. Land cover information produced in the framework of the existing mapping programs is not compatible with the temporal resolution of land cover dynamics. To serve as an input feature for environmental models and resource applications, the land cover information should be updated at least on a yearly basis (e.g. for forest fire prevention (Caetano et al. 2004)). However, there are several factors that hinder the regular production of land cover maps from satellite images, namely those related with economic and time costs of the used mapping protocols. On the one hand, and regarding the land cover maps produced by visual interpretation of satellite images, such as CLC2000 and COS’90, their regular production is not practicable on an operational basis because of the time used for: 1) image interpreters training; 2) manual delineation of land cover polygons on computer screen; and 3) harmonization of the final product to avoid discrepancies between individual image interpretations. Moreover, because the production process is labour-intensive, it is also economically expensive. So, the manual production of land cover databases from visual interpretation of satellite images no longer provides the map requirements on due time for most national agencies.
On the other hand, and looking now at the land cover maps produced by automatic classification of satellite images (e.g. MOD12Q1, GLC2000, and NLCD 2001), there is a difficulty in their regular production that is mainly related to the respective scale of application. Because these products are derived at global and regional scales, there are several specific steps within the standard mapping protocol that make their production extremely expensive, slow and difficult to support on a regular basis, namely: 1) the worldwide training sample acquisition; 2) the image compositing process; 3) the geometric, atmospheric and radiometric corrections (as well as the radiometric harmonization of many satellite images); 4) the classification process (usually, the characterization of land cover areas over the global surface is performed through multi-step approaches, e.g. Bartholomé and Belward (2005)); and 5) the final harmonization of the global product (i.e. post-processing).
The thematic detail of the adopted land cover nomenclature for both manual and automatically derived products has also a strong consequence on the frequency of land cover maps production: detailed thematic contents make the maps production slower than the production of maps with broad nomenclatures.
models requirements (Cihlar 2000). From a national application perspective, we remark that land cover nomenclatures of global and even regional products may not be adequate to use as input features for most tasks. The thematic content of global maps is extremely generic to assemble in few cover types all regional specificities occurring on the Earth’s surface. Therefore, the broad cover classes of global maps’ nomenclatures are most of the times useless to depict national specific land cover types (Giri et al. 2005). As a consequence, the thematic information in global land cover products is insufficient to detect the land cover changes and properly follow the dynamics of human induced disturbances that occur at finer scales (Rogan and Chen 2004).
Moreover, the nomenclatures of the existing land cover products are difficult to link (Giri et al. 2005). The national, regional and global maps are produced by different institutions and to address different and specific requirements. As a consequence, and even if produced at sequential times, the different maps may not be used to monitor land cover dynamics because their thematic content is different (Giri et al.
2005). This problem emphasizes the need for a worldwide hierarchical land cover nomenclature that comprises all global cover types at the base level and in turn that splits itself naturally into specific cover types at different superior levels according to the geographic region of interest and spatial scale of analysis.
(3) Spatial resolution and geographical coverage. Thematic land cover maps derived from satellite images are usually distributed on a regular spaced lattice that corresponds to the satellite sensor spatial resolution for images acquisition. Accordingly, the spatial resolution of land cover maps derived from coarse spatial resolution satellite images, i.e. global maps, is not adequate to represent most of landscape characteristics and track land cover changes at the national and regional scales (Treitz and Rogan 2004). Indeed, in a previous study (Carrão 2002), we showed that the landscape features in Continental Portugal can be perfectly represented with minimum mapping units smaller than 9 ha, i.e. with maps that have spatial resolutions higher than 300 m. Land cover maps with 1km2, such as
To overcome this situation, many scientific studies at the regional and national geographic scales have been projected with satellite images of 10-30m spatial resolutions (Cohen and Goward 2004). However, the use of these data is not appropriate in the context of an operational mapping program for national applications due to their limited spatial extend and low revisit time (Clevers et al.
2007). Because high spatial resolution satellite images (e.g. Landsat ETM+) just cover a small proportion of the national territories, it is also necessary to merge a set of neighbor images acquired under different conditions to completely cover the national surface. So, as radiometric characteristics of different images are difficult to harmonize, the existing differences can affect the classification results (Cihlar 2000). The classifiers performances are usually diminished because pixels of the same land cover class are affected by different radiometric disturbances in different images and present dissimilar spectral characteristics (Lu and Weng 2007).
(4) Thematic accuracy. Remote sensing data has a considerable potential for the regular provision of land cover maps, but the accuracy of the maps derived is often viewed as insufficient. It is reckoned that global land cover products present smaller overall accuracies for certain particular areas of interest than depicted by producers. For example, MOD12Q1 producers claim overall accuracies between 75-80% (Giri et al. 2005), whereas the validation of this product for Portugal does not exceed 57% accuracy (Cerdeira et al. 2006). In addition, comparison of MOD12Q1 with CLC2000, within the same region, showed an only 50% agreement between the two products (Caetano and Araújo 2006). Whereas the required thematic accuracy for different applications may be different, it is obvious that 50% overall accuracy is far from what is required for the evaluation of stresses on the environment and establishment of national policies concerning the prevention and mitigation of natural and human-induced pressures.
remotely-sensed data sets, which serve as input features for the classifier, is not sufficient to detect their subtle differences (Borak and Strahler 1999). On the other hand, but regarding also the thematic content of land cover nomenclatures, we can not afford to discriminate between neighbor land cover classes’ individuals that are smaller than the spatial resolution of satellite images used for classification (Treitz and Rogan 2004).
Furthermore, there are also problems related to the selected classification approaches, which are not adequate to discriminate all classes in the land cover nomenclature (Foody 2002, Pal and Mather 2003).
Finally, the accuracy assessment protocols used to evaluate the thematic quality of land cover maps are usually not adequate. Users and producers sometimes resort to accuracy assessment approaches that do not respect the probabilistic designs that were used to collect the testing samples, whereas a correctly performed statistical accuracy assessment is the core of the validation process (Stehman and Czaplewski 1998). The most common errors for reporting maps correctness concern the incorrect calculation of the variance for the accuracy estimators (Stehman 1996). The complications related with the correct variance estimation are mainly due to the comparison of the map classification with (Stehman 2001, Foody 2002): 1) the classifier training sample; 2) the testing samples deterministically selected over the study area and that are geographically correlated; 3) other existing land cover maps that are also representations of the truth and not the reference data. Moreover, and most of the times, estimators properties are not correctly used for the calculation of the respective confidence intervals (Stehman and Czaplewski 1998).
In Chapter 1.3.1, we claimed that the technical characteristics of MODIS and MERIS sensors are adequate to tackle most of the presented land cover characterization issues. Therefore, in this research, we focus on the analysis of multispectral time series sets of MODIS and MERIS images for the regular production of land cover products for national scale applications and on the use of probabilistic techniques for the statistical accuracy assessment of those products. Nevertheless, we need to overcome some data analysis problems that still hamper their effective use and that we introduce afterwards.
Data analysis
land cover dynamics can be better guaranteed through the time series analysis of images acquired by those sensors (Clevers et al. 2007). Nevertheless, we can not simply take a time series set of daily acquired medium spatial resolution satellite images with high spectral resolution, and expect that a standard classifier will accurately distinguish between the land cover classes of interest! There is no supervised or unsupervised black box like this! Thus, there is a growing necessity for the development of methods to extract the information contained in those remotely-sensed data sets in the framework of real world operational applications.
Because the dimensional feature spaces of multispectral time series sets of MODIS and MERIS remotely-sensed data are extremely large, the use of standard classifiers to automatically discriminate between individuals of numerous land cover types is not straightforward (Lu and Weng 2007). In fact, the use of multitemporal data from medium spatial resolution satellite images increases the dimensional feature space of multispectral input data sets for classification, while increasing the classification complexity (Maxwell et al. 2002). Therefore, if the standard parametric land cover classification approaches were unsuccessful before for smaller data sets, it is likely that they still fail for classifying these new high-dimensional remotely-sensed data sets. The main problem is that the size of the training data set, which is required to manage the within-classes’ variances in a standard supervised parametric automatic classification process, increases with the augment of both multitemporal and multispectral dimensions of the medium spatial resolution satellite images (Hughes 1968, Jackson and Landgrebe 2001, Guyon and Elissee 2003). Because training sample acquisition is time-consuming, labour-intensive and economically expensive, the collection process is usually disregarded by producers and the sample size is not enough to deal with the classification task (Mathur and Foody 2006). Therefore, standard algorithms often fail to deliver high classification accuracies and tend to suffer from the problem of the “curse of dimensionality” (Hughes 1968).
Nowadays, there are already innovative classification techniques, such as the Support Vector Machines (SVM) (Vapnik 1998), that theoretically overcome the large dimensional feature space problem associated with the standard automatic classification techniques (Müller et al.
take processing times that are not yet affordable (Huang et al. 2002). Therefore, although they work very well under experimental conditions (Meyer et al. 2003), previous studies suggest that their effective use on an operational remote sensing application is far from optimal (e.g. Huang et al. 2002).
Nonetheless, if we do not collect the appropriate set of observations for training the SVM classifier, within the context of a large dimensional feature data set, it is also difficult, if not impossible, to go from experimental to real scenarios without generalization lost (Pal and Mather 2003). The problem is that we may incur into training overfitting (Van Niel et al.
2005); the training accuracy is perfect, but the learning machine lacks generalization to deal with multiple real world within-classes’ differences (Landgrebe 2002).
Therefore, the answer for the problem related to the automatic land cover mapping at the national scale from time series sets of multispectral satellite images may not only depend on the selected classifier. As land cover dynamics is a time continuous evolution without frequent short time variations, it is expected the correlation between time sequential multispectral images and vegetation indices to be high (Borak and Strahler 1999, Maxwell et al. 2002, Lu and Weng 2007). Indeed, the use of high frequency time series can be a source of noise for automatic classification and of high processing time without effective gains in classification accuracy (Maxwell et al. 2002, Knight et al. 2006). Moreover, the combination of multispectral information from indiscriminate dates may decrease the classification accuracy instead of improving it (Knight et al. 2006, Lu and Weng 2007). Thus, effective ways to reduce the dimensional feature space of these remotely-sensed data sets, while maintaining the key information for discriminating between cover types, is imperative and must be considered to easier the automatic land cover classification processes (Haertel and Landgrebe 1999, Landgrebe 2002, Guyon and Elissee 2003).
To tackle this problem, i.e. the dimensional feature space reduction, we focus on the analysis of the contribution of multitemporal and multispectral information from satellite images for land cover classes’ discrimination. In the sequence, we pursue the exploitation of multitemporal images and investigate a mathematical function to methodically describe the intra-annual evolution of multispectral data and vegetation indices for disparate land cover classes. The goal is to optimize time information usage for the characterization of land cover distribution and land cover monitoring. Parametric models, like the one we propose, perform a dimension reduction to meet a trade-off between the searching space dimension and the number of classes to be differentiated, and optimize the classification performances (Bradley
1.3.3.The line of research
Several authors have already focused on the problem of automatic land cover mapping from multitemporal and multispectral satellite images of medium spatial resolution (e.g. Borak and Strahler 1999, Maxwell et al. 2002, Clevers et al. 2007, Dash et al. 2007). However, the differences in the selected land cover nomenclatures, the used classification approaches, the attained land cover products and respective thematic accuracies highlight the potential for further work in this field.
In this research, we explore the use of multitemporal information from multispectral satellite images for land cover characterization. In detail, one investigates the usefulness of time series sets of medium spatial resolution satellite images for the regular land cover mapping and land cover monitoring at the national scale. To tackle this issue, we follow a rigorous process in three main steps: 1) assessment of the multitemporal information contribution for land cover classes discrimination at the national scale; 2) definition of an exhaustive land cover mapping protocol for the automatic production of a land cover map with a set of multitemporal satellite images and respective accuracy assessment; and 3) development of a model to fit time series sets of multispectral satellite images for optimizing time information usage for the characterization of land cover distribution and land cover monitoring.
This study focus on satellite images time series acquired by MODIS and MERIS sensors over the Earth’s surface. The selected study area is the Portuguese mainland territory, located in the South-West area of Europe. The spatial resolution of the satellite images under analysis are well adapted to the landscape characteristics of the study area, and these are sufficiently diversified to test different methodological approaches for the characterization of land cover types with distinct biophysical properties, i.e. Atlantic and Mediterranean.
To assist the comprehension of the whole research work, next we briefly describe the main research points of each stand-alone manuscript that constitutes the structure of this dissertation. In the first study of this research (Chapter 2), we focus on the assessment of the benefits of multitemporal information from multispectral satellite images for land cover classes’ discrimination in the framework of automatic classification. To tackle this issue and for evaluating the land cover classifications performed with single and multiple dates’ multispectral information, we use a Support Vector Machine (SVM) learning approach and a cross validation technique.
discrimination. In order to make this evaluation independent of some specific classifier, we propose the use of a metric based on the median Mahalanobis distance for the analysis of land cover classes’ separability on different temporal and spectral dimensional features spaces.
In the sequence, and after the analysis of the contribution of the multitemporal and multispectral satellites images information for land cover classes discrimination, in Chapter 4 we focus on the selection of the best medium spatial resolution satellite images, i.e. MERIS or MODIS, for the land cover characterization in Continental Portugal. In Chapter 5, we compare the automatic land cover classification accuracy attained with several standard supervised classifiers with that attained with a machine learning approach, i.e. the Support Vector Machines (SVM). The goal is to select the best classification technique to automatically discriminate between the land cover classes of interest at the national scale, by using the spectral and temporal information of the elected medium spatial resolution satellite images. Moreover, in Chapter 6 we compare these standard classifiers with an Artificial Neural Network (ANN) classifier, i.e. the Self-Organizing Maps (SOM).
In Chapter 7, we propose a probabilistic sampling design that aims at improving the testing sample collection and the accuracy estimators’ computation in the framework of a regular land cover mapping program. Afterwards, and following the specificities of the proposed sampling design, we collect a land cover sample database for the accuracy assessment of medium spatial resolution land cover maps within the Portuguese territory (Chapter 8). Within this study, we also propose the collection of ancillary information, namely a second reference label and nominal interpretation and location confidence ratings for each sample individual, to help in the posterior assessment of land cover maps thematic accuracy.
Following the outcomes of the previous stand alone manuscripts, we define in Chapter 9 a complete classification protocol and proceed with the automatic production of a land cover map with 16 classes for the study area of Continental Portugal. To evaluate the overall and specific thematic accuracies of this map, we use the testing sample database collected for the Portuguese territory.
approach for land cover characterization that simplifies the analysis of time series sets of satellite images by non-expert users. Moreover, this study preserves the continuity of this research, whereas allowing for posterior theoretical developments in the framework of remote sensing time series based applications.
1.4.
References
Anderson, J.F., Hardy, E.E., Roach, J.T. and Witmer, R.E. (1976). A land use and land cover classification system for use with remote sensor data. U.S. Geological Survey Professional Paper 964, U.S. Geological Survey: Washington, DC, 28 pp.
Bartholomé, E. and Belward, A.S. (2005) GLC2000: a new approach to global land cover from Earth observation data. International Journal of Remote Sensing, 26, pp. 1959-1977. Borak, J.S. and Strahler, A.H. (1999). Feature selection and land cover classification of a MODIS-like data set for a semiarid environment. International Journal of Remote Sensing, 20, 919-938.
Bradley, B.A., Jacob, R.W., Hermance, J.F. and Mustard, J.F. (2007). A curve fitting procedure to derive inter-annual phenologies from time series of noisy satellite NDVI data.
Remote Sensing of Environment, 106, 137–145.
Caetano, M., Freire, S. and Carrão, H. (2004). Fire risk mapping by integration of dynamic and structural variables. In R. Goossens, (Ed), Remote Sensing in Transition (pp. 319-326). Roterdam: Millpress.
Caetano, M. and Araújo, A. (2006). Comparing land cover products CLC2000 and MOD12Q1 for Portugal. In A. Marçal (Ed.), Global Developments in Environmental Earth Observation from Space (pp. 469-477). Rotterdam: Millpress.
Carrão, H. (2002). Caracterização da Estrutura da Paisagem: Modelação e Avaliação das Transformações na Representação da Ocupação do Solo. Trabalho Fim de Curso da Licenciatura em Engenharia Biofísica, Universidade de Évora, 138 pp.
Cerdeira, C., Araújo, A., Carrão, H. and Caetano, M. (2006). Validação das Cartografias Globais de Ocupação do Solo, GLC2000 e MOD12Q1, para Portugal Continental. In Actas do IX Encontro de Utilizadores de Informação Geográfica (unpaginated CD-ROM), 15 – 17 November 2006, Oeiras, Portugal.
Cihlar, J. (2000). Land cover mapping of large areas from satellites: status and research priorities. International Journal of Remote Sensing, 21, 1093-1114.
Clevers, J. G. P. W., Schaepman, M. E., Mücher, C. A., de Wit, A. J. W., Zurita-Milla, R. and Bartholomeus, H. M. (2007) Using MERIS on Envisat for land cover mapping in the Netherlands. International Journal of Remote Sensing, 28, 637-652.
Cohen, W.B. and Goward, S.N. (2004). Landsat's Role in Ecological Applications of Remote Sensing. Bioscience, 54, 535-545.
Curran, P.J. and Steele, C.M. (2005). MERIS: the re-branding of an ocean sensor.
International Journal of Remote Sensing, 26, 1781-1798.
Dash, J., Mathur, A., Foody, G.M., Curran, P.J., Chipman, J.W. and Lillesand, T.M., (2007). Land cover classification using multi-temporal MERIS vegetation indices. International Journal of Remote Sensing, 28, 1137-1159.
Di Gregorio, A. and Jansen, L.J.M. (2000). Land Cover Classification System. Rome. Italy: FAO, 179 pp.
EEA - European Environment Agency (2002). I&CLC2000 Technical Reference Document. Joint Research Centre, European Comission. Available online at:
http://terrestrial.eionet.eu.int.
Foley et al. (2005). Global Consequences of land use. Science, 309, 570-574.
Foody, G. (2002) Status of land cover classification accuracy assessment. Remote Sensing of Environment, 80, 185–201.
Foody, G. and Mathur, A. (2004). Toward intelligent training of supervised image classifications: directing training data acquisition for SVM classification. Remote Sensing of Environment, 93, 107−117.
Foody, G. M. and Mathur, A. (2006). The use of small training sets containing mixed pixels for accurate hard image classification: Training on mixed spectral responses for classification by a SVM. Remote Sensing of Environment, 103, 179-189.
Friedl, M.A., McIver D.K., Hodges J.C.F., Zhang X.Y., Muchoney D., Strahler A.H., Woodcock, C.E., Schneider A., Cooper, A., Baccini, A., Gao, F. and Schaaf, C. (2002). Global land cover mapping from MODIS: algorithms and early results. Remote Sensing of Environment, 83, 287-302.