www.ccarevista.ufc.br ISSN 1806-6690
Genetic divergence on castor bean using the ward-mlm strategy
1Divergência genética em mamoneira utilizando a estratégia ward-mlm
Ronaldo Simão de Oliveira2*, Simone Alves Silva3, Bruno Portela Brasileiro4, Everaldo Paulo Medeiros5 e
Edijane Valéria Araújo dos Anjos5
ABSTRACT - The objective of this work was to evaluate the genetic diversity in a segregating population F3 of castor bean in the Recôncavo Baiano using the Ward-MLM multivariate technique. The experiment was conducted at the Universidade Federal do Recôncavo da Bahia between April 2009 and March 2010. The 259 genotypes used were derived from crosses between the BRS 149 Nordestina, BRS 188 Paraguaçu, EBDA MPA-17, Sipeal 28 and Mirante 10 varieties. The design was in randomized complete blocks with four replicates in spacing of 3x1 m. The number of days to the appearance of the first female flower, plant height (cm), number of racemes emitted per plant, total length of the raceme (cm), raceme weight (g), fruit weight per plant (g), number of seeds per raceme, number of seeds per plant, weight of seeds per raceme (g), productivity (kg ha-1) and oil content in seeds (%) were evaluated. The formation of
four groups occurred as follows: Group I with 84 genotypes, Group II with 142 genotypes, Group III with 15 genotypes and Group IV with 18 genotypes. The Ward-MLM strategy allows for an appropriate clustering between the genotypes, and the variables that contribute most to the divergence are: fruit weight per plant, weight of seed per raceme, raceme weight and productivity.
Key words: Castor beans. Plants-genetic improvement. Modified location model.
RESUMO - O objetivo deste trabalho foi avaliar a divergência genética em uma população segregante F3 de mamoneira no Recôncavo Baiano utilizando a técnica multivariada Ward - MLM. O experimento foi conduzido na Universidade Federal do Recôncavo da Bahia, entre abril de 2009 e março de 2010. Foram utilizados 259 genótipos descendentes de cruzamentos entre as variedades BRS 149 Nordestina, BRS 188 Paraguaçu, EBDA MPA-17, Sipeal 28 e Mirante 10. O delineamento foi em blocos completos casualizados com quatro repetições num espaçamento de 3x1 m. Avaliou-se o número de dias para o aparecimento da primeira flor feminina, estatura de planta, número de racemos emitidos, comprimento do racemo, peso de racemo, peso de fruto por planta, número de sementes por racemo, número de sementes por planta, peso de sementes por racemo, produtividade e teor de óleo na semente. Ocorreu a formação de quatro grupos, sendo o grupo I composto por 84 genótipos, o II por 142 genótipos, o III por 15 genótipos e o IV por 18. A estratégia Ward-MLM possibilitou um adequado agrupamento entre os genótipos, sendo que as variáveis que mais contribuíram para a divergência foram o peso de fruto por planta, peso de semente por racemo, produtividade e peso de racemo.
Palavras-chave: Mamona. Plantas-melhoramento genético. Modelo de locação modificado.
* Autor para correspondência
1Recebido para publicação em 22/11/2011; aprovado em 15/01/2013
Parte da Dissertação de Mestrado do primeiro autor apresentada ao Programa de Pós-Graduação em Ciências Agrárias da Universidade Federal do Recôncavo da Bahia/UFRB
2Departamento de Ciências Biológicas, Universidade Estadual de Feira de Santana/UEFS, Feira de Santana-BA, Brasil, [email protected] 3Centro de Ciências Agrárias, Ambientais e Biológicas, Universidade Federal do Recôncavo da Bahia/UFRB, Cruz das Almas-BA, Brasil, sas@
ufrb.edu.br
INTRODUCTION
The castor bean (Ricinus communis L.) is a
species largely grown in the Brazilian Northeast. However, the planting in the region has been done with unproductive and non-uniform local varieties (OLIVEIRA; ZANOTTO, 2008).
The identification of variability and knowledge of different genetic constitutions existing in segregating populations, is of fundamental importance for the identification of superior genotypes and the establishment of appropriate strategies to achieve improvement in the castor bean populations.
Studies on genetic diversity provide guidelines to identify these parents with favorable genes for the achievement of segregating generations and, consequently,
to obtain genetically improved subjects (COSTAet al.,
2006; FIGUEIREDO NETOet al., 2004; GONÇALVES
et al., 2009; ROCHA et al., 2009). In this sense, the
multivariate methods, have offered effective contributions in identifying genotypes for use in genetic improvement programs of various cultures, including the indication of the most representative traits in order to obtain genetically different populations (BENINet al., 2003).
In the prediction of genetic divergence, several multivariate methods can be applied. The choice of the most appropriate method has been determined by the accuracy desired by the researcher, the ease of analysis and by the way the data are obtained (BEZERRA NETO
et al., 2010; CARGNELUTTI FILHOet al., 2008). The
process most commonly used is the clustering method which basically involves two stages. The first stage relates to the estimate of a measure of similarity (or dissimilarity) between the parents and the second with the adoption of a clustering technique for group formation (CRUZ; REGAZZI; CARNEIRO, 1997).
Concerning castor bean, few studies of genetic divergence have been conducted, and the most used existing methods for data clustering were the Tocher
method used by Costa et al. (2006), Cavalcante et al.
(2008), Bezerra Neto et al. (2010) and the principal
components method, as reported by Milani, Dantas e
Martins (2009) and Bahiaet al. (2008).
The Ward-MLM procedure (1963), also known as the Minimum Variance method, allows the formation of groups by maximizing the homogeneity within groups. The idea underlining the method of Ward is the clustering ofRandSgroups that minimize the sum of squares within
groups, i.e., the sum of square errors (FERREIRA, 2008). The Modified Location Model (MLM) proposed
by Franco et al. (1998), classifies n subjects when p
quantitative variables and q qualitative variables are
obtained in an environment, assuming that m levels of
variableW and thep-multinormal variables for each sub-population are independent.
Thus, the Ward-MLM strategy consists of two stages, where the first groups are by the grouping method of minimum variance among groups proposed by Ward (1963) using the dissimilarity matrix provided by (GOWER, 1971). In the second stage, the mean of the vectors of the quantitative variable for each
sub-population, independent of the W values, is estimated
by MLM procedure (CABRAL et al., 2010; FRANCO
et al., 2003; FRANCO; CROSSA, 2002). Therefore, this
strategy allows one to define the optimal number of groups and calculate the average of groups with high accuracy, using all available information on the genotypes, whether quantitative or qualitative variables (CROSSA; FRANCO, 2004).
Moreover, this work was aimed at estimating the genetic divergence in a segregating population (F3) based on the Ward-MLM procedure, in order to subsidize the genetic improvement program of the castor bean for Recôncavo Baiano.
MATERIAL AND METHODS
This study was conducted between March 2009 and April 2010 in the experimental area of the Núcleo de Melhoramento Genético e Biotecnologia (Experimental Center of Genetic Improvement and Biotechnology) (NBIO), at the Universidade Federal do
Recôncavo da Bahia (UFRB), in Cruz das Almas, BA, at latitude 40º39’ S and longitude 39°06’23” W, and 220 m above sea level. According to the Köppen classification, the climate is characterized by a transition zone between areas Am (hot and humid climate with short dry season) and Aw (hot and humid with summer rainfall) and soil of Alic and Cohesive Yellow Latosol Type, clayey in texture and relief plan. The average annual rainfall is 1.170 mm, with average annual temperature of 24.1 °C and relative
air humidity of 80% (RIBEIROet al., 1995).
Each plot had 28 rows of 12 m with row spacing of 3 m and spaced 1 m from each other, resulting in 12 holes per row and 336 holes per plot. The borders were formed by lateral lines, with a useful area dimension of 10 m x 78 m.
The area was prepared by mowing, subsoiling, plowing and harrowing. For the correction of soil,
1000 kg ha-1 doses of dolomitic limestone were cast.
The holes had dimensions of 20 cm x 20 cm and were opened with the aid of a hoe. A fertilization of foundation was performed in the dosage of 20 kg ha-1N, 80 kg ha-1 P and 40 kg ha-1of K. The planting was done through the direct sowing in the field using three seeds per genotype.
After the emergence of the first true leaf growth, the thinning was carried out (leaving only one plant per
hole) and 40 kg ha-1of N were applied as top dressing
in furrows that were closed. Weeding and mechanized mowing were in order to eliminate the weeds. The phytosanitary treatments were performed according to crop need.
The number of days to the appearance of the first female flower (FLO) was evaluated (measured in number of days, when the plants were 50% of the female flowers open on the primary raceme from planting), plant height (cm) (PH) (was measured from the base of the plant until the last branch), number of racemes emitted per plant (NRE) (periodic counts were made during the crop cycle), total length of the raceme (cm) (TLR) (measured in the first three racemes of each plant with the aid of a millimeter ruler when it reached full maturity). The raceme weight (g) (WR), fruit weight per plant (g) (FWP), number of seeds per raceme (NSR), number of seeds per plant (NSP), weight of seeds per raceme (g) (WSR) was measured in the first three racemes of each plant and productivity (kg ha-1) (PRO) (estimated in accordance with the number of holes in the useful area and size of useful area). The weight traits were evaluated in semi-analytical scale.
The oil content in seeds (%) (SOC) was analyzed in the Laboratório Avançado de Tecnologia Química
da Embrapa Algodão(Advanced Chemical Technology
Laboratory of Embrapa Cotton), in Campina Grande,
PB. The technique of estimation of SOC was made by Low Field NMR (Nuclear Magnetic Resonance) for
1H, which is a nondestructive method in Oxford MQA
7005 instrument with a 0.47 T electromagnet. Initially the samples were kept for an hour in a controlled environment with temperature at 20 ºC and humidity of 60%. The acquisition of the spectra was done using a probe with an acrylic cylindrical tube, where the seeds were allocated while the results were obtained simultaneously on a computer- interfaced device.
Averages were estimated using the methodology of mixed models REML/BLUP using the (SELEGEN -REML/BLUP) software, according to Resende (2006). The cluster analysis of genotypes was carried out based on these averages by the Ward-MLM method using the SAS version 9.1.3 software (SAS, 2003).
RESULTS AND DISCUSSION
All continuous variables were significant at 5% probability by the F-test, demonstrating variability in the genotypes studied for these descriptores. The optimal number of groups was determined to be equal to four, according to the pseudo-F and pseudo-t2 statistics score and the log-likelihood function, obtained by the Ward-MLM strategy (Figure 1).
The risk profile graph associated with the likelihood ratio test showed that the largest increase in the likelihood function occurred at the group level four, and an increase of 26.94 could be observed. Everitt (1981), quoted by McLachlan and Basford (1988), suggests that this test can be used if the ratio n/p (number of observations to the number of variables) is greater than 5 and n> 5. In any case, the likelihood ratio or the growth of risk is a useful guide for defining the number of groups. The method can therefore define more precise criteria for group formation, resulting in less subjective groups of accessions. The risk profile graph has been used for different values of G and to identify the point of maximum growth as a criterion for defining the number
of groups (GONÇALVESet al., 2009).
Padilla et al. (2005), when studying 120
populations ofBrassica rapa subsp.RapaL. found that
the increase of the maximum of the likelihood function was reached when five groups were considered.
However, Ortizet al. (2008) evaluated corn races from
high altitudes in Peru and observed greater increases in the probability function at a level of four and eight groups (increase of 56.22 and 50.60, respectively).
According to Gonçalves et al. (2009), the number of
groups may vary depending on the species, the number of accessions and the number and type of descriptors.
For most traits, group I was superior to groups II and III, and lower than IV (Table 1).
Figure 1 - Graph of the logarithmic function of probability (log-likelihood) showing the optimum number of groups for the F3 segregating population of castor beans, Cruz das Almas, 2010
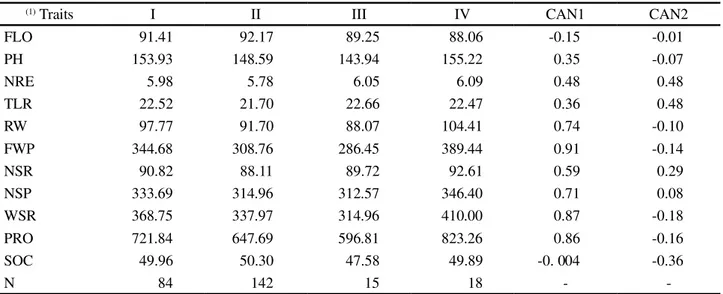
Table 1 - Average of 11 variables in each group and contribution of traits to the canonical variables (CAN1) and (CAN2) studied in an F3 segregating population of castor beans
(1) Traits I II III IV CAN1 CAN2
FLO 91.41 92.17 89.25 88.06 -0.15 -0.01
PH 153.93 148.59 143.94 155.22 0.35 -0.07
NRE 5.98 5.78 6.05 6.09 0.48 0.48
TLR 22.52 21.70 22.66 22.47 0.36 0.48
RW 97.77 91.70 88.07 104.41 0.74 -0.10
FWP 344.68 308.76 286.45 389.44 0.91 -0.14
NSR 90.82 88.11 89.72 92.61 0.59 0.29
NSP 333.69 314.96 312.57 346.40 0.71 0.08
WSR 368.75 337.97 314.96 410.00 0.87 -0.18
PRO 721.84 647.69 596.81 823.26 0.86 -0.16
SOC 49.96 50.30 47.58 49.89 -0. 004 -0.36
N 84 142 15 18 -
-FLO = number of days to the appearance of the first female flower, PH = plant height; NRE = number of racemes emitted per plant; TLR = total length of the raceme; RW = raceme weight; FWP = fruit weight per plant; NSR = number of seeds per raceme; NSP = number of seeds per plant; WSR = weight of seeds per plant; PRO = productivity; SOC = oil content in seeds; N = number of genotypes per group, (-) = does not contain information
and IV may be convenient, allowing high heterosis for the productivity trait and ultimately gain from the selection.
Group II comprised the largest number of genotypes (Table 1). In this group, 42 genotypes were derived from
188 Paraguaçu cultivar and the remaining 35% combined the genotypes derived from crosses between BRS 149 Nordestina with MPA 17 and Sipeal 28 cultivars. This group combined the genotypes with the highest averages for oil content. Cerqueira (2008), in assessing the behavior of these cultivars in Recôncavo Baiano for the SOC trait, noted that cultivars BRS 149 Nordestina and BRS 188 Paraguaçu were the cultivars with the highest average for oil content, with 53% and 48% respectively”.
On the other hand, this group (II) showed the longest cycle subjects, which are not interesting for the study area, since the longer these plants remain in the field, the more it can encourage the increase in pests and diseases, especially
the gray mold Amphobotrys ricini, which drastically
reduces crop yield in Recôncavo Baiano.
Group III presented the lowest averages for productivity, as well as the lowest raceme weight, weigth of seed per raceme, fruit weight per plant, number of seeds per plant and oil content in seeds (Table 1).
This group was composed of 15 genotypes, 14 of these originated from crosses using the EBDA MPA 17 cultivar. It can be inferred that this low productivity is related to the high degree of dehiscence of the fruits of this cultivar. Sampaio Filho (2009), when evaluating the five cultivars used in the partial diallel that gave rise to the F3 segregating population, noted that the EBDA cultivar MPA 17 achieved the lowest productivity, reaching only 282.83 kg ha-1.
Nonetheless, group III covered the genotypes of lesser stature (Table 1). Despite these genotypes presenting the worst averages for most of the traits they are important for the program, because the short stature trait is favorable, since varieties of small size are desirable in mechanized cultivation.
From the four groups formed by the Ward-MLM strategy, group IV showed the most promising subjects. This group consisted of 18 genotypes (Table 1), and 13 of them were derived from crosses using the Sipeal 28 cultivar.
The productivity averages observed in group IV were higher compared to other groups. Bahiaet al. (2008),
on assessing the parents that gave rise to this population (F3), obtained high productivity values for the Sipeal 28 cultivar, with an average of 1347 kg ha-1. This group also combined the genotypes with the highest averages for the number of racemes emitted per plant, weight of raceme, number of seeds per raceme, weigth of seed per raceme, fruit weight per plant, number of seeds per plant and oil content in seeds roughly equal to other groups (Table 1). Furthermore, it had the lowest average for flowering. Thus, we can infer that this group has the genotype most likely to lead to further strains with earliness and high productivity. Regarding the traits evaluated, those that contributed most to genetic diversity based on the first canonical variable was the weight of fruit per plant, weight of raceme per plant, yield and number of seeds per plant. Different results were found by Costa et al. (2006), who
when studying the castor bean accessions and cultivars found that the onset of flowering, plant height, oil content in seeds and effective length of the primary raceme were traits with the highest contribution to the divergence, while the yield potential was the variable that contributed least to the genetic divergence.
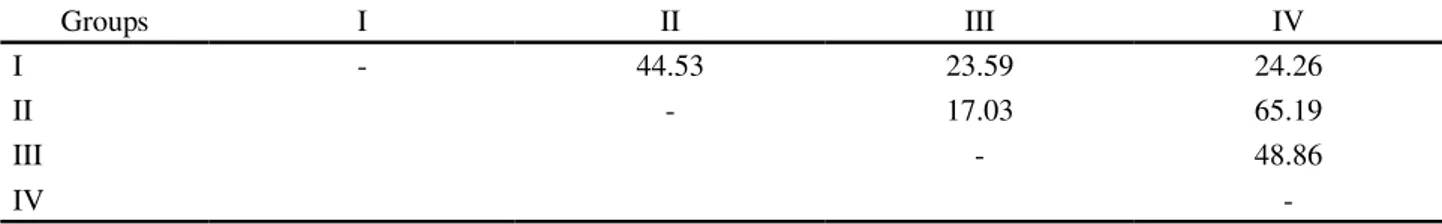
The dissimilarity of the groups based on the Mahalanobis distance by the Ward-MLM strategy, demonstrated a range of variation in the 48.16 value, while groups II and III were the closest, while groups II and IV were the most distant (Table 2). The crosses between groups II and IV may be performed in order to exploit heterosis in getting transgressive subjects for production traits.
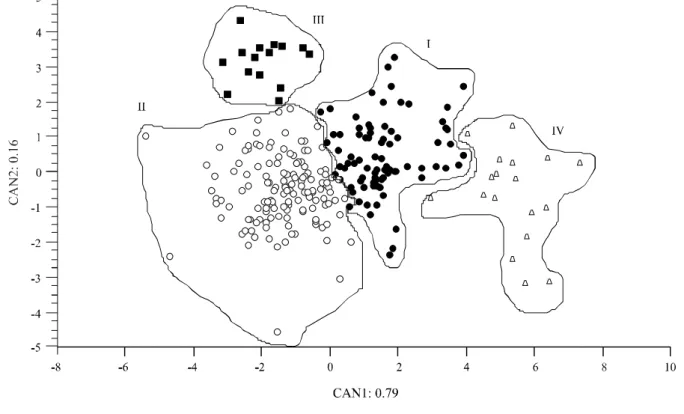
The first two canonical variables obtained by the Ward-MLM methodology explained 95% of the total variation (Figure 2), and enabled to visualize the genetic variability in the segregating population by graphic dispersion analysis. Barbé (2009), using the same procedure on bean pods obtained 96.0% of the total variation in lineages and said that this high value indicates that the graphic representation of the first two canonical variables is adequate to verify the relationship between groups and subjects within a group. Costa et al. (2006), obtained similar results for
castor bean.
Table 2 - Separation of clusters by the Ward-MLM strategy in an F3 segregating population of castor beans, based on the
Mahalanobis distance
Groups I II III IV
I - 44.53 23.59 24.26
II - 17.03 65.19
III - 48.86
-The selection in segregating generations
should take into account the genetic diversity, per se
performance of parents and complementary allele. Thus, it appears that the F3 segregating population of castor bean shows promising genotypes for the selection of traits of interest for the cultivation in Recôncavo Baiano.
CONCLUSIONS
1. Estimates of genetic divergence based on the Ward-MLM procedure allowed to identify variability in the F3segregating population of castor bean, as well as enabling coherent groups to be formed;
2. The most promising genotypes for selection in the program belong to group IV, due to its good performance for all the traits, especially for productivity, earliness and the oil content in seeds;
3. The characters that contributed most to genetic diversity is the fruit weight per plant, weight of raceme per plant, productivity, weight of raceme and number of seeds per plant.
Figure 2 -Graphic dispersion of the first two canonical variables (CAN1 and CAN2) representing the formation of four groups by the Ward-MLM strategy in an F3 segregating population of castor beans, Cruz das Almas, 2010
REFERENCES
BAHIA, H. F.et al. Divergência genética entre cinco cultivares de mamoneira.Pesquisa Agropecuária Brasileira, v. 43, n. 3, p. 357-362, 2008.
BARBÉ, T. C.et al. Association between advanced generations and genealogy in inbred lines of snap bean by the Ward-Modified Location Model.Euphytica, v. 173, n. 3, p. 337-343, 2009.
BENIN, G.et al. Comparações entre medidas de dissimilaridade e estatísticas multivariadas como critérios no direcionamento de hibridações em aveia.Ciência Rural, v. 33, n. 4, p. 657-662, 2003.
BEZERRA NETO, F. V. et al. Descritores quantitativos na estimativa da divergência genética entre genótipos de mamoneira utilizando análises multivariadas.Revista Ciência Agronômica,
v. 41, n. 2, p. 294-299, 2010.
CABRAL, P. D. S.et al. Quantification of the diversity among common bean accessions using Ward-MLM strategy.Pesquisa
CERQUEIRA, L. S.Variabilidade genética e teor de óleo em mamoneira visando ao melhoramento para região de baixa altitude. 2008. 57 f. Dissertação (Mestrado em Ciências Agrárias) - Centro de Ciências Agrárias e Ambientais e Biológicas, Universidade Federal do Recôncavo da Bahia, Cruz das Almas, 2008.
COSTA, M. N et al. Divergência genética entre acessos e cultivares de mamoneira por meio de estatística multivariada.
Pesquisa Agropecuária Brasileira, v. 41, n. 11, p. 1617-1622, 2006.
CROSSA, J.; FRANCO, J. Statistical methods for classifying genotypes.Euphytica, v. 137, p. 19-37, 2004.
CRUZ, C. D.; REGAZZI, A. J.; CARNEIRO, P. C. S.Modelos biométricos aplicados ao melhoramento genético. Viçosa: UFV, 1997. 390 p.
EVERITT, B. S. A Monte Carlo investigation of the likelihood ratio test for the number of components in a mixture of normal distributions.Multivariate Behavioral Research, v. 16, n. 2, p. 171-180, 1981.
FRANCO, J.et al. Classifying genetic resources by categorical and continuous variables.Crop Science, v. 38, n. 6, p.
1688-1696, 1998.
FRANCO, J.; CROSSA, J. The Modified Location Model for classifying genetic resources: I. Association between categorical and continuous variables.Crop Science, v. 42, n. 5, p.
1719-1726, 2002.
FRANCO, J. et al. A Multivariate Method for Classifying Cultivars and Studying Group Environment Trait Interaction.
Crop Science, v. 43, n. 4, p. 1249 - 1258, 2003.
FERREIRA, D. F.Estatística multivariada. Lavras: Ed. UFLA, 2008. 382 p.
FIGUEIREDO NETO, A. et al. Divergência genética em acessos de mamona (Ricinus communis L.) baseada nas características de semente.Revista de Biologia e Ciências da Terra, v. 4, n. 2, p. 1-10, 2004.
GONÇALVES, L. S. A. et al. Heirloom tomato genebank: assessing divergence based on morphological, agronomic and molecular data using Ward-MLM. Genetic and Molecular Research, v. 8, n. 1, p. 364-374, 2009.
GOWER, J. C. General coefficient of similarity and some of its properties.Biometrics, v. 27, n. 4, p. 857-874, 1971.
MCLACHLAN, G. J.; BASFORD, K. E. Mixture models, inference and applications to clustering. Marcel Dekker:
New York, 1988.
MILANI, M.; DANTAS F. V.; MARTINS, W. F. S. Divergência genética em mamoneira por caracteres morfológicos e moleculares. Revista Brasileira de Oleaginosas e Fibrosas,
v. 13, n. 2, p. 61-71, 2009.
OLIVEIRA, I. J.; ZANOTTO, M. D. Eficiência da seleção recorrente para redução de estatura de plantas em mamoneira (Ricinus communis L.). Ciência e Agrotecnologia, v. 32, n. 4,
p.1107-1112, 2008.
ORTIZ, R.et al. Classification of Peruvian highland maize races using plant traits.Genetic Resource and Crop Evolution, v. 55, n. 1, p. 151-162, 2008.
PADILLA, G.et al. Genetic diversity in a germplasm collection
of Brassica rapa Subs. rapa L. from northwestern Spain.
Euphytica, v. 145, n. 1/2, p. 171-180, 2005.
RIBEIRO, L. P. et al. Levantamento detalhado dos solos, capacidade de uso e classificação de terras para irrigação da Estação de plasticultura da Universidade Federal da Bahia/ Politeno em Cruz das Almas (BA). Revista Brasileira de Ciência do Solo, v. 19, p. 105-113, 1995.
RESENDE, M. D. V. O Software Selegen-REML/BLUP.
Campo Grande: Embrapa, 2006. 305 p.
ROCHA, M. C.et al. Descritores quantitativos na determinação da divergência genética entre acessos de tomateiro do grupo cereja.Ciência Rural, v. 39, n. 3, p. 664-670, 2009.
SAMPAIO FILHO, O. M.Análise descritiva, agrupamento e análise de trilha de cultivares de mamoneira em dois anos de cultivo em Cruz das Almas – BA. Cruz das Almas - BA, 2009. 78 f. Dissertação (Mestrado em Ciências Agrárias) - Centro de Ciências Agrárias e Ambientais e Biológicas, Universidade Federal do Recôncavo da Bahia, Cruz das Almas, 2009. SAS INSTITUTE. SAS language and procedures: Usage.