Received March 18, 2009 and accepted May 11, 2010. Corresponding author: paulof_adami@hotmail.com
Dynamic of a papuã pasture under two grazing intensities and two nitrogen
levels
Paulo Fernando Adami1, André Brugnara Soares2, Tangriani Simione Assmann2, Alceu Luiz Assmann3, Laércio Ricardo Sartor1, Christiano Santos Rocha Pitta1, Marcia Fernanda
Franchin1, Francisco Migliorini4
1Programa de pós-graduação em Agronomia – UTFPR – Pato Branco. 2Curso de Agronomia – UTFPR – Pato Branco.
3Instituto Agronômico do Paraná – IAPAR. 4Curso de Agronomia da UTFPR – Pato Branco.
ABSTRACT - This work aimed to evaluate the effects of grazing intensities and nitrogen fertilization levels on the dynamics of a Brachiaria plantaginea pasture. The experiment was laid out as a random block design, in a 3 × 2 factorial scheme,
composed of three nitrogen levels (0, 200 and 400 kg/ha nitrogen in urea form) and two grazing intensities termed low mass (LM; forage mass of 1500 kg of DM/ha) and high mass (HM; forage mass of 3000 kg of DM/ha) in a continuously stocked swards with two replications. Animals used were half-blood Boer goats averaging five months old and 21 kg body weight (BW) for adjustment of the target forage mass. Real forage mass, average height of the plants and animal stocking rates were of 2,567 and 3,862 kg DM/ha; 23.6 and 31.2 cm and 2,804 and 2,089 kg BW/ha respectively for low and high mass. Accumulation rate was of 100, 147 and 132 kg DM/ha/day and total production 13,659; 19,834 and 17,820 kg DM/ha, respectively to the 0, 200 and 400 kg N/ha. There were no differences on pasture yield among grazing intensities suggesting that higher stocking rates can be used. The level of 200 kg N/ha promotes the best response on papuã grass pastures. Papuã grass shows high yield, good production distribution during the plant cycle and excellent nutritional value.
Key Words: Brachiaria plantaginea, forage production, forage nutritive value, forage sward, reseeding, stocking rate
Dinâmica de uma pastagem de capim-papuã sob duas intensidades de
pastejo e dois níveis de nitrogênio
RESUMO - Objetivou-se avaliar a influência da intensidade de pastejo e dos níveis de abubação nitrogenada sobre a dinâmica de uma pastagem de Brachiaria plantaginea. O delineamento experimental adotado foi o de blocos ao acaso, em esquema fatorial 3 × 2, composto de três níveis de adubação nitrogenada (0, 200 e 400 kg/ha de nitrogênio na forma de ureia) e duas intensidades de pastejo (1.500 e 3.000 kg de MS/ha, respectivamente, para as massas baixa e alta em pastejo com lotação contínua e taxa de lotação variável), totalizando seis tratamentos, cada um com duas repetições. Foram utilizados caprinos meio-sangue Boer com 5 meses de idade e peso médio de 21 kg de peso vivo (PV) para ajuste das massas de forragem preconizadas. A massa de forragem real, a altura média das plantas e a carga animal foram de 2.567 e 3.862 kg de MS/ha; 23,6 e 31,2 cm; e 2.804 e 2.089 kg de PV/ha respectivamente para as massas baixa e alta. A taxa de acúmulo foi de 100, 147 e 132 kg de MS/ha/dia e a produção total, de 13.659, 19.834 e 17.820 kg de MS/ha, respectivamente para as doses de 0, 200 e 400 kg de N/ha. Não houve diferença na produtividade da pastagem entre as intensidades de pastejo, logo maior carga animal pode ser utilizada. O nível de 200 kg de N/ha promove a melhor resposta em pastagens de papuã. O capim-papuã tem alta produtividade, boa distribuição da produção ao longo do ciclo e excelente valor nutricional.
Palavras-chave: Brachiaria plantaginea, carga animal, estrutura da pastagem, produção de forragem, ressemeadura natural, valor nutritivo
www.sbz.org.br
Introduction
In southern Brazil, integrated systems of production, such as the crop-livestock system are largely used. For this system, the use of annual summer forage is a good
There is also another forage species, commonly called as papuã (Brachiaria plantaginea), known as a weed plant of annual crops such as corn and soybean.
According to Restle et al. (2002), papuã is an annual species of natural reseeding abilities and frequently appears spontaneously in southern Brazil from the beginning of spring, offering high forage production of good quality and potential for animal production. Despite the large diffusion of the B. plantaginea, there are few researches that evaluated the potential of this specie as forage, most of them concerned to its weed potential. However, once considering the conceit of weed as an unwanted species in a certain place (Shaw, 1982), depending on the adopted system, this species can be classified as wanted and not harmful. Through data research, this species might be seen differently by the farmers becoming well adopted, just as the manner ryegrass was seen in the past and it is used nowadays.
After choosing the species to be used, the adopted management adopted is the most important parameter of the production system, being the grazing intensity and the nitrogen levels key factors to the success of the activity. Grazing intensity is the major factor affecting the primary (vegetable production) and secondary (animal production) production once it is directly related with the productive components of the system (Nabinger, 2005). Nitrogen fertilization, on the other hand, is the element that limit forage production at most (Hart & Burton, 1965), positively influencing factors like forage quality, dry matter production and its distribution and the animal production, in which the magnitude of its importance dependent on the used levels. It is also important because of its high price and environmental problems that it causes when used in an incorrect manner.
Thus, this study was designed to address the effects that grazing intensity and nitrogen levels have on forage production, forage quality, forage sward (leaf:stem, plant height) and on the used stocking rate.
Material and Methods
This work was carried out at the experimental unit of the Instituto Agronômico do Paraná – IAPAR, Pato Branco – PR.The experimental area is located in the the third plateau physiographic region, between the coordinates 25º 07' S and 52º 41' E with an average altitude of 700 m. The climate of the region is subtropical humid, according to the Köppen classification (Maak, 1968). The soil at the experimental site is classified as Oxisol. During the research period, from November 2007 to March 2008, the monthly average
temperature and the precipitation was of 21; 22.5; 22.5; 23 and 22°C and 200; 165; 80; 150 and 80 mm respectively. The experiment used a random block design in a 3 × 2 factorial scheme composed by three nitrogen levels (0, 200 and 400 kg of N/ha using urea) and two grazing intensities (1,500 and 3,000 kg of DM/ha respectively to the low mass and high mass treatment with a continuous stocking rate grazing method), totaling six treatments with two replications for each treatment.
It was evaluated the forage accumulation (kg of DM/ha/ day), the total dry matter production, the forage sward through the evaluation of the plants height and the leaf:stem ratio, the pasture nutritive value and the caring capacity from the hypotheses that different grazing intensity and nitrogen levels interfere in different manners on vegetable and animal production. The fertilization of the area was performed according to recommendations of the soil fertilization manual, Rolas (2004), and according to the values found in the soil analyses, which were the following: pH-CaCl2 = 6.3; P = 10.07 mg/dm³; K = 293.25 mg/dm³; 5.7% of organic matter; Ca = 8.7 cmolc/L; Base saturation = 78% and CEC = 17.49%. It was used 60 kg/ha P2O5 as recommended for summer grasses. Nitrogen fertilizations were divided into 4 applications, corresponding to the tested levels, topdressing apllied by manualy spreading on the following dates: November 20th, January 11th, January 29th and February 20th, always observing the weather conditions and moisture level to make the best use of N by the system. The nitrogen source used was urea with a concentration of 45% N.
The establishment of Brachiaria plantaginea was by natural reseeding due to the presence of plants in the area in the prior year. It was used a 1.39-ha area divided in 12 paddocks which constituted the experimental units, and 0.2 ha as an additional area for extra animals. The paddocks were separated by a closely-spaced woven wire fence and two electrified smooth wire at the ground-level to prevent goats digging beneath the fence and to keep the animal into the paddocks. In each paddock, the animal had access to water and artificial shadows (6 × 3 meters).
forage mass from ten visual estimations to each paddock were used at the regression equations. The forage mass of the paddock was estimated for each evaluator in which the correlation coefficient was above 0.75 (Gardner, 1986). From the cut samples, it was taken a small sample of green forage mass, which was weighted and dried in a forced-air oven at 60oC until constant weight to adjust the forage mass with the real percentage of dry matter. The found forage mass values were used to adjust the stocking rate aiming at managing forage at the target mass. When the forage mass values were above the target value, according to the grazing intensity to each paddock, the stocking rates were increased and vice-versa.
The grazing method used was the continuous stocking rate, using the put and take method described by Mott & Lucas (1952), to adjust the forage mass. The animal species used was goat, half blood Boer at an average age of 5 months and 21 kg of body weight (BW). Three testing animals to each paddock and a changeable number of extra animals to adjust the forage mass were used in the experiment. From the forage mass sample, sub-samples were taken out to verify the leaf:stem ratio, which were manually separated. The leaf:stem ratio was obtained by dividing the leaf dry matter weight by the steam dry matter weight. The measurements of the plants height were done using a sward stick, considering the distance from the soil level to the touch of the stick marker in the first leaf.The measurements of the plants (50 samples to each paddock) height were done using a sward stick, considering the distance from the soil level to the touch of the stick marker in the first leaf. Evaluations were carried out over pasture life span. The first evaluation was performed at the moment that the animals entered the paddocks and the next ones were realized every 21 days. The forage density was obtained by the division of the forage mass by its height.
The evaluations of the forage accumulation (kg of DM/ ha/day) were done on average at every 21 days, by using two grazing exclusion cage to each experimental unit, using the technique described by Moraes et al. (1990). The forage production of each period was obtained by the multiplication of the dry matter accumulation rate by the number of days in the period. The total production was obtained by the initial forage mass plus the forage production of each period and expressed in kg of dry mass per hectare (kg/DM/ha). The whole period of forage production consisted of 135 days.
To determine the stocking rate, the animals were weighted approximately every 21 days with a prior 12-hour fasting of solids and liquids. The weight difference between two weight times in succession divided by the number of days of the period corresponded to the daily average gain
(DAG, kg/animal/day) to each sub period that was considered in the stocking rate determination.
Data from the animal gain was not considered because there was a strong infection by the bacteria Salmonella spp, which resulted in intense liquid diarrhea, animal dehydration, fever and weight loss, which caused the death of some animals. The high moisture conditions along the experimental period and the animal agglomeration under the artificial shade areas predisposed the bacterial epidemic. Some medicines were tested, but none of them were efficient in controlling Salmonella spp.
Evaluations on forage nutritive values were done by the hand plucking method. The samples were analyzed by the NIRS technique described by Marten et al. (1985), determining the levels of crude protein, total digestible nutrients, neutral digestible fiber, acid digestible nutrient, potassium, phosphorous and calcium in three periods collected every 21 days after the animals entering the experiment. The nitrogen efficiency of use was obtained by the forage production difference between the nitrogen levels divided by the N level used.
The experimental results were submitted to the analysis of variance (ANOVA), firstly to identify possible interactions among the factors: grazing intensity, nitrogen levels and periods, using a significance level of 5%. When there was no interaction, the differences of each factor were separetedly tested by the Tukey test at 5% of significance.
Results and Discussion
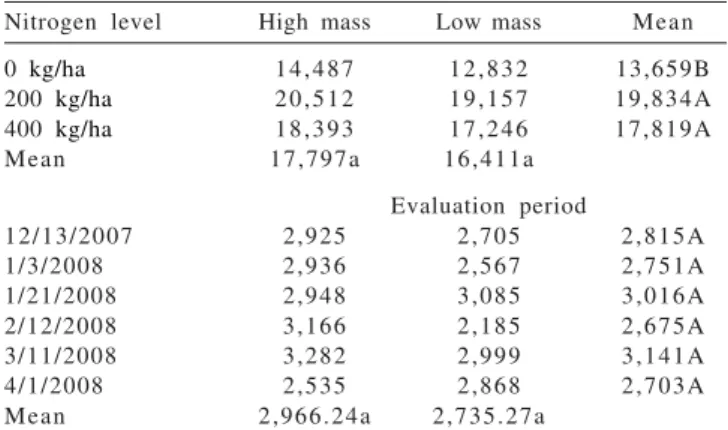
Good soil fertility level and climatic conditions over the experimental period allowed forage to present a high yield potential, showing values that are higher than those reported by Restle et al. (2002). There was no significant interaction (P>0.05) among grazing intensities, nitrogen levels and evaluation periods to the forage production variable, being observed differences (P<0.05) only among nitrogen levels. The forage accumulate rate was 100, 147 and 132 kg of DM/ha/day respectively to the levels of 0, 200 and 400 kg of N/ha, corresponding to a total production of 13,659, 19,834 and 17,820 kg of DM/ha (Table 1). This production is higher than the one found by Lançanova et al. (1988), who, when studying the same species with cuts and using 100 kg of N/ha, found production of 8.7 t DM/ha.
of N/ha shows that the soil nitrogen supplement was not enough to the maximal yield potential of the plant, which shows high rates of growing and great demand for nitrogen. Comparing these dry matter production values with other species, it is possible to notice that the Brachiaria plantaginea is a good option for annual summer forage. However, apart from the high forage production, it has a lower production cost once the establishment occurs by natural reseeding which is also less likely to suffer environmental stresses such as rain shortage, which sometimes affect germination and establishment of annual summer species.
Lupatini et al. (1996), researching pearl millet found forage production values of 9,227, 15,044 and 17,658 kg of DM/ha, respectively to the levels of 0, 200 and 400 kg of N/ha, values that are inferior when compared with this study. In his work, the highest accumulate rate production was 150 kg DM/ha/day with 459 kg of N/ha, a similar value when compared to this work (147 kg/DM/day), but now using 200 kg of N/ha instead of 459 kg of N/ha.
Martins et al. (2000), working with B. plantaginea, found a linear increase in the accumulate rate as the nitrogen level increased from 17.74 to 56.58 kg DM/ha/day, reaching a total forage production of 4,657 and 8,753 kg of DM/ha, respectively to the level of 0 and 200 kg of N/ha. Dry matter production increased 20.48 kg DM to each kg of N applied on B. plantaginea pasture. This figure is also lower than the data found in this experiment, for same level of N produced 30 kg of DM to each kg of N applied. However, Moojen (1993), found values slightly higher (31 kg of DM to each kg of N applied), using 150 kg of N/ha on pear millet pasture.
Nitrogen use efficiency, in terms of forage production, fell from 30 to 10 kg of DM to each kg of N applied from the 200 to the 400 kg of N/ha respectively. The response from the plant to N decrease as the N levels increase probably because, in high N level, losses are more likely to happen. Heringer & Moojen (2002) also found a decrease in the nitrogen use efficiency as levels of N applied increased. The values varied from 46 to 14 kg of DM to each kg of N applied respectively to the N levels of 150 and 600 kg of N/ha evaluating pearl millet. For Dougherty & Rhykerd (1985), this happens because the plants have a certain capability to respond to the N present in the soil, capability which is involved with the genetic potential of the plant to absorb nitrogen. Another factor limiting the forage production could be the lack of other nutrients, such as phosphorus and potassium (Salette, 1991).
The distribution of the forage production along the pasture cycle is another important parameter, once an even distribution might represent a better production of the plant-animal system. High growth rate in a short period of time allows great accumulation of dry matter that needs to be quickly consumed under the risk of decreasing nutritive value and sward quality (Martins et al., 2000). On the other hand, an even production along the pasture cycle reduces the need of animal put and take, a technique disliked by the farmers.
Forage production did not differ (P<0.05) along the evaluated periods, showing an average of 2,850 kg of DM/ha among grazing intensities per evaluation period. In other words, this means that the production distribution was constant during the pasture cycle. In pearl millet, Moraes (1984) observed that 55% of the total forage was produced until the 60th day of age of the forage. Lupatini et al. (1996)
also observed an uneven higher accumulation rate in pearl millet, once the forage production by the end of March and beginning April was 19, 34 and 50% of the average production found in the first three months of evaluation to the levels of 0, 150 and 400 kg of N/ha respectively. Considering these results, it seems that the B. plantaginea has a better forage distribution when compared to pearl millet.
There was no significant difference in the total forage production among grazing intensities, showing the high regrowth capacity of the plant and suggesting that higher grazing pressures could be used.
The efficiency of the productive system is also related to its forage quality. The nutritive value together with the forage production, helps choosing the best specie to be used (Table 2).
Means in the same row followed by different lowercase letters differ (P<0.05) by Tukey test.
Means in the same column followed by different capitol letters differ (P<0.05) by Tukey test.
Nitrogen level High mass Low mass Mean
0 kg/ha 14,487 12,832 13,659B
200 kg/ha 20,512 19,157 19,834A
400 kg/ha 18,393 17,246 17,819A
Mean 17,797a 16,411a
Evaluation period
12/13/2007 2,925 2,705 2,815A
1/3/2008 2,936 2,567 2,751A
1/21/2008 2,948 3,085 3,016A
2/12/2008 3,166 2,185 2,675A
3/11/2008 3,282 2,999 3,141A
4/1/2008 2,535 2,868 2,703A
Mean 2,966.24a 2,735.27a
Nutritive value was positively influenced by the nitrogen levels for all the evaluated parameters, especially to the crude protein percentage, as it is confirmed by many authors to the summer forage species (Moojen, 1993; Lupatini et al., 1996). Crude protein differed (P<0.05) among the used N levels, linearly increasing as N levels were increased.
For grazing intensities and for all the grazing periods, there was no significantly difference concerned to crude protein levels, showing that the plant quality does not change along its cycle. According to Blaser (1994), in sites with good supplementation of N, the plant physiological development is hold back and the nutritive value is maintained over its cycle. The crude protein content found in grazing simulation was higher than the values found by Montagner et al. (2008), who found values of 16.2% of pearl millet in 195 kg N/ha. Also associated with the increasing in the nutritive value related to the N levels, it is possible to observe that the values of neutral digestible fiber and acid detergent fiber decreased as the N levels were increased, differing (P<0.05) between the level of 200 and 400 kg of N/ha.
The increase of the nutritive value with levels of N can be explained by the fact that the nitrogen increased the forage dry matter accumulation rate and consequently the caring capacity of the pasture, through the increase of the stocking rate on the pasture. With higher accumulation rate and forage consumption per ha, the plants are grazed more frequently and animal graze young material, with lower levels of fibers in relation to a pasture, that even if kept at the same forage offer, shows lower accumulation rate and livestock capacity.
The total digestible nutrients and other nutrient values such as phosphorus, potassium and calcium also increased with the N level differing in a diverse way according to level used. These data is similar to the ones found by Salette (1991),
who explains that plants have a tendency to absorb more nutrients (K and P) as N fertilization increased, as long as these nutrients are present in the soil. This shows that apart from improving forage production, nitrogen also improves forage nutritive value. There was little difference between the grazing intensities among the nutritive values studied, probably because the technique used to collect the samples follows the animal grazing behavior, and they have a high selective capacity. Related to the evaluation periods, the parameters also showed a similar behave. The neutral digestible fiber differed among the periods, being the level of the third period better than the rest of periods. The acid digestible fiber also showed a tendency to decrease along the periods, although there was no statistically difference. The total digestible nutrients levels are similar to the ones found by Montagner et al. (2008), who found average values of 63.7% in pearl millet.
Comparing the nutritive value found by the B. plantaginea with values found by Gerdes (2000) in a B.brizantha pasture, it is possible to conclude that B.plantaginea is of better quality in terms of nutritive value. The average values found for P and Ca (0.33% and 0.66%) were higher than the ones found by Stobbs (1975) in pearl millet plants (0.19% and 0.32% respectively), being the K level (2.48%) lower than the one found by this author (4.44%). Values of calcium increased over the cycle of the plant, differing between the evaluation periods, probably because the structural role of Ca in the plant.
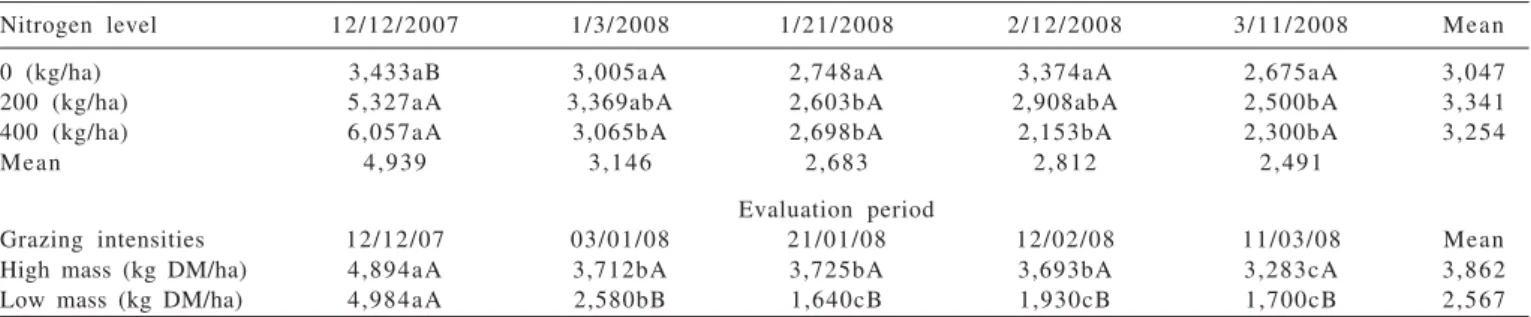
For high and low masses of the forage, there was a significant interaction between period versus N levels and between periods versus grazing intensities. There was no interaction between N level and grazing intensities. Forage mass differed among the evaluated periods, except for the first one, in which the interference by the animal was small (Table 3).
Variable Total digestible Neutral digestible Acid digestible Crude protein K P Ca nutrients (% DM) fiber (% DM) fiber (% DM) (% DM) (% DM) (% DM) (% DM)
Nitrogen level (kg/ha)
0 65.01b 66.35a 32.61a 15.18c 2.33b 0.31 b 0.61b
2 0 0 66.29ab 63.61ab 30.78ab 17.75b 2.49ab 0.325a 0.67ab
4 0 0 67.94a 61.58b 28.43b 19.88a 2.63a 0.345a 0.72a
Grazing intensities (kg DM/ha)
High mass 66.64a 63.41a 30.92a 17.68a 2.46a 0.34a 0.63b
Low mass 66.19a 64.28a 30.28a 17.53a 2.50a 0.32a 0.7a
Grazing period
1/2/2008 66.10a 64.79a 31.06a 17.27a 2.70a 0.33a 0.55c
1/23/2008 65.70a 66.23a 31.63a 17.23a 2.41b 0.325a 0.69b
2/13/2008 67.45a 60.53b 29.13a 18.31a 2.35b 0.345a 0.76a
Mean 66.41 63.84 30.6 17.6 2.48 0.33 0.66
Table 2 - Papuã forage nutritive values (% DM) at the different nitrogen levels, grazing intensities and evaluations periods from the hand plucking technique
For the aimed forage mass of 1,500 and 3,000 kg of DM/ha, the real forage mass was of 2,567 and 3,862 kg of DM/ha respectively (Table 3). These differences between the aimed mass and the real forage mass occurred because the accumulate rate was always higher than the estimated and consequently the livestock adjustment was below the necessary. The small number of information about this specie, concerned to its productive potential led to this kind of error. Despite of the existing data, the variation among regions is significant, as it is shown by this work when compared to others more in the south of Brazil. Despite the differences between the wanted forage mass and the real forage mass, the difference between the forage mass existed, evidencing that this factor could be used as part of the treatments, and the magnitude of the difference was close to the target one, around 1,500 kg of DM/ha.
For the first period, the forage mass did not differ among the grazing intensities, once there had been no animal influence yet, but, after the livestock adjustment, the forage mass differed for all the periods. The differences inside the periods, either to the high mass or to the low mass showed a gradual reduction in the forage mass reflecting the animal livestock adjustment aiming at keeping the pasture at the target forage mass.
Regarded to the N levels influence over the forage mass, it is possible to notice that the first nitrogen application, performed on November 20th, influenced the
forage production and because of that forage mass in the treatments with 200 and 400 kg of N/ha differ from the treatment without N to the first period. To the other periods, the forage mass did not differ among the nitrogen levels due to the livestock adjustment (Table 4). The forage mass inside the nitrogen levels decreased over the evaluation periods, also due to the livestock adjustment.
The stocking rate used expressed the plant capacity to support grazing activity and it is a direct result of the forage production influenced by the N fertilization, once N usually increases forage production. Consequently, to maintain
the forage mass constant, an increase in the stocking rate is necessary to provide higher animal gain per area. There was no interaction between period versus N level to the stocking rate, being observed interaction between grazing intensity versus N levels and between grazing intensity versus period (Table 4).
As the N level increased, the stocking rate also increased. Comparing the influence of N levels on the stocking rate at different grazing intensities, it is possible to notice that there was no difference between grazing intensity and the treatment without N, while the treatments with 200 and 400 kg of N/ha differed among each other, being the stocking rate superior in more than 1,000 kg to the low mass in relation to the high mass. This difference was due to the higher forage production provided by the nitrogen application.
Stocking rate at nitrogen levels in grazing intensities showed similar values for high mass, probably due to the high forage production at the without-nitrogen paddocks. However, at low mass, without-nitrogen paddocks differed from the paddocks with 200 and 400 kg of N/ha, which, in turn, were similar. On average, the stocking rate increased 20.18% and 26.7% for the 200 and 400 kg of N/ha when
Nitrogen level 12/12/2007 1/3/2008 1/21/2008 2/12/2008 3/11/2008 Mean
0 (kg/ha) 3,433aB 3,005aA 2,748aA 3,374aA 2,675aA 3,047
200 (kg/ha) 5,327aA 3,369abA 2,603bA 2,908abA 2,500bA 3,341
400 (kg/ha) 6,057aA 3,065bA 2,698bA 2,153bA 2,300bA 3,254
Mean 4,939 3,146 2,683 2,812 2,491
Evaluation period
Grazing intensities 12/12/07 03/01/08 21/01/08 12/02/08 11/03/08 Mean
High mass (kg DM/ha) 4,894aA 3,712bA 3,725bA 3,693bA 3,283cA 3,862
Low mass (kg DM/ha) 4,984aA 2,580bB 1,640cB 1,930cB 1,700cB 2,567
Means in the same row followed by different lowercase letters differ (P<0.05) by Tukey test. Means in the same column followed by different capitol letters differ (P<0.05) by Tukey test.
Table 3 - Values of papuã forage mass in relation to different nitrogen levels and grazing intensities in different evaluation periods
Nitrogen level High mass Low mass Mean
0 (kg/ha) 2,056aA 2,002Aa 2,029
200 (kg/ha) 1,946aA 3,138bB 2,542
400 (kg/ha) 2,264aA 3,271bB 2,767
Mean 2,089 2,804
Evaluation period
12/13 – 1/3/2008 2,124aAB 3,687Ba 2,906 1/3 – 1/21/2008 2,629aA 4,012bA 3,321 1/21 – 2/12/2008 2,009aAB 2,125aB 2,067 2/12 – 3/11/2008 81,391aB 1,592aB 1,491
Means in the same row followed by different lowercase letters differ (P<0.05) by Tukey test.
Means in the same column followed by different capitol letters differ (P<0.05) by Tukey test.
compared with the paddocks without N. The results of this experiment confirm the results of other researches in which nitrogen fertilization usually increases the carrying capacity of the pasture. The higher stocking rate used at the treatments with N is a spontaneous effect of the higher vegetable production due to the nitrogen use.
The stocking rate at 200 kg of N/ha was of 2,542 kg of LW/ha or 90 animal of 28 kg. This treatment was managed on average, with a forage mass of 3,341 kg of DM/ha and a plant height of 27 cm. These data showed to be higher than the one found by Schwartz et al. (2003), when managing pearl millet with 135 kg of N/ha and forage mass and plant height average of 864 kg of DM/ha and 32 cm respectively, got a stocking rate of 2,138 kg of LW/ha or 76 animals at 28 kg body weight.
Stocking rate increase on B. plantaginea pasture with different levels of N was also observed by Martins et al. (2000). In his work, kept with a forage mass of 2.319 kg of DM/ha, the used stocking rate was 1.028 and 1.775 kg of BW/ha to the treatment with 0 and 200 kg of N/ha, respectively. Comparing B. plantaginea with other frequently used species, Restle et al. (2002) found stocking rate values of 1,634, 1,514 e 1,389 kg of LW/ha respectively to B. plantaginea, pearl millet and sorghum. These values are slightly lower than this experiment, however, other researches, shows similar stocking rate values. Moojen et al. (1999), working with a forage mass of 3,168 kg of DM/ha observed on pearl millet a stocking rate of 1,585, 2,225 e 2,877 kg of LW/ha respectively to the N levels of and 0, 150 and 300 kg of N/ha.
Considering the interaction between grazing intensities versus evaluation periods, a decrease in the stocking rate over the cycle of the pasture was observed. At the first period (the moment when the animal entered into the experiment), the forage mass was superior than the targed one and because of this a higher stocking rate was used, specially at the low mass, with the aim to adjust the forage mass back to 1,500 kg of DM/ha. Regarding to high mass, the stocking rate variation along the experiment period was inferior, with differences only between the second and fourth period, due to the strategy used to enter with the
animal using forage mass of 3,000 of DM/ha. The increase in the stocking rate at the second period for both forage masses took place because stocking rate adjustment underestimate the growth potential of the pasture, so stocking rate had to be increased.
Even with the small size of the paddocks, the number of animal used was, in a certain moment, up to 160 animals in the area (1.39 ha), due to their low body weight and the high carrying capacity of the pasture, considering the high levels of accumulation rate. It is important to understand that this variation in the stocking rate is because the growth capacity of the B. plantaginea was unknown. Moreover, if animal average daily gain (115 g. animal/day) is considered at the beginning of the experiment (prior the infection by the bacteria salmonella spp.) and the stocking rate of 2,800 kg for BW/ha for goats with 30 kg of BW, it will be possible to obtain an animal production of 1,073 kg of LW/ha in one hundred days of grazing.
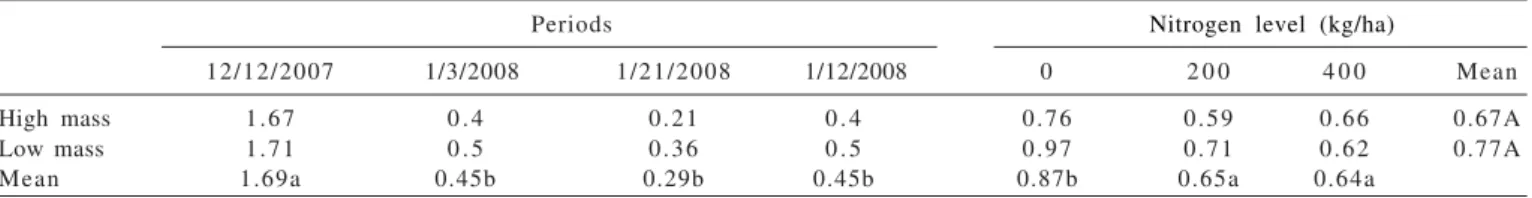
To best describe the B.plantaginea behavior associated to the grazing intensities and nitrogen levels, it was evaluated the forage sward, considering the leaf:stem relation, the height of plants and the forage density. The leaf proportion among the forage components is of great importance since it plays a major role on the nutritional quality of the forage, especially for the animal. It was not observed any interaction among factor for leaf:stem ratio. It differed among the periods and N levels, not among grazing intensities, however (Table 5).
According to the literature, the fertilization with N may affect or not the leaf:stem ratio. Moojen (1993) did not find any differences for the leaf:stem relation in pearl millet managed at different nitrogen levels. In this study, this ratio was higher in the treatment without nitrogen, probably explained due to the animal selective potential and to the higher stocking rate used at the treatments with 200 and 400 kg of N/ha.
Significant differences were only observed in the first period. It is noticed a gradual decrease in the leaf:stem ratio during the grazing period. According to Heringer & Moojen (2002), as the plant grows, the leaf:stem ratio tends to decrease because of the death of its tiller and the lower meristem activity. In addition, leaf:stem ratio is negatively affected by the
Periods Nitrogen level (kg/ha)
12/12/2007 1/3/2008 1/21/2008 1/12/2008 0 2 0 0 4 0 0 Mean
High mass 1.67 0 . 4 0.21 0 . 4 0.76 0.59 0.66 0.67A
Low mass 1.71 0 . 5 0.36 0 . 5 0.97 0.71 0.62 0.77A
Mean 1.69a 0.45b 0.29b 0.45b 0.87b 0.65a 0.64a
Means in the same row followed by different lowercase letters differ (P<0.05) by ukey test. Means in the same column followed by different capitol letters differ (P<0.05) by Tukey test.
increasing of the stocking rate, and these factors were responsible for the leaf:stem decrease over the evaluation periods. In this study, leaf:stem ratio was lower than the values (0.71 to 0.95) found by Paciullo et al. (2003) in B. brizantha.
The lower values found in this experiment is a consequence of the high selective potential expressed by the goats. Regarded to the leaf:stem ratio, it is important to consider that the stems of the B. plantaginea are softer and probably with better nutritive value in comparison to species such as sorghum or pearl millet, which are some of the reasons why they are easily ingested by the animal.
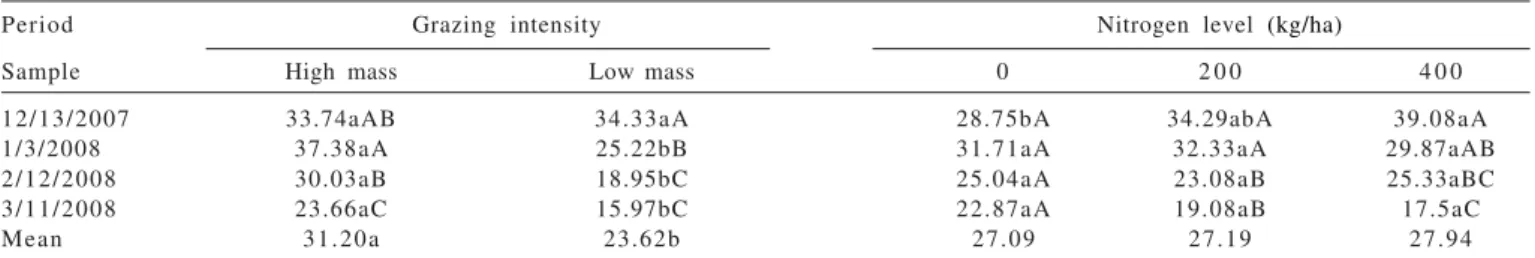
Moreover, height of the plants is a parameter easily to be used for forage management, once it is easier to be measured on the field and also because there is a high correlation between forage mass and plants height. Different heights of plants determine different forage swards, which alters the capacity of forage apprehension by the animal, changing the animal behavior and forage consumption (Carvalho et al., 2001). For this variable, there was a significant interaction between grazing intensity versus evaluated periods and between nitrogen levels versus periods.
Heights of plants did not differ only in the first period, since up to that moment, the plants have not suffered the influence of the animal yet. However, the height of the plants differed for all the other periods. This reduction in the height over the grazing cycle is due to the forage mass reduction related with the increase in the stocking rate (Table 3). The higher height of plants in the first period at the different nitrogen levels is a consequence of the forage production increase and the stem elongation in these treatments due to the application of N. It was observed that the average height for high mass and low mass was 31.2 and 23.6 cm respectively, which allowed a good forage density and did not affect the forage production (Table 6).
Sbrissia (2004) stated that the best amplitude of forage height management to B. brizantha varies from 20 to 40 cm, once in this range, the forage production did not differ, which was also concluded for the B. plantaginea. Among the nitrogen levels, the height of the plants differed only to the first period due to lack of the animal influence. In the nitrogen levels to the different period, plants height varied more at the level 400 kg N/ha, possible explained by the stronger influence of the N over the forage development in this treatment.
It is also observed a gradual decrease of the height over the evaluated period for all the nitrogen levels and grazing intensities, which can be explained by the stocking rate adjustment. The average height of plants found at the low mass (23.62 cm) and at the high mass (31.20 cm) with real forage mass of 2,567 and 3,862 kg of DM/ha did not influence the grazing activities, once the time of animals grazing and rumination did not differ among these treatments, showing that forage intake was probably not affected by the different forage mass (Adami et al., 2008). High mass showed an average height of 7.58 cm higher than the low mass.
The average forage density (average forage mass/ average plant height) was 117 kg DM/ha for each centimeter of the plant height. In all treatments, the forage density was higher than 100 kg DM/ha per centimeter of height showing a good forage sward for B. plantaginea. Lupatini et al. (1996), working with pearl millet found an average density of 73 and 98 kg of DM/ha per cm of height at nitrogen levels of 0 and 450 kg of N/ha respectively. These values are lower than the ones found in this study, once the forage density was 112 and 116 kg of DM/ha per cm at the nitrogen level 0 and 400 kg of N/ha respectively.
Conclusions
Brachiaria plantaginea shows a high forage production with good nutritive values and distribution over its cycle. The different grazing intensities does not
affect the forage production, so it can be inferred that higher stocking rates can be used. Nitrogen level of 200 kg of N/ha shows the best answer to all the studied variables, therefore there is no reason for this level to be exceeded.
Period Grazing intensity Nitrogen level (kg/ha)
Sample High mass Low mass 0 2 0 0 4 0 0
12/13/2007 33.74aAB 34.33aA 28.75bA 34.29abA 39.08aA
1/3/2008 37.38aA 25.22bB 31.71aA 32.33aA 29.87aAB
2/12/2008 30.03aB 18.95bC 25.04aA 23.08aB 25.33aBC
3/11/2008 23.66aC 15.97bC 22.87aA 19.08aB 17.5aC
Mean 31.20a 23.62b 27.09 27.19 27.94
Means in the same row followed by different lowercase letters differ (P<0.05) by Tukey test Means in the same column followed by different capitol letters differ (P<0.05) by Tukey test.
References
ADAMI, P.F.; SARTOR, L.R.; SOARES, A.B. et al. Comportamento ingestivo de caprinos em Brachiaria plantaginea sob diferentes intensidades de pastejo. In: REUNIÓN DEL GRUPO TÉCNICO EN FORRAJERAS DEL CONO SUR, 22., 2008, Minas, Uruguay
Anais.... Minas, Uruguay, 2008. (CD-ROM).
BLASER, R.E. Manejo do complexo pastagem-animal para avaliação de plantas e desenvolvimento de sistemas de produção de forragens. In: PEIXOTO, A.M. (Ed.). Pastagens: fundamentos da exploração racional. 2.ed. Piracicaba: Fundação de Estudos Agrários Luiz de Queiroz, 1994. p.279-335. CARVALHO, P.C.F.; RIBEIRO FILHO, H.M.N.; POLI, C.H.E.C.
et al. Importância da estrutura da pastagem na ingestão e seleção de dietas pelo animal em pastejo. In: MATTOS, W.R.S. et al. (Eds.) A produção Animal na visão dos brasileiros. Piracicaba: FEALQ/SBZ, 2001. p.853-871.
DOUGHERTY, C.T.; RHYKERD, C.L. The role of nitrogen in forage-animal production. In: HEATH, M.E.; BARNES, R.F.; METCALFE, D.S. (Eds.). Forages: the science of grassland agriculture. Ames: Iowa State University Press, 1985. p.318-325. EMPRESA BRASILEIRA DE PESQUISA AGROPECUÁRIA -EMBRAPA. Serviço Nacional de Levantamento de Solos.
Levantamento de reconhecimento dos solos do Estado do Paraná. Curitiba: SUDESUL/IAPAR, 1984. 2v. (Boletim Técnico, 27).
GARDNER, A.L. Medição dos atributos das pastagens em experimentos de pastejo. Brasília: Embrapa, 1986. 197p. GERDES, L.; WERNER, J.C.; COLOZZA, M.T. et al. Avaliação de
características de valor nutritivo das gramíneas forrageiras Marandu, Setária e Tanzânia nas estações do ano. Revista Brasileira de Zootecnia, v.29, n.4, p.995-963, 2000. HART, R.H.; BURTON, G.W. Effect of roe spacing, seeding rate
and nitrogen fertilization on forage yield and quality of Gahi-1pearl millet. A g ro n o m y J o u r n a l, v.57, n.4, p.376-378, 1 9 6 5 .
HERINGER, I.; MOOJEN, E.L. Potencial produtivo, alterações da estrutura e qualidade da pastagem de milheto submetida a diferentes níveis de nitrogênio. Revista Brasileira de Zootecnia, v.31, n.2, p.875-882, 2002.
LANÇANOVA, J.A.C.; RESTLE, J.; SANTOS, G.L. Produção e qualidade do capim papuã (Brachiaria plantaginea) sob efeito de freqüências de corte e nitrogênio. Revista do Centro de Ciências Rurais, v.18, n.3, p.343-354, 1988.
LUPATINI, G.C.; MOOJEM, E.L.; RESTLE, J. Resposta do milheto (Pennisetum americanum (L.) Leeke) sob pastejo à adubação
nitrogenada. Pesquisa Agropecuária Brasileira, v.31, n.10, p.715-720, 1996.
MAAK, R. Geografia física do estado do Paraná. Curitiba: Banco de Desenvolvimento do Paraná, 1968. 350p. MARTEN, G.C.; SHENK, J.S.; BARTON, F.E. Near infrared
reflectance spectroscopy (NIRS). Washington: USDA, 1985. 96p. (Agriculture Handbook, 643).
MARTINS, J.D.; RESTLE, J.; BARRETO, I.L. Produção animal em capim papuã (B r a c h i a r i a p l a n t a g i n e a (Link) Hitchc)
submetido a níveis de nitrogênio. Ciência Rural, v.30, n.5, p.887-892, 2000.
MONTAGNER, D.B.; ROCHA, M.G.; SANTOS, D.T. et al. Manejo da pastagem de milheto para recria novilhas de corte. Ciência Rural, v.38, n.8, p.2293-2299, 2008.
MOOJEN, E.L. Avaliação de milheto (Pennisetum americanum (L.) Leeke) sob pastejo com níveis de nitrogênio. 1993. 39f. Tese (Acesso a Classe de ProfessorTitular) - Universidade Federal de Santa Maria, Santa Maria.
MOOJEN, E.L.; RESTLE, J.; LUPATINI, G.C. Produção animal em pastagem de milheto sob diferentes níveis de nitrogênio. Pesquisa Agropecuária Brasileira, v.34, n.11, p.2145-2149, 1999. MORAES, A. P ressões de pastejo e produção animal em
milheto (Pennisetum americanum (L) Leeke). Porto Alegre: Faculdade de Agronomia, 1984. 104p.
MORAES, A.; MOOJEN, E.L.; MARASCHIN, G.E. Comparação de métodos de estimativa de taxas de crescimento em uma pastagem submetida a diferentes pressões de pastejo. In: REUNIÃO ANUAL DA SOCIEDADE BRASILEIRA DE ZOOTECNIA, 27., 1990, Campinas. Anais... Piracicaba: Sociedade Brasileira de Zootecnia, 1990. p.332.
MOTT, G.O.; LUCAS, H.L. The design conduct and interpretation of grazing trials on cultivated and improved pastures. In.: INTERNATION GRASSLAND CONGRESS, 6., 1952, Pensylvania. Proceedings…
Pensylvania: State College Press, 1952. p.1380-1395.
NABINGER, C. Fundamentos da produção e utilização de pastagens. Bases ecofisiológicas do crescimento das pastagens e as práticas de manejo. Notas do módulo 1 da disciplina AGR 05003. Porto Alegre, 2005. 99p.
PACIULLO, D.S.C.; AROEIRA, L.J.M.; ALVIM, M.J. et al. Características produtivas e qualitativas de pastagem de braquiária em monocultivo e consorciada com estilosantes. Pesquisa Agropecuária Brasileira, v.38, n.3, p.421-426, 2003. RESTLE, J.; ROSO, C.; AITA,V. et al. Produção Animal em pastagem
com gramíneas de estação quente. Revi s t a B r a s i l e i r a d e Zootecnia, v.31, n.3, p.1491-1500, 2002.
ROLAS. Manual de adubação e de calagem para os estados do Rio Grande do Sul e Santa Catarina. Porto Alegre: [s.n.]., 2004. 394p.
SALETTE, J.; HUCHÉ, L. Diagnostic de I´état de nutrition minérale d´une prairie par analyse de v´gétal: príncipes, mise em ceuvre, exemples. Fourrages, v.125, p.3-18, 1991. SBRISSIA, A.F. Morfogênese, dinâmica do perfilhamento e do
acúmulo de forragem em pastos de capim-Marandu sob lotação contínua. 2004. 170f. Tese (Doutorado em Agronomia – Ciência Animal e Pastagens) - Escola Superior de Agricultura “Luiz de Queiroz”/Universidade de São Paulo, Piracicaba. SCHWARTZ, F.; ROCHA, M.G.; VÉRAS, M. et al. Manejo de
milheto (Pennisetum americanum LEEKE) sob pastejo de o v i n o s . R e v i s t a B r a s i l e i r a d e A g r o c i ê n c i a, v. 9 , n . 2 , p.151- 155, 2003.
SHAW, W.C. Integrated weed management systems tecnology for pest management. Weed Science, v.30, p.2-12, 1982. STOBBS, T.H. A comparison of Zulu sorghum, bulrush millet and
Withe Panicum in terms of yield, forage quality and milk
production. Australian Journal of Experimental Agriculture and Animal Husbandry, v.15, p.211-218, 1975.