This is a post-print (i.e. final draft post-refereeing) of a manuscript submitted to Omega – The International Journal of Management Science.
To cite this article: Santos, S.P. and C.A.F. Amado (2014). “On the need for reform of the Portuguese Judicial System - Does Data Envelopment Analysis assessment support it?”. Omega, The International Journal of Management Science, 47: 1-16.
To link to this article: http://dx.doi.org/10.1016/j.omega.2014.02.007
On the need for reform of the Portuguese Judicial System –
Does Data Envelopment Analysis assessment support it?
Sérgio P. Santos
a,*and Carla A.F. Amado
aa
Faculty of Economics, University of Algarve and CEFAGE-UE
8005-139 Faro, Portugal
*Corresponding author:
Faculty of Economics
University of Algarve
Campus de Gambelas, Edifício 9
8005-139 Faro
Portugal
E-mail: [email protected]
Tel: 00351 289 817571
Fax: 00351 289 800064
Abstract
The Portuguese judicial system has attracted considerable criticism in recent years and demands for reforms have gained prominence. By using the Data Envelopment Analysis technique and focusing on the performance of 223 Portuguese first instance courts during the period of 2007 to 2011, this research has found evidence that supports some of this criticism and justifies the calls for reforms, better performance and accountability of the judicial system. In particular, our results found a sector with considerable scope for improvement with less than 16 percent of the 223 courts analysed making an efficient use of their resources in each year and with only one third of the courts being considered efficient in at least one of the five years assessed. Whilst the results suggest that improvement can be achieved with better case management, scale factors also seem to play an important role in explaining inefficiency, with most of the inefficient courts being smaller than optimal and with smaller courts being, on average, less efficient than larger ones. The existence of a statistically significant relationship between courts’ efficiency and size was confirmed by the Mann-Whitney test. These results indicate considerable scope for improvement and that some of the planned reforms are timely and seem well targeted. However, the results also suggest that efficiency increases matching peers’ best practices are not enough to sustainably reduce the prevailing judicial backlog and length of court proceedings in a considerable number of courts. Major changes in the capacity and/or functioning of the Portuguese judicial system might also be required.
1. Introduction
At all levels of government the New Public Management movement has demanded that public sector organisations make more effective use of resources and that they be held accountable for the services they provide. Courts have not been immune from these demands. Indeed, the past few years have witnessed several structural and organisational changes and the implementation of mechanisms, procedures and measures aimed at monitoring and improving the services provided to court users in many countries, including in Portugal.
The financial resources allocated by the Portuguese Government to the justice sector have increased significantly in recent years, with the exception of the last three years due to the stringent austerity measures implemented to address the debt crisis faced by the country. There have also been improvements in some courts’ technology, infrastructure and organisational functioning. Despite these improvements, aimed at achieving a simpler, quicker, more efficient and more humane justice, the public perception is that these objectives are far from being reached. This has led the previous and the new Government, elected in 2011, to aim for reform in the Portuguese judicial system targeted at improving the efficiency of courts. One of the measures to be implemented consists of closing down small courts (i.e. courts with less than 250 new cases per year), and transferring their caseloads to larger and geographically close courts.
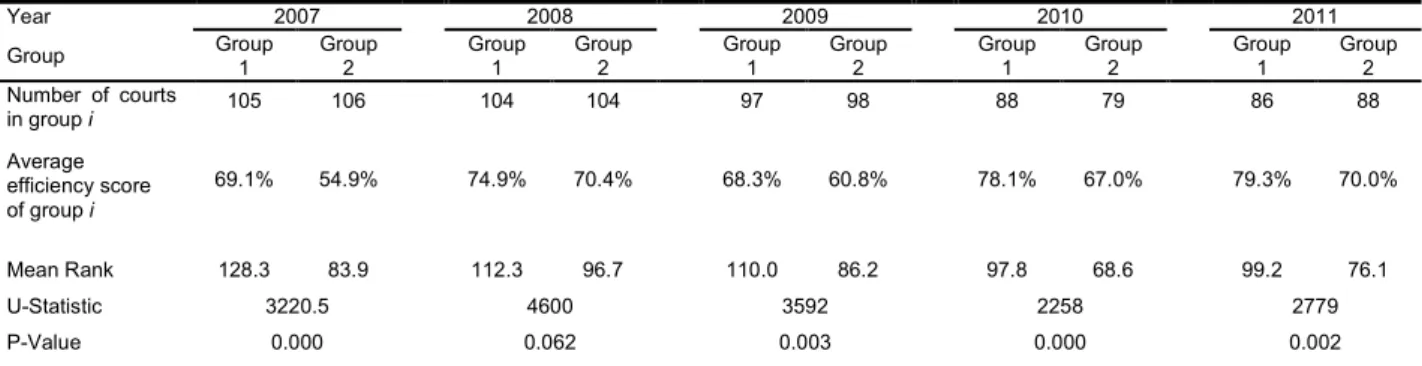
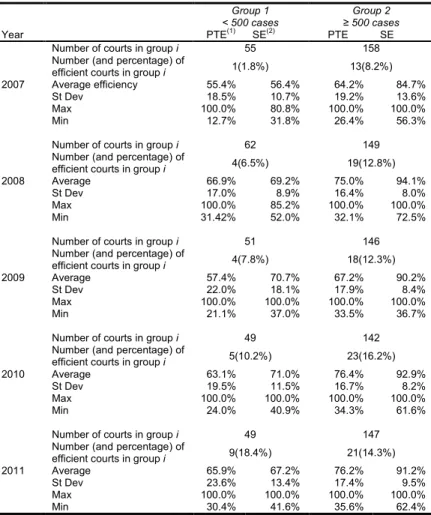
The research documented in this paper has a twofold purpose. Firstly, it aims to determine whether there is empirical evidence supporting the public perception that the Portuguese judicial system is inefficient. Secondly, it aims to determine whether the decision to close down small courts on the grounds that this will generate efficiency gains is supported by substantial evidence. As part of this second aim, it is our objective to test the hypothesis that there is a relationship between courts’ size and their efficiency.
In order to achieve these two objectives we use the Data Envelopment Analysis (DEA) technique and the Mann-Whitney test. The DEA technique will allow us to comparatively assess the performance of the Portuguese courts of first instance, determine whether their relative performance is high or low, identify the best and worst performers, identify best practices that can be used to promote learning and improvement in the system, and explore the effect of scale on the efficiency of courts. The Mann-Whitney test [1], which is a distribution free rank order statistic, will allow us, in turn, to test whether the relationship between courts’ size and the efficiency scores obtained with the DEA technique is statistically significant. Distribution free rank order statistics have been recommended for non-parametric analysis of DEA results [2-7].
In pursuit of these objectives, the paper is organised as follows. It starts by setting up the background of the research and explaining the importance of comparing the relative efficiency of the Portuguese courts of first instance. An introduction to the Portuguese judicial system is then presented. It then discusses the DEA methodology and its use to assess the efficiency of courts. The DEA model used to evaluate the Portuguese courts of first instance at a county level and its results are then discussed. The paper finishes by developing recommendations
3
and setting up a research agenda aimed at improving the efficiency of the Portuguese courts of first instance.
2. The Portuguese judicial system
Portugal is divided, for the purpose of the administration of justice, into judicial districts, judicial circuits and judicial counties, and the Constitution of the Portuguese Republic establishes a fundamental distinction between civil jurisdiction and administrative jurisdiction.
In the civil jurisdiction, the focus of our research, the judicial courts are organised into three degrees or instances, to each of which corresponds a specific jurisdiction area. The Supreme Court of Justice is the superior hierarchical body of the judicial courts. It has a national jurisdiction level and is organised into three sections: civil, criminal and social. On a different level, there are the Courts of Appeal, which are, as a rule, Courts of Second Instance which have a district jurisdiction and are also divided into sections of a civil, criminal and social nature. Finally, there are the Courts of First Instance, usually referred to as county courts. The courts of first instance are organised according to subject matter, territory, value of the claims brought to court and procedure, and may sub-divide into benches.
As previously mentioned, this study will focus on the civil jurisdiction, which is the one that most directly impacts on the economy and on the economic agents [8], and the analysis will be carried out at the level of the judicial counties (Comarcas), which are the geographic reference for most litigation. Furthermore, throughout the discussion we will use the concept of “efficiency” to refer to the ability of the county courts (Tribunais de Comarca) to resolve as many cases as possible, given certain levels of staff and other resources.
Considering that market functioning and economic development depend, to a considerable extent, on the quality, efficiency and effectiveness of the judicial courts, evaluation exercises, such as the one proposed here, aimed at identifying best practices and at improving the functioning and performance of these courts, are fundamental. This need is particularly acute in Portugal, where there is widespread perception that the courts manage the cases inefficiently. This perception seems to be shared by many politicians, judges, lawyers, litigants, members of the public and organisations within the civil society. As a result, litigants and the public at large are losing faith in the judicial system's ability to resolve their disputes. The urgent need to revise the Portuguese judicial system in order to improve its efficiency was also identified by the “troika” of the European Commission, the European Central Bank and the International Monetary Fund as part of the economic adjustment programme for Portugal [9].
This need for reform is not only recent, however. Since the end of the nineteen eighties the need for reforms in the judicial systems has been recognised and has become part of the political agenda in several countries. As discussed by Santos et al. [10], initially the reforms focused on finding alternative measures to solve certain types of judicial cases. At a later stage, however, the reforms focused on organisational aspects, including the reorganisation of the
judicial maps. In this respect, it is possible to find reform programmes initiated in several European countries during the nineteen nineties.
In Portugal, from 2000 onwards, several studies and debates have taken place to discuss the general lines of a much needed reform of the judicial system. Specifically, the Portuguese Observatory for Justice has published several studies discussing detailed aspects related with the management of the system. One of these studies [11] discusses the management of civil courts, emphasising the need for reforms in order to achieve greater efficiency. The most important recommendations that resulted from this study were: the need to re-evaluate the number of judges and support staff allocated to each court based on the volume of cases received per year; the need to design new plans of continuous specialised training for workers; the need to regularly monitor the performance of the courts, with the internal publication of results; the preparation of a manual of good practices; and the need to revise the Code of the Civil Process. These recommendations are clearly supportive of research such as that discussed in this article, which aims to identify best practices in the administration of justice and, through this, promote performance improvement.
The need to improve the performance of the Portuguese judicial system in general and of courts in particular, has gained momentum over the past few years and in August 2008, with the publication of specific legislation [12] there began a process of reform aimed at improving the efficiency and effectiveness of the judicial institutions. This process was later revised in June 2012 [13], but the ultimate goals of the reform remained unchanged. The fact that DEA has a good record in identifying best practice and in generating useful information to promote an efficient and effective use of public resources (e.g. [14, 15]), makes its use in this particular context very valuable. Furthermore, considering that DEA allows the assessment of economies of scale, this technique will allow us to assess the extent to which the proposed reorganization of the existing judicial map with a higher concentration of the judicial services through the closure of small courts is supported by evidence.
3. DEA and its use to assess the efficiency of courts
In recent years, researchers and practitioners have looked for measures of the efficiency of courts and, in some cases, have established comparisons between courts. A general problem in carrying out comparative analyses is, however, the definition of a conceptually defensible measure of efficiency that can be equitably or fairly applied to different courts. The use of the DEA technique is a possible way to deal with such problem, as it allows the inclusion of several indicators without requiring the specification of weights.
DEA is one of the most important and widely used approaches to measure the efficiency of homogeneous decision making units (DMUs) and was first proposed by Charnes et al. [16]. Below we present the envelopment form and the multiplier form of the DEA problem, with output orientation and assuming constant returns to scale (CRS) for DMU0.
5
Envelopment Model Multiplier Model
φ
Max
Subject to: 0 1 i j n j ijx
x
≤
∑
=λ
(
i
=
1
,...,
m
)
0 1 r n j j rjy
y
λ
≥
φ
∑
=(
r
=
1
,...,
s
)
0
≥
jλ
(
j
=
1
,...,
n
)
∑
= m 1 i 0 i ix
v
Min
Subject to:0
1 1≥
−
∑
∑
= = rj s r r ij m i ix
u
y
v
1
1 0=
∑
= s r r ry
u
0
>
≥
ε
i rv
u ,
In these problems, n is the number of DMUs; s is the number of outputs and m is the number of inputs; yr0 is the amount of output r generated by unit 0 and xi0 is the amount of input i used by unit 0; ur is the weight of output r and vi is the weight of input i;
λ
j is the intensity variable forDMU j reflecting the weight to be attached to each DMU j in forming the efficient benchmark for the DMU0 under analysis; ε is a small non-Archimedean quantity. The score φobtained from the solution to the envelopment model is the maximum rate of proportional expansion in all outputs of DMU 0, without decreasing its inputs. The efficiency rate of DMU 0 can be obtained by calculating 1/φ, and will be equal to 1 if the DMU is efficient, and smaller than 1 if the DMU is inefficient when compared with the other DMUs.
The DEA output oriented model with variable returns to scale (VRS), proposed by Banker et al. [17], is similar to the CRS version but includes the convexity restriction in the envelopment
form: 1 1 =
∑
= n j jλ . The introduction of this additional restriction will produce a scale variable
(unrestricted in sign), which is added to the objective function and to the first set of restrictions of the dual (multiplier) formulation. If DMU0 is efficient under the VRS assumption, whether increasing, constant or decreasing returns to scale are present depends on whether the scale variable assumes a negative, null or positive value, respectively, in the optimal solution for the dual problem. Furthermore, if we run the DEA model under the CRS and VRS assumptions, we can obtain a measure of scale efficiency by dividing the score obtained under the CRS assumption by the score obtained under the VRS assumption. If this ratio is equal to one, the DMU is scale efficient, but if it is smaller than one the DMU is scale inefficient.
Several methodological developments have been proposed regarding the DEA technique and Liu et al. [18] have identified some of the most influential ones through a citation based survey of the DEA literature. One such development relates to the use of weight restrictions to incorporate value judgements in the DEA analysis [19], and several methodologies have been proposed. Weight restrictions can be imposed on both 'pure weights' and 'virtual weights'. 'Pure weights' are the variables in the multiplier version of the mathematical problem and represent the values multiplied by each input and by each output in order to form the optimal efficiency score (the ratio of weighted outputs to inputs). The 'pure weights' represent marginal rates of
substitution of the inputs and the outputs. Given that the 'pure weights' depend on the unit of measurement of each input and output, they cannot be directly interpreted as the relative contribution of each input and output to the efficiency score. In order to assess the relative contribution of each input and output, it is necessary to use the values of the 'virtual weights', which result from the product of the 'pure weight' by the value of the respective input and output. The reader interested in the methodologies that have been proposed to define weight restrictions and in other developments in the DEA literature is referred to Cook and Seiford [20] and Cooper et al. [21,22].
Since its advent in 1978, DEA has been extensively applied in many sectors including education, finance, agriculture, sports, marketing and manufacturing, to name just a few. For a recent survey on DEA applications the reader is referred to Liu et al. [23]. There have also been some documented applications of DEA in the justice area. For example, it has been used to assess the efficiency of police forces [24-28] and prosecutor offices [29], and to determine the relationship between efficiency of justice services and salaries of judges in European countries [30].
Other methods can also be used to analyse efficiency in this context, such as Stochastic Frontier Analysis (SFA). For a recent review of old and new frontier methods for efficiency measurement, the reader is referred to Krüger [31]. However, when compared with DEA, SFA has the disadvantage of requiring the specification of the functional form that allows the transformation of inputs into outputs. Such specification can be a challenge in this context and a nonparametric technique can be preferable. The advantages of using DEA to assess the efficiency of judicial entities, comparative to other methods, have also been discussed [32]. However, the use of DEA in this area is still scarce. To the best of our knowledge there are only seven studies published in international journals which have modelled and analysed the performance of courts by means of DEA.
The pioneering work on the use of DEA in this area is that of Lewin et al. [32], which analyses the efficiency of 30 judicial districts in North Carolina, containing 100 criminal superior courts. The model adopted used two outputs (number of dispositions and number of cases pending less than 90 days) and five inputs; two of these inputs were controllable (days of court held and number of district attorneys and assistants) and the remaining three were exogenous and, therefore, non-controllable (size of the caseload, number of misdemeanours in the caseload and size of the white population). Although this model can be criticised on the grounds of aggregating the services of the courts too much and not taking account of the heterogeneity between cases, it still provided very valuable insights. In particular, the study found a fairly inefficient sector both at the district and county levels of analysis.
A decade later, Kittelsen and Førsund [33] also made an important contribution to this area. In particular, they assessed the efficiency of 107 district courts in Norway by pooling the observations for the period 1983 to 1988 and using the average value over the six years as the basic observation. They used a DEA model with two inputs and seven outputs aimed at suggesting ways of improving the efficiency of the Norwegian district courts. Contrarily to the
7
previous work, Kittelsen and Førsund [33] did not acknowledge explicitly in their model that the efficiency of the courts might be influenced by exogenous factors as they have only considered the workforce of courts (number of posts as judges and number of office staff) as an input. However, they did acknowledge that the cases judged by the courts are neither homogenous in relative labour intensities nor in total time required. Therefore, the outputs of their model followed the conventional functional division of cases used in the judiciary service. To this purpose, seven major categories of cases were considered: Civil cases; B-cases; Examination and summary jurisdiction cases; Ordinary criminal cases; Registry cases; Cases of duress; Probate and bankruptcy cases. Based on this model, their analysis found a fairly efficient court sector, with the average technical efficiency for all courts above 90%. Furthermore, their study found that most of the inefficiency was scale inefficiency with inefficient courts, on average, being smaller than optimal. Contrary to the work of Lewin et al. [32], they also performed a dynamic analysis by assessing productivity changes in the sector. Using the Malmquist Productivity Index (MPI), they found that the improvement for the six year period was rather weak at about 6%, with 4% due to catching up and 2% due to technology shift.
Tulkens [34] has also evaluated productive efficiency in the provision of judicial services by means of the DEA technique. In particular, he compared the productive efficiency of the 187 Belgian justice of the peace courts, which have a single judge dealing with cases of minor monetary value and arising within a well-defined geographical area called a "canton". The DEA model adopted had only one input (number of clerks) and three outputs (number of settled civil and commercial cases, number of family arbitration sessions held and number of minor offense cases settled). Based on the free disposal hull measure of productive efficiency and using data from 1983 to 1985 he found that the percentage of inefficient courts was in the range of 82% to 87%. In spite of having found an inefficient court sector, Tulkens concluded that only 35% of the prevailing judicial backlog in Belgian justice of peace courts could be reduced by productivity increases that would match peers' best practice. Personnel increases thus seemed to be justified.
Pedraja-Chaparro and Salinas-Jiménez [35], have also added to this body of literature by documenting the use of DEA to assess the efficiency of the Administrative Litigation Division of the Spanish high courts, having analysed 21 units for the year 1991. Their selection of inputs (number of judges and number of office staff) is very similar to that of Kittelsen and Førsund [29]. However, they aggregated the services provided by the high courts into two broad categories of outputs: cases resolved through the full legal process and other resolved cases (e.g. conciliations, withdrawals, dismissals, etc.), which might be criticised on the grounds of not taking into account the heterogeneity between cases. They found considerable scope for improvement in the sector as only 23.8% of the 21 high courts analysed were technically efficient and as the average efficiency of the courts was 77.4%.
Two other studies on the use of DEA to assess the efficiency of courts are those of Schneider [36] and Yeung and Azevedo [37]. The former study aimed to explore the links between the judicial organisation and the courts performance, by using data from 9 German
labour courts of appeal over the period 1980–1998. The main difference in Schneider’s DEA model in comparison with previous ones is that he included a measure of judicial lawmaking in the set of outputs. He obtained an average efficiency score of 88.8% and found evidence that promotion probabilities have a negative impact on the DEA scores. In particular, he found that the higher the average or maximum probability of promotion, the lower court productivity and the more often decisions are reversed by the federal labour court. The latter study used DEA to measure the efficiency of the 27 Brazilian state courts. Yeung and Azevedo [37] used two inputs (i.e. the number of judges and the number of auxiliary staff) and two outputs (i.e. the number of adjudications in the first- and second-degree courts) having found considerable efficiency variations across courts and that the most efficient courts were those that exhibited better internal management and organisation. Like some of the previous studies, the fact that Yeung and Azevedo did not distinguish the content, and therefore, the complexity of the adjudicated lawsuit cases can be pointed as an important limitation.
The other, and most recent study in this area, was conducted by Ferrandino [38], who used DEA to assess the efficiency of Florida’s circuit courts during the period of 1993 to 2008. This study used the total number of judges per circuit as the only input measure, and used as output the dispositions for the entire circuits (criminal, civil, and family courts), having found that only 3 out of 300 Florida circuit courts were technically efficient and that their efficiency deteriorated over time. The fact that both the inputs and outputs were aggregated at such a high level has, however, impacted significantly on the results and poses considerable limitations on the insights that can be drawn from the analysis.
These studies have improved our understanding of the potential of using DEA to assess the efficiency of courts, however more research is still required. In particular, it is fundamental to extend the number of DEA applications in this specific context and develop models that account for the heterogeneity and complexity of cases to a greater extent. Considering the remarkable variety of cases that can be brought to courts, aggregating these cases into a few broad categories, as has been done by previous research, is likely to introduce bias into the assessment and result in missing some valuable insights for learning and improvement. In the next section we discuss this issue in further detail and propose a model which explicitly considers the different nature and complexity of cases, providing the foundations for fairer comparisons of courts. In so doing, this research expands the theory and the available empirical applications reported in the literature, increasing our understanding of the value of the DEA technique in this particular context.
Furthermore, to the best of our knowledge, there are no published studies on the use of DEA to evaluate the relative efficiency of the Portuguese judicial system. Frameworks have been proposed to assess the performance of the Portuguese courts [8,39]. However, these frameworks have tended to rely on the use of multiple performance indicators detailing different aspects of the performance of the courts. Whilst valuable, it is well known that the use of multiple performance measures or ratios alone presents strong limitations in carrying out comparative analyses of courts, as some courts may rank higher on certain indicators, while
9
lower according to others, making it difficult to derive a single aggregate measure of the relative performance of each of the courts. This problem could be addressed if it was possible to reach an agreement on the relative importance of the various performance indicators. This is, however, seldom the case as the importance of each indicator is dependent upon the perspective taken and dependent upon the priorities of the court under evaluation. In contrast to the use of multiple indicators, ratio analyses and parametric frontier estimation approaches, the DEA technique allows the calculation of a single aggregate measure of relative efficiency, handles multiple input and output factors, does not require a priori weights or prices and allows adjustment for non-controllable factors. These characteristics make the DEA technique a useful and relevant approach to perform efficiency analyses in the judicial context. Therefore, by aiming to reach the objectives mentioned above, this paper makes an important contribution to the literature in this area, and is of interest to both policy makers and researchers.
4. The relative efficiency of the Portuguese courts of first instance
4.1. The DEA model
The identification and selection of appropriate input and output variables is a fundamental step in the DEA analysis. Nataraja and Johnson [40] compare some of the most widely-used approaches to guide variable specification in DEA. The objective of the different approaches is to select a set of inputs and outputs that are policy relevant and for which a significant statistical relationship exists. In the context of the courts of first instance the outputs are mainly related to the level of services they provide to the litigants and the inputs are related to the level of resources used for that purpose. When using DEA to assess the performance of the courts of first instance it is assumed that inputs are to be minimised or outputs maximised.
In the context of any judicial system, it is reasonable to assume that the resolution of disputes is the basic service provided by the courts of first instance. Considering that dispute resolution is predominantly labour intensive, and that the labour cost per finished case can reach as much as 90% of the total cost per case [35], staff is undoubtedly the main input in the courts of first instance production/resolution process. Given the different work contents and roles that are played by the staff at the courts of first instance, we decided to use two input variables capturing the two main categories of staff that operate at a court level: judges (input 1) and support staff (input 2). This definition of inputs is consistent with previous research [30, 33,35,37].
Regarding the output variables, the output of a court of first instance in terms of dispute resolution can be captured by the number of cases finished during a specific period. Considering the variety of court cases that exists, previous research has grouped these cases into a few broad categories. This procedure might ensure discrimination in the DEA results and addresses some of the heterogeneity between cases, however, it does not fully account for the difference in complexity and work content of different cases and, consequently, can introduce bias in the performance assessment of courts. This fact can be easily illustrated by using data
from 2011, which is the most recent year for which we have data available for the Portuguese courts of first instance.
If we analyse the average time taken by the Portuguese courts to resolve a case in each of the five major procedural areas, we conclude that it took them on average 29 months to resolve a civil justice case, 9 months to resolve a criminal justice case, 13 months to resolve a labour justice case, 7 months to resolve a labour-criminal justice case and 13 months to resolve a family justice case. This clearly suggests that, on average, civil justice cases are more complex or at least more time consuming than the cases included in the other four procedural areas. Therefore, it seems that an acceptable way to proceed with the DEA analysis would be to define two (e.g. civil justice cases and other cases) or at most five broad categories of cases, corresponding to each of the five procedural areas. However, when we take a closer look at the types of court procedures included in each procedural area, and at the types of court proceedings within each type of procedure (please see Table A.1 in Appendix A), it becomes obvious that the level of aggregation suggested above would be inappropriate.
For instance, within the civil justice procedural area we have 5 different types of procedures and at least 17 different types of proceedings, with some taking on average 2 months to be resolved, whereas others take as long as 100 months to finish. This variety in the complexity of cases also occurs in the other procedural areas and allows us to conclude that the aggregation of cases into procedural areas, or even into the different types of procedures can be inappropriate in two different ways. Firstly, it can bias the comparative analysis of courts by penalising those that have more complex cases in their caseloads, as these take longer to conclude and, therefore, lead to a smaller number of finished cases per year. Secondly, it prevents decision makers gaining deep insights into the different case management strategies of each court as data would be aggregated at a too-high level. The insights derived from the identification and analysis of the optimal weight structure chosen by courts are considerably richer when the results allow decision makers to understand how each court has distributed the weights amongst the different types of proceedings, and in this way identify those proceedings that each court is managing most efficiently.
In order to address these limitations, we suggest the aggregation of cases by type of proceeding rather than by type of procedure or procedural area. This will account for the heterogeneity of cases to a much greater extent than has been done by previous studies. The model we propose to compare the performance of the Portuguese courts of first instance has, therefore, 2 inputs and 43 output variables, the latter corresponding to the number of cases finished by the first instance courts under analysis during the period 2007-2011 for each one of the different types of proceedings (please see the third column of Table A.1 in Appendix A). Although this model is in accordance with the guideline proposed by Friedman and Sinuany-Stern [41], which states that the total number of inputs and outputs should be less than one third of the number of DMUs in the analysis, it is important to bear in mind that the greater the number of variables in a DEA model, the higher the risk of low discrimination in the results. Therefore, considering that the number of types of proceedings handled by the Portuguese
11
courts is very high, in order to ensure meaningful DEA results it is important to impose restrictions on the weights that courts can give to each type of proceeding. Unless weight restrictions are imposed, there is a high risk of low discrimination and unrealistic results as some courts might be shown as efficient just because they have the highest resolution rate of a particular type of proceeding per member of staff compared to other courts, although these proceedings might represent a very small fraction of the total caseload of the courts.
The procedure we propose to define meaningful weight restrictions and to address the issue above consists of defining production trade-offs capturing the complexity of the different types of proceedings. As emphasised by Podinovsky [42], the use of realistic production trade-offs improves the discrimination of the results and at the same time preserves the traditional meaning of efficiency as a radial improvement factor for inputs and outputs. To this effect, we use the average duration taken by all courts to resolve a particular type of proceeding as a proxy of its complexity. That is to say that a proceeding i lasting on average 24 months to conclusion is assumed to be more complex than a proceeding j lasting on average say, 18 months. Therefore, we assume that no extra resources can be claimed by courts if proceedings type i are reduced by n and proceedings type j are increased by n.
The weight restrictions (1) to (42) shown in Appendix B express the trade-offs between the different types of proceedings resolved in 2011 and were defined by using information regarding the average duration of each case as shown in the last column of Table A.1 in Appendix A. For example, restriction (1) u4 – u21 ≥ 0 captures the fact that the proceedings “common enforcement (before 15th September 2003)” (O4) are more complex than the proceedings “transgression” (O21), as the former take on average 100 months to solve and the latter take on average 79 months. The same rationale was used for the other 41 weight restrictions and for the other four years under analysis. The weight restrictions were developed following the approach proposed by Podinovski [42], and represent realistic production trade-offs between the different types of proceedings, whilst still allowing enough flexibility to the courts in the choice of weights.
Restriction (43) v1 – v2 ≥ 0 aims, in turn, to establish meaningful production trade-offs between the two inputs. In particular, this restriction states that if the number of support staff decreases by one and the number of judges increases by one, there should be no detriment to the level of finished cases. We are assuming that the work carried out by a support staff member could also be carried out by a judge, but the reverse is not true. This assumption is justified by the description in the law of the work carried out by a judge and by a member of the support staff. Whilst a judge is supposed to undertake specialised judicial work [43], a support staff member is supposed to undertake general secretarial work, such as receiving applications, giving information and providing secretarial support during audiences [44].
In addition to the controllable inputs and outputs, there are occasions where it might be important to consider non-discretionary variables in order to take into account and to adjust for differences in the operating environment among court jurisdictions. Non-controllable inputs are not minimised as non-controllable outputs are not maximised. They are included in the DEA
models just to ensure comparable technologies. In this particular context, the DEA technique can handle, for example, factors such as the demographic and socioeconomic characteristics of court jurisdictions (e.g. population size, income, education), which may affect court outputs, but over which courts have no control. Some of these factors may, indeed, affect the complexity of the cases received by each court. However, considering that we have disaggregated the output variables to account for the different types of proceedings and have included weight restrictions to account for the complexity of the different types of cases, the risk of leaving out relevant factors is minimised.
Some previous studies [32,36] have used the courts’ caseload as a non-discretionary input. The caseload is the sum of the number of filed cases during the year and the number of pending cases at the beginning of that year, being an important variable to account for some of the non-controllable factors mentioned previously. It might also be important to consider the caseload because courts cannot provide services unless lawsuits are filed. In the case of the Portuguese courts of first instance, we believe that it is not appropriate to use the caseload as an input for two main reasons. Firstly, all courts have a caseload level much higher than the level of cases they are able to finish each year. For example, in 2011, which is the most recent year for which we have data, the number of cases completed by each of the Portuguese courts of first instance represented, on average, only 33% of their caseload levels.Even the court that resolved a higher proportion of pending cases in 2011 only managed to resolve 55 percent of its caseload. This suggests, therefore, that the level of services the courts provide is not significantly restricted by their caseload levels. Secondly, the caseload levels are mostly a result of lack of resources and/or poor performance of courts in previous years, which means that including them in the analysis, could bias the results. In particular it could end up showing some courts being weakly efficient when compared to others not because they finished fewer cases in a particular year, but because they had higher caseload levels.
Although the caseload and other variables might be used to explain judicial systems’ efficiency [45], it is important to emphasise that the set of variables chosen for our DEA analysis is widely accepted in the literature, and accurately reflects the productive activity of the Portuguese courts of first instance.
4.2. Data and results
The data used in this study refers to the activity of 223 different courts of first instance operating in at least one year from 2007 to 2011. These years are the last five years for which we have comparable data available and it was obtained from the website of the Portuguese Directorate-General for Justice Policy (http://www.dgpj.mj.pt). Twenty two of the first instance courts were excluded from at least one of the years assessed because they were considered outliers. Outliers were detected by following the procedure proposed by Banker and Gifford [46] and using a pre-specified screen level of 1.2, which has proven effective in identifying those observations that are more likely to be contaminated with noise [47]. For alternative procedures
13
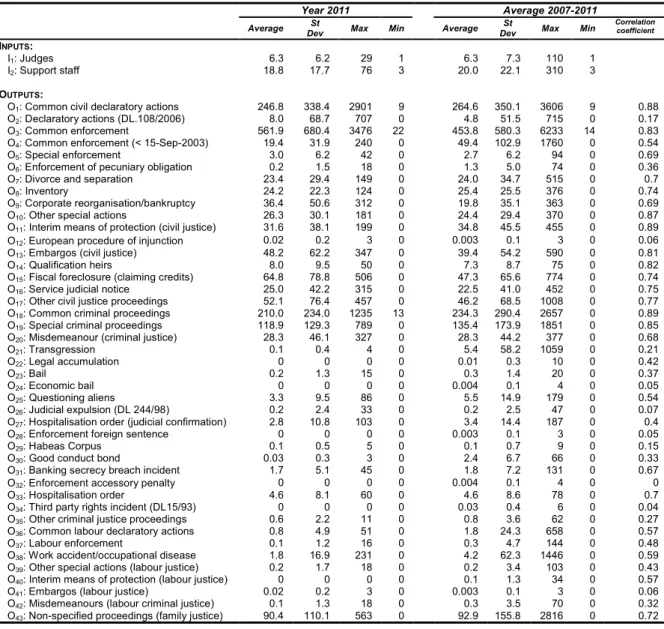
to detect outliers the reader is referred to, for example, Simar [48] and Bellini [49]. Table 1 presents the summary statistics regarding the 45 variables used in the DEA model as well as the Pearson correlation coefficients between the variables total staff and each one of the different types of proceedings handled and finished by the first instance courts during 2007 to 2011.
Table 1 - Summary statistics and correlation coefficients of the variables used in the DEA model for the Portuguese courts of first instance – Years 2007 to 2011
Year 2011 Average 2007-2011
Average St
Dev Max Min Average St
Dev Max Min
Correlation coefficient INPUTS: I1: Judges 6.3 6.2 29 1 6.3 7.3 110 1 I2: Support staff 18.8 17.7 76 3 20.0 22.1 310 3 OUTPUTS:
O1: Common civil declaratory actions 246.8 338.4 2901 9 264.6 350.1 3606 9 0.88
O2: Declaratory actions (DL.108/2006) 8.0 68.7 707 0 4.8 51.5 715 0 0.17
O3: Common enforcement 561.9 680.4 3476 22 453.8 580.3 6233 14 0.83
O4: Common enforcement (< 15-Sep-2003) 19.4 31.9 240 0 49.4 102.9 1760 0 0.54
O5: Special enforcement 3.0 6.2 42 0 2.7 6.2 94 0 0.69
O6: Enforcement of pecuniary obligation 0.2 1.5 18 0 1.3 5.0 74 0 0.36
O7: Divorce and separation 23.4 29.4 149 0 24.0 34.7 515 0 0.7
O8: Inventory 24.2 22.3 124 0 25.4 25.5 376 0 0.74
O9: Corporate reorganisation/bankruptcy 36.4 50.6 312 0 19.8 35.1 363 0 0.69
O10: Other special actions 26.3 30.1 181 0 24.4 29.4 370 0 0.87
O11: Interim means of protection (civil justice) 31.6 38.1 199 0 34.8 45.5 455 0 0.89
O12: European procedure of injunction 0.02 0.2 3 0 0.003 0.1 3 0 0.06
O13: Embargos (civil justice) 48.2 62.2 347 0 39.4 54.2 590 0 0.81
O14: Qualification heirs 8.0 9.5 50 0 7.3 8.7 75 0 0.82
O15: Fiscal foreclosure (claiming credits) 64.8 78.8 506 0 47.3 65.6 774 0 0.74
O16: Service judicial notice 25.0 42.2 315 0 22.5 41.0 452 0 0.75
O17: Other civil justice proceedings 52.1 76.4 457 0 46.2 68.5 1008 0 0.77
O18: Common criminal proceedings 210.0 234.0 1235 13 234.3 290.4 2657 0 0.89
O19: Special criminal proceedings 118.9 129.3 789 0 135.4 173.9 1851 0 0.85
O20: Misdemeanour (criminal justice) 28.3 46.1 327 0 28.3 44.2 377 0 0.68
O21: Transgression 0.1 0.4 4 0 5.4 58.2 1059 0 0.21 O22: Legal accumulation 0 0 0 0 0.01 0.3 10 0 0.42 O23: Bail 0.2 1.3 15 0 0.3 1.4 20 0 0.37 O24: Economic bail 0 0 0 0 0.004 0.1 4 0 0.05 O25: Questioning aliens 3.3 9.5 86 0 5.5 14.9 179 0 0.54 O26: Judicial expulsion (DL 244/98) 0.2 2.4 33 0 0.2 2.5 47 0 0.07
O27: Hospitalisation order (judicial confirmation) 2.8 10.8 103 0 3.4 14.4 187 0 0.4
O28: Enforcement foreign sentence 0 0 0 0 0.003 0.1 3 0 0.05
O29: Habeas Corpus 0.1 0.5 5 0 0.1 0.7 9 0 0.15
O30: Good conduct bond 0.03 0.3 3 0 2.4 6.7 66 0 0.33
O31: Banking secrecy breach incident 1.7 5.1 45 0 1.8 7.2 131 0 0.67
O32: Enforcement accessory penalty 0 0 0 0 0.004 0.1 4 0 0
O33: Hospitalisation order 4.6 8.1 60 0 4.6 8.6 78 0 0.7
O34: Third party rights incident (DL15/93) 0 0 0 0 0.03 0.4 6 0 0.04
O35: Other criminal justice proceedings 0.6 2.2 11 0 0.8 3.6 62 0 0.27
O36: Common labour declaratory actions 0.8 4.9 51 0 1.8 24.3 658 0 0.57
O37: Labour enforcement 0.1 1.2 16 0 0.3 4.7 144 0 0.48
O38: Work accident/occupational disease 1.8 16.9 231 0 4.2 62.3 1446 0 0.59
O39: Other special actions (labour justice) 0.2 1.7 18 0 0.2 3.4 103 0 0.43
O40: Interim means of protection (labour justice) 0 0 0 0 0.1 1.3 34 0 0.57
O41: Embargos (labour justice) 0.02 0.2 3 0 0.003 0.1 3 0 0.06
O42: Misdemeanours (labour criminal justice) 0.1 1.3 18 0 0.3 3.5 70 0 0.32
O43: Non-specified proceedings (family justice) 90.4 110.1 563 0 92.9 155.8 2816 0 0.72
During 2007 to 2011 the first instance courts analysed had an average total caseload of 989,644 cases per year, with the highest level being observed in 2011 (1,032,220 cases) and the lowest in 2008 (944,359 cases). From these cases, the first instance courts were able to finish only about a third of them, causing a substantial backlog of cases for the following years. This, together with the fact that the number of new cases per year has been consistently higher than the number of cases finished, signals an unsustainable situation.
From the analysis of the data, and using 2011 as an example, it is also possible to observe that the courts compared in this study vary considerably in size ranging from a caseload of 349
to one of 31,925 cases, and employing from 5 to 101 members of staff, including judges and other support personnel. The total number of cases resolved also varied considerably across courts, from a minimum of 111 to a maximum of 9,145 cases. From Table 1 we can also confirm that in the five-year period not all courts handled and finished all types of proceedings. The most frequent types of proceedings resolved by the Portuguese courts of first instance during 2007 to 2011 were the “common enforcement” (O3) and the “common civil declaratory actions” (O1) belonging to the civil procedural area, and the “common proceedings” (O18) belonging to the criminal procedural area. Together, these three types of proceedings account for around 60% of the total amount of proceedings finished during 2007 to 2011. On the opposite side, the proceedings “European procedure of injunction” (O12), “embargos (labour justice)” (O12) and “enforcement of foreign sentence” (O28) are the less frequent ones. Although these and some other types of proceedings account for a small proportion of the cases handled by the Portuguese courts, excluding them from the analysis or pooling them in a “residual” category would cause loss of important information regarding case management strategies and/or exogenous demand factors and would likely penalise some of the courts that use time and resources handling these proceedings.
In order to achieve our first objective, and determine the extent to which the empirical evidence supports the public perception that the Portuguese judicial system has considerable scope for improvement in terms of efficiency, we ran an output oriented DEA model for each of the five years under analysis using the PIM DEA software [50]. The results were then confirmed by an independent researcher using the EMS software [51]. The output orientation is justified by reasoning that the Portuguese courts have a very large backlog of cases and therefore should aim to increase the resolution of cases, given the existing staff levels. Furthermore, we have used an assumption of variable returns to scale as proposed by Banker et al. [17]. This assumption is justified because the courts vary considerably in size, and size can be an important factor in determining the cost structure and the production of services by courts [52]. As discussed previously, a set of weight restrictions was also imposed in order to ensure meaningful results. Table 2 presents the summary of the results obtained.
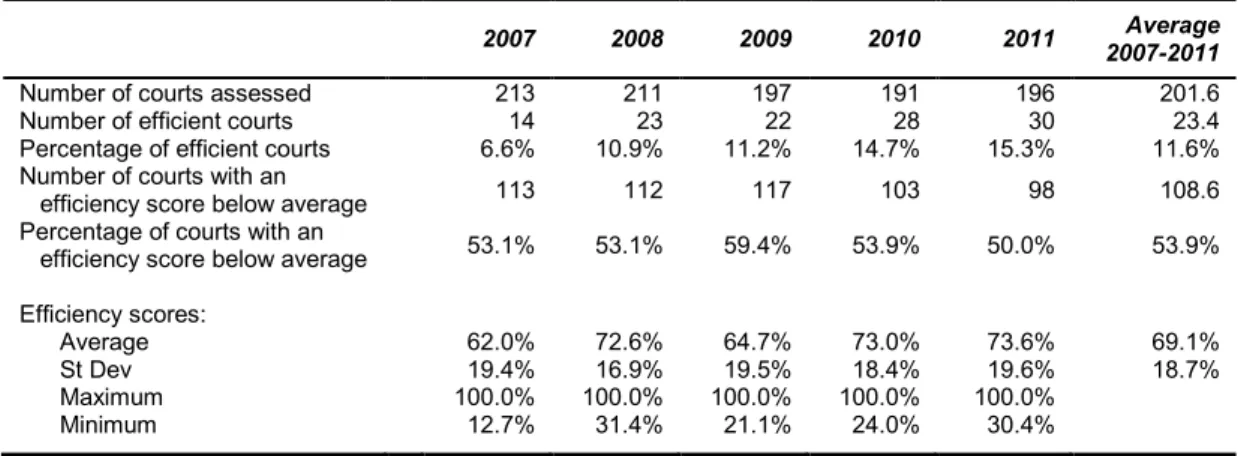
Table 2 – Summary statistics of the efficiency results for the period 2007 to 2011
2007 2008 2009 2010 2011 Average 2007-2011 Number of courts assessed 213 211 197 191 196 201.6 Number of efficient courts 14 23 22 28 30 23.4 Percentage of efficient courts 6.6% 10.9% 11.2% 14.7% 15.3% 11.6% Number of courts with an
efficiency score below average 113 112 117 103 98 108.6 Percentage of courts with an
efficiency score below average 53.1% 53.1% 59.4% 53.9% 50.0% 53.9%
Efficiency scores:
Average 62.0% 72.6% 64.7% 73.0% 73.6% 69.1% St Dev 19.4% 16.9% 19.5% 18.4% 19.6% 18.7% Maximum 100.0% 100.0% 100.0% 100.0% 100.0%
15
The results on Table 2 largely confirm the perception that inefficiency is a major problem of the Portuguese first instance courts and that efficiency varies significantly across the country. From Table 2 we can observe that the number of courts making an efficient use of resources in the five-year period is very low, although the percentage of efficient courts has increased over the years. The fact that only 15.3% of the first instance courts assessed in 2011 were classified as technically efficient, that 50.0% of the inefficient courts achieved efficiency scores below average and that the average efficiency score was 73.6% suggests significant scope for improvement in the number of cases resolved given the local demands and the current levels of resources provided to the courts. This is particularly relevant as 2011 is simultaneously the most recent year for which we have data available and when the first instance courts achieved their best performance. Table 2 also indicates that efficiency varies considerably across the country as the standard deviation associated with the efficiency of the courts ranges from 16.9% to 19.6% in the five years analysed.
Although several factors might help explain the differences in the efficiency of the courts, the results above suggest that better case management, based on the sharing of best practices, has the potential to significantly improve the efficiency levels of the Portuguese courts of first instance. Table 3 shows some of the courts with the greatest scope for improvement and some of the most robust benchmarks.
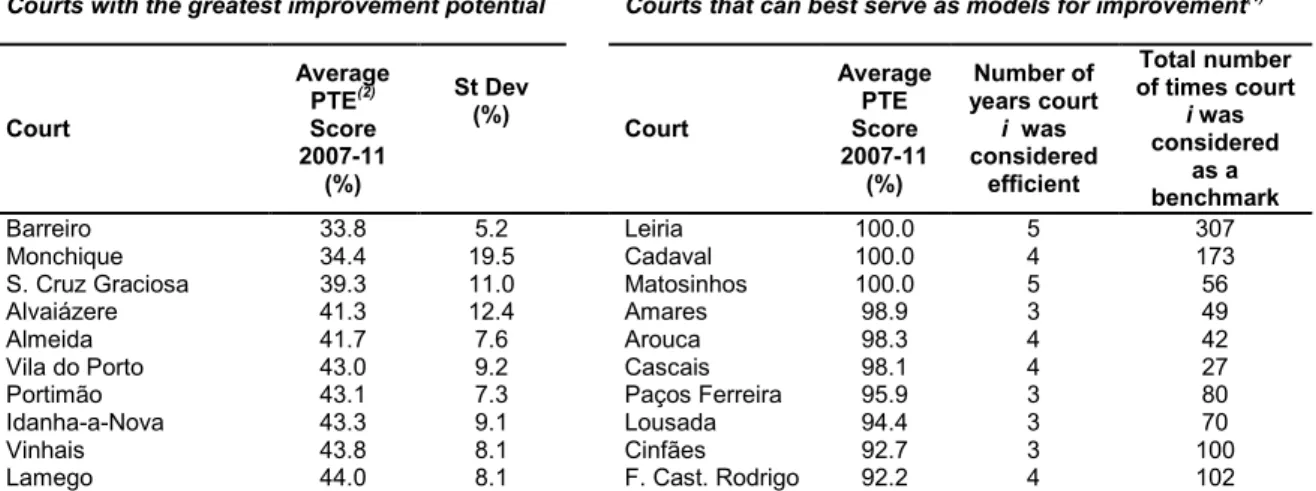
Table 3 – Courts with the greatest improvement potential and most robust benchmarks
Courts with the greatest improvement potential Courts that can best serve as models for improvement(1)
Court Average PTE(2) Score 2007-11 (%) St Dev (%) Court Average PTE Score 2007-11 (%) Number of years court i was considered efficient Total number of times court i was considered as a benchmark Barreiro 33.8 5.2 Leiria 100.0 5 307 Monchique 34.4 19.5 Cadaval 100.0 4 173
S. Cruz Graciosa 39.3 11.0 Matosinhos 100.0 5 56
Alvaiázere 41.3 12.4 Amares 98.9 3 49
Almeida 41.7 7.6 Arouca 98.3 4 42
Vila do Porto 43.0 9.2 Cascais 98.1 4 27
Portimão 43.1 7.3 Paços Ferreira 95.9 3 80
Idanha-a-Nova 43.3 9.1 Lousada 94.4 3 70
Vinhais 43.8 8.1 Cinfães 92.7 3 100
Lamego 44.0 8.1 F. Cast. Rodrigo 92.2 4 102
Note: 1Although several other courts have been identified as technically efficient in at least one of the years analysed and serve as benchmark for several courts, in Table 3 we show only those that obtained the highest average efficiency score during the five-year period and that were considered efficient in at least 3 out of the 5 years analysed. 2PTE: Pure Technical Efficiency.
As displayed in Table 3, Barreiro’s court displayed the lowest average efficiency score within the courts assessed. For instance, from a caseload of 9,977 cases in 2011, its 23 judges and 56 support staff were able to complete only 2,572 cases, which is less than 26% of the caseload. The poor performance results of this court can be understood in more detail when we compare its productivity levels with the productivity levels of its peers.
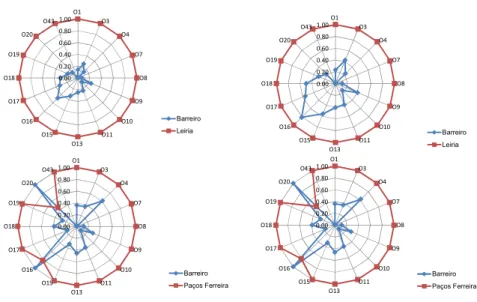
Figure 1 displays the number of proceedings finished in 2011 per judge (radar graphs on the left) and per support staff (radar graphs on the right) in Barreiro’s court as a percentage of the
proceedings finished by its benchmarks (i.e. the first instance courts in Leiria and Paços de Ferreira). Only the types of proceedings handled by at least one of the courts under comparison and representing one or more percent of the overall number of cases resolved in 2011 by these courts are represented in Figure 1.
As can be seen, the number of the different types of proceedings finished per judge and per support staff member in Barreiro’s court is much smaller than in Leiria and Paços de Ferreira’ courts. The only types of proceedings where the productivity of the judges and of the support staff in Barreiro’s court outperforms the performance of one of its benchmarks is for “service judicial notice” proceedings (O16) and “misdemeanour” proceedings (O20), where the staff in the court of Barreiro show better performance than the staff in the court of Paços de Ferreira. As these two types of proceedings account for only 3.2% of the total cases finished by the 3 courts compared and they are not as complex as some of the others, the better productivity of the judges and support staff in handling these proceedings in Barreiro’s court compared to Paços de Ferreira, is not enough to compensate for the much poorer results regarding the other types of proceedings.
Figure 1 – Comparing the efficiency of Barreiro’s court with the efficiency of its peers
Table 3 also shows those courts with the most robust performances and which can represent important platforms for learning, namely: Leiria, Cadaval, Matosinhos, Amares, Arouca, Cascais, Paços de Ferreira, Lousada, Cinfães and Figueira Castelo Rodrigo. Each of these 10 courts was considered efficient in at least three of the five years assessed and obtained an average efficiency score above 92%. The only courts that were considered technically efficient in the five consecutive years were the ones in Leiria and Matosinhos. It is also worth noting that the number of courts for which Leiria is a benchmark has increased considerably over the years. For instance, 8.0% of the inefficient courts identified Leiria as a peer in 2007, 18.9% in 2009 and 62.7% in 2011. A post-evaluation study aimed at analysing the processes and
0.00 0.20 0.40 0.60 0.80 1.00 O1 O3 O4 O7 O8 O9 O10 O11 O13 O15 O16 O17 O18 O19 O20 O43 Barreiro Leiria 0.00 0.20 0.40 0.60 0.80 1.00 O1 O3 O4 O7 O8 O9 O10 O11 O13 O15 O16 O17 O18 O19 O20 O43 Barreiro Paços Ferreira 0.00 0.20 0.40 0.60 0.80 1.00 O1 O3 O4 O7 O8 O9 O10 O11 O13 O15 O16 O17 O18 O19 O20 O43 Barreiro Leiria 0.00 0.20 0.40 0.60 0.80 1.00 O1 O3 O4 O7 O8 O9 O10 O11 O13 O15 O16 O17 O18 O19 O20 O43 Barreiro Paços Ferreira
17
practices implemented in this and other good performers can be a valuable exercise to establish learning networks between courts and ultimately improve the efficiency of the Portuguese judicial system. This will be the subject of further research.
The fact that the DEA technique provides the inefficient courts with specific targets they need to achieve to become efficient and indicates which courts they should use as references for learning and improvement, is a major advantage of this technique. The insights provided by the DEA in this specific example and context can be particularly rich because, contrarily to previous research, court cases were aggregated at the level of proceedings rather than at the level of procedures or procedural areas. This allows a more detailed guidance to courts and a more thorough analysis of each court’s strengths and weaknesses, especially when the information about the efficiency scores and targets is complemented with the information regarding the weight distribution.
Despite the fact that the DEA model may yield alternative optimal solutions for the weights of the courts classified as efficient [53], the different optimal weights identified can still provide very useful information. For instance, the different optimal output weight profiles can be useful to identify different service delivery strategies. However, some care needs to be taken when interpreting these profiles as the weights might also be influenced by exogenous demand and by the restrictions imposed to account for the complexity of the different cases.
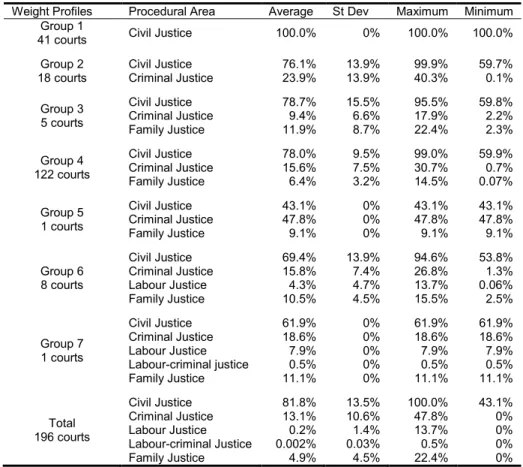
Table 4 synthesises the most relevant service delivery strategies identified in the 196 courts analysed in 2011.
Table 4 – Virtual weights attributed by the courts to the different procedural areas in 2011 Weight Profiles Procedural Area Average St Dev Maximum Minimum
Group 1
41 courts Civil Justice 100.0% 0% 100.0% 100.0%
Group 2 18 courts Civil Justice Criminal Justice 76.1% 23.9% 13.9% 13.9% 99.9% 40.3% 59.7% 0.1% Group 3 5 courts Civil Justice Criminal Justice Family Justice 78.7% 9.4% 11.9% 15.5% 6.6% 8.7% 95.5% 17.9% 22.4% 59.8% 2.2% 2.3% Group 4 122 courts Civil Justice Criminal Justice Family Justice 78.0% 15.6% 6.4% 9.5% 7.5% 3.2% 99.0% 30.7% 14.5% 59.9% 0.7% 0.07% Group 5 1 courts Civil Justice Criminal Justice Family Justice 43.1% 47.8% 9.1% 0% 0% 0% 43.1% 47.8% 9.1% 43.1% 47.8% 9.1% Group 6 8 courts Civil Justice Criminal Justice Labour Justice Family Justice 69.4% 15.8% 4.3% 10.5% 13.9% 7.4% 4.7% 4.5% 94.6% 26.8% 13.7% 15.5% 53.8% 1.3% 0.06% 2.5% Group 7 1 courts Civil Justice Criminal Justice Labour Justice Labour-criminal justice Family Justice 61.9% 18.6% 7.9% 0.5% 11.1% 0% 0% 0% 0% 0% 61.9% 18.6% 7.9% 0.5% 11.1% 61.9% 18.6% 7.9% 0.5% 11.1% Total 196 courts Civil Justice Criminal Justice Labour Justice Labour-criminal Justice Family Justice 81.8% 13.1% 0.2% 0.002% 4.9% 13.5% 10.6% 1.4% 0.03% 4.5% 100.0% 47.8% 13.7% 0.5% 22.4% 43.1% 0% 0% 0% 0%
As shown in Table 4, seven major different output weight profiles can be identified. Profile 1 includes the courts of first instance which have placed all the output weight in the proceedings belonging to just one procedural area. In particular, the 41 courts belonging to this profile gave all the output weight to the civil justice procedural area suggesting that their productivity levels in solving civil cases are higher than in solving other types of cases, when compared to other courts. This might indicate that the civil cases are the most common in these courts and are those the courts’ workforces handle more frequently. Profile 2 includes 18 courts of first instance which have placed all the output weight in the proceedings belonging to only two procedural areas: civil justice and criminal justice. The average virtual weight given to the former was 76.1%, with the latter receiving an average virtual weight of 23.9%.
Profiles 3, 4 and 5 are formed by courts which have distributed the virtual weight by three procedural areas: civil, criminal and family. There are, however, important differences in the service delivery strategies across these three profiles. For instance, the 5 first instance courts included in Profile 3 have given an equal or higher virtual weight to the family procedural area (average weight of 11.9%) than to the criminal procedural area (average weight of 9.4%). In contrast, the 122 courts included in Profile 4, the most common profile, have given a higher virtual weight to the criminal procedural area (average weight of 15.6%) than to the family procedural area (average weight of 6.4%). This suggests that the family cases are more common or are handled more efficiently by the former group, and that the criminal cases are more common or the ones handled more efficiently by the latter group. In both profiles the virtual weight given to the civil procedural area was at least 50% of the total output virtual weight, which indicates that when compared to other courts, the relative productivity of the judges and other staff in solving civil cases in these courts is higher than the productivity in solving the cases in the other two procedural areas put together. Profile 5 represents, however, a slightly different service delivery strategy and/or demand pattern. In this profile, the virtual weight given to the cases in the civil justice procedural area no longer represents 50 percent or more of the total weight. This is one of the two rarest profiles identified as it is formed by only one of the 196 courts assessed.
Finally we have Profile 6 and 7. Profile 6 is formed by the 8 courts which distributed their virtual weights by four procedural areas. Only the labour-criminal procedural area was not included in the efficiency scores of these courts. Profile 7 includes the only court which has given weight to the five procedural areas. The contribution of the labour-criminal procedural area to the efficiency score of this court is, however, residual (0.5%).
Regarding the contribution of the five procedural areas to the efficiency scores of the courts, civil justice has the largest contribution accounting for 81.8% of the average total score. Criminal justice is the second, and its contribution is 13.1% of the average total score. Family justice comes in third place with 4.9%. Finally labour justice and labour-criminal justice have the smallest contribution, accounting for only 0.2% and 0.002% of the average total efficiency score of the courts, respectively. The results for 2007 to 2010 are similar. The fact that the labour justice proceedings’ contribution to the efficiency scores of the courts assessed is very low is
19
not surprising as there are in Portugal specialised courts that handle this type of proceedings and therefore, the number of cases in this procedural area that are brought to first instance general jurisdiction courts, is very small.
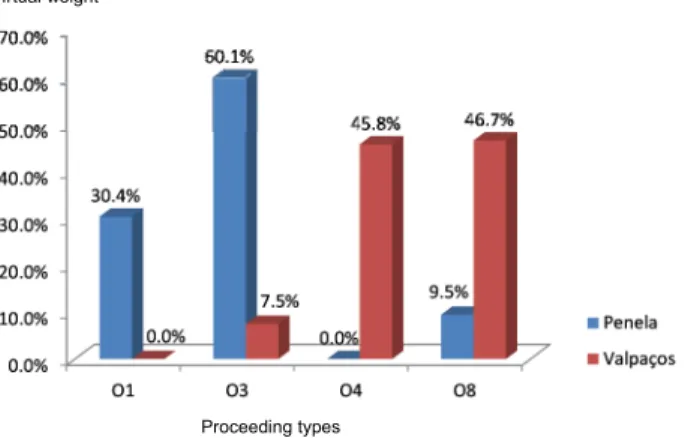
It is important to emphasise, however, that the fact that two different courts belong to the same profile regarding weight distribution by procedural area does not necessarily mean that they are following the same strategy in which the resolution of the different types of proceedings is concerned. For example, in 2011, both the Penelas’s court and the Valpaços’s court are inefficient and belong to Profile 1 in the sense that they are solving comparatively more cases in the civil area than in the other four procedural areas. This is indicated by the fact that in Figure 2 both courts are giving all their virtual weight to proceedings belonging to the civil procedural area. However, when we analyse their weight structure per type of proceeding, we clearly see remarkable differences between them. In particular, it is possible to verify that the proceedings that most contribute to the efficiency scores of each of the courts are different. For example, Figure 2 indicates that the productivity levels of the staff members in Penela’s court is considerably higher resolving proceedings O3 (common enforcement) than resolving proceedings O4 (Common enforcement < 15-Sep-2003) and O8 (inventory), as the virtual weight attributed to the former is considerably higher.
Figure 2 – Virtual weight distribution of two courts by type of proceedings – Year 2011
The decomposition of each court’s efficiency score in terms of the contribution of the different types of proceedings, as illustrated in Figure 2, is very important because it allows each court to identify its weak and strong areas and make the necessary improvements. For example, the court in Valpaços is best in resolving proceedings O4 (Common enforcement < 15-Sep-2003) and O8 (inventory), whilst the court in Penela is best in resolving proceedings O3 (Common enforcement) and O1 (Common civil declaratory actions). These courts are both classified as inefficient when compared with other courts with similar weight structures. For example, the benchmarks for Penela are: Évora, Felgueiras, Macedo de Cavaleiros and Serpa. These four courts achieve a score of 100% even when they experiment the optimal weight structure identified for Penela. In this respect, Penela should therefore undertake meetings with
Virtual weight
these courts in order to learn about the structures and mechanisms which allow them to be efficient. In addition to this, the analysis of the weights by type of proceeding rather than by procedural area can also provide other useful information, as depicted in Figure 3.
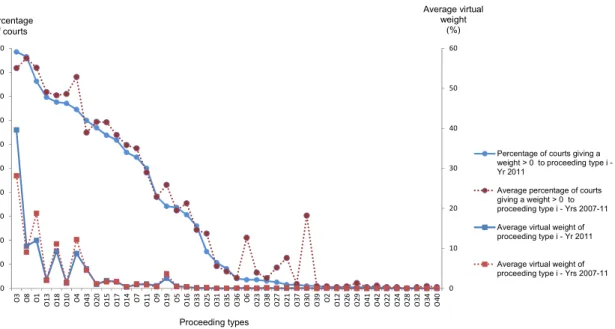
Figure 3 – Virtual weight distribution of the courts by the 43 different proceeding types
From the analysis of this figure, we can observe for example that the type of proceedings to which more courts have given weight in 2011 and which has the highest average virtual weight is the “common enforcement proceeding” (O3). The average contribution of this proceeding to the efficiency scores of the courts assessed in 2011 is 39.6% and 193 out of the 196 courts assessed have chosen to give a positive weight to this variable. The “inventory proceeding” (O8) was also chosen by a high number of courts. More specifically, there were only seven first instance courts in 2011 which did not take into consideration this type of proceeding in their efficiency scores, suggesting comparatively low resolution levels of this type of proceedings. It is interesting to note, however, that although most courts have chosen this variable, its average contribution to the efficiency score is much smaller than in the case of the “common enforcement proceedings”, as the “inventory proceeding” accounts of only 10.5% of the efficiency score of the courts in 2011. As Figure 3 illustrates, the contribution of each proceeding type to the efficiency scores of the courts in 2011 and the percentage of courts giving weight to each type of proceeding is also reflected in the other years as shown by the lines representing the average values for the period 2007 to 2011. The only differences worth mentioning are those related to proceedings O6, O21 and O30 where we can observe that the percentage of courts giving a positive weight to these proceedings in 2011 is considerably lower than those giving them a weight during 2007 to 2010. This is related with the fact that in 2011 only 61 cases were finished and only 11 courts were involved in their resolution. The number of courts resolving these types of proceedings (and the number of cases finished) in the other years, particularly in 2007 and 2008, was much larger, which explains why more courts have
0 10 20 30 40 50 60 0 10 20 30 40 50 60 70 80 90 100 O 3 O 8 O 1 O 1 3 O 1 8 O 1 0 O 4 O 4 3 O 2 0 O 1 5 O 1 7 O 1 4 O 7 O 1 1 O 9 O 1 9 O 5 O 1 6 O 3 3 O 2 5 O 3 1 O 3 5 O 3 6 O 6 O 2 3 O 3 8 O 2 7 O 2 1 O 3 7 O 3 0 O 3 9 O 2 O 1 2 O 2 6 O 2 9 O 4 1 O 4 2 O 2 2 O 2 4 O 2 8 O 3 2 O 3 4 O 4 0
Percentage of courts giving a weight > 0 to proceeding type i -Yr 2011
Average percentage of courts giving a weight > 0 to proceeding type i - Yrs 2007-11 Average virtual weight of proceeding type i - Yr 2011 Average virtual weight of proceeding type i - Yrs 2007-11
Average virtual weight (%) Percentage of courts Proceeding types
21
included them in their efficiency scores. Still, the number of cases finished in these proceedings when compared to others was low, and therefore the average weight they received was also low, as illustrated in Figure 3.
Amongst the proceedings that most contributed to the efficiency scores of courts during 2007 to 2011 are the “common enforcement proceeding” (O3), the “common civil declaratory actions” (O1) and the “common enforcement (< 15-Sep-2003)” (O4). On the opposite side, we have several types of proceedings which were selected by a very small number of courts and whose contribution to the efficiency scores of the courts assessed is only residual. This indicates that the productivity of the judges and support staff in resolving these types of proceedings is very low or that no lawsuits related with these proceedings were filed in these courts and, therefore, the courts ignore them in their efficiency scores. These proceedings include, for instance, “enforcement of foreign sentence” (O28), “European procedure of injunction” (O12) and “embargos” (O41).
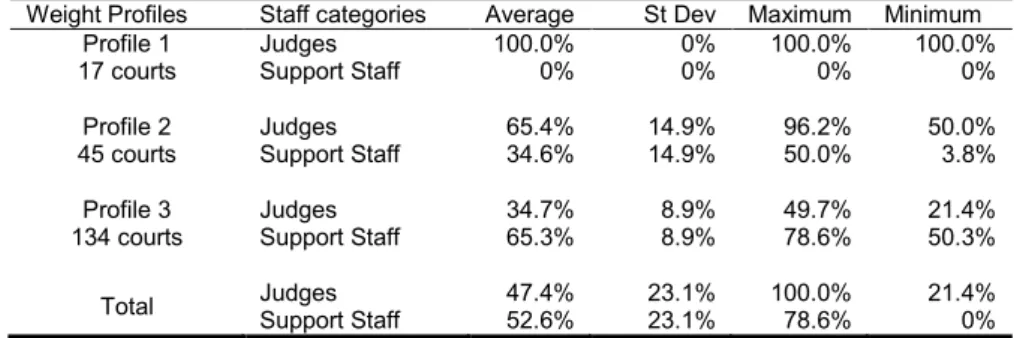
In the same way that different weight profiles were identified regarding dispute resolution, different weight profiles can also be identified regarding the composition of the workforce in the compared courts. In particular we can group the courts into 3 major input weight profiles as shown in Table 5, which uses data from 2011. The first profile includes 17 courts which have given all the virtual weight to the input variable judges, indicating that their levels of dispute resolution per judge when compared to the other courts are higher than the levels of dispute resolution per support staff. Then, we have a second profile, where the 45 courts that belong to it share the virtual weight between the two categories of staff but give a higher weight to the judges (i.e. 65.4% on average, against 34.6% of the weight given to the variable support staff). Finally, we have a third profile, which is the most common, where the weight is also shared between the judges and the support staff, but where the weight attributed to the latter (65.3%) is higher than the weight given to the former (34.7%).
Table 5 – Virtual weights attributed by the courts to the different categories of staff – Year 2011 Weight Profiles Staff categories Average St Dev Maximum Minimum
Profile 1 17 courts Judges Support Staff 100.0% 0% 0% 0% 100.0% 0% 100.0% 0% Profile 2 45 courts Judges Support Staff 65.4% 34.6% 14.9% 14.9% 96.2% 50.0% 50.0% 3.8% Profile 3 134 courts Judges Support Staff 34.7% 65.3% 8.9% 8.9% 49.7% 78.6% 21.4% 50.3% Total Judges Support Staff 47.4% 52.6% 23.1% 23.1% 100.0% 78.6% 21.4% 0%
A careful analysis of the DEA results for the period 2007 to 2011 suggests that the third profile represents the most efficient composition of the workforce as we obtained a statistically significant correlation between the efficiency scores of the courts and the composition of their staff, measured by the percentage of judges in the total workforce of each court. In particular, we used the Spearman’s rank correlation coefficient, having obtained a correlation of -0.268 (significant at the 0.01 level).