UNIVERSITY OF BEIRA INTERIOR
Aerospace Science
Numerical Study of the Spray Impingement onto a
Solid Wall
Christian Michel Gomes Rodrigues
Dissertation for the Degree of Master of Science in
Aeronautical Engineering
(2nd Cycle of Studies)
Supervisor: Dr. André Resende Rodrigues da Silva Co-Supervisor: Dr. Jorge Manuel Martins Barata
ii
This page has been intentionally left blank for
double-sided copying.
iii
Acknowledgments
I would like to take this opportunity to express my appreciation to my supervisor, Professor André Resende Rodrigues da Silva, for its support and encouragement during the course of my study at the University of Beira Interior and for giving me the opportunity to belong and collaborated in the activities of AeroG – Aeronautics and Astronautics Research Center. My thanks go also to my Scientific Coordinator, Professor Jorge Manuel Martins Barata, for providing research grants in this Department and for its guidance during the fellowship.
I want also to express my acknowledgments to the Foundation for Science and Technology for their financial assistance under the project PDTC/EME-MFE/102190/2008 in the form of a research grant with the reference ―BI/AeroG/01/2010‖.
iv
This page has been intentionally left blank for
double-sided copying.
v
Abstract
The modelling of turbulent multiphase flows has been gathering high interest in the last decades in the scientific community due to its relevance in several applications, such as in industrial and environmental processes or for chemical and biomedical purposes. In fact, regarding the industrial applications, the impingement of liquid fuel sprays onto engine surfaces has become a subject of interest due to its influence on the mixture preparation prior to combustion and, consequently, engine performance and pollutants emission (Barata and Silva, 2005). However, there is still a lack of knowledge concerning the spray-wall interaction but also concerning the exact phenomenon occurring during the process. These gaps do not allow defining the most favourable conditions for the optimal engine performance. Hence, the main challenge for the investigators lies in attaining a much deeper understanding of the phenomena involved in the spray impingement process, through either theoretical analysis or experimental investigation.
Meanwhile, the splash phenomenon has been the focus of many researchers due to its relevance in the combustion process of small-bore, direct-injected gasoline and diesel engines, as well as in a variety of other industrial devices in which sprays impinge on solid surfaces. Bai and Gosman (1995) developed a model to predict the outcomes of spray droplets impacting on a wall with temperatures below the fuel boiling point. This model, which has been formulated using a combination of simple theoretical analysis and experimental data from a wide variety of sources, was later improved (Bai et al., 2002) by refining the dissipation energy term and by enhancing the post-splashing characteristics. In fact, recently, significant attention has been given to this regime either through the definition of transition criteria that better fit specific conditions of the experimental configuration under study or by characterizing the behaviour of the drop during all stages of the regime (expansion of the lamella, crown formation and propagation, etc.) through both theoretical analyses and experimental data. Beyond the transition criteria, another aspect that controls the characteristics of the secondary droplets after the impacts is the energy dissipation term and thus, it is essential its proper definition for adequately modelling these multi-phase flows. However, contrary to spreading, there is little literature available related to this particular parameter and, more important than that is the fact that there is a certain ambiguity even for what it represents exactly. In addition, the majority of the dissipative energy loss relationships have been deduced for the spread regime, i.e., from the beginning of the expansion of the lamella until the drops reaches its maximum extent (without splashing). This situation can be overcome through some simplifying assumptions, which obviously carries inaccuracy.
The present work is dedicated to the study of the sprays impingement onto a solid wall through a crossflow. The major purpose of the thesis is to improve the accuracy of the base model, which is the model of Bai et al. (2002), through the employment of both new
vi
correlations for the deposition/splash transition criteria and energy dissipation loss relationships available in the literature. The numerical predictions are then compared with the experimental data of Arcoumanis et al. (1997) for two crossflow rates ( and ).
From the results, it can be concluded that the employment of different transition criteria can bring better results (see also Silva et al., 2011). On the other hand, no improvements were seen by the employment of the new energy dissipative loss relationships in the base models, which calls for further research in this particular matter.
Keywords
Spray, Wall Impingement, Droplet Impact, Splash, Transition criteria, Energy Dissipation
vii
Resumo
A modelação de escoamentos turbulentos multifásicos tem vindo a gerar grande interesse nas últimas décadas na comunidade científica devido à sua importância em diversas aplicações, como por exemplo em sistemas industriais e ambientais, ou em processos químicos e biomédicos. De facto, no que diz respeito às aplicações industriais, o impacto do spray de combustível nas superfícies dos motores tornou-se um assunto de elevado interesse devido à sua influência na preparação da mistura antes da combustão e, consequentemente, no desempenho do motor e emissão de poluentes (Barata e Silva, 2005). Contudo, continua a ser necessária bastante investigação no que toca à interacção spray-parede mas também relativamente aos fenómenos específicos que ocorrem durante todo o processo. Estas lacunas não permitem ainda definir quais as condições óptimas no cilindro para o melhor desempenho do motor. Assim, o principal desafio para os investigadores prende-se com o estudo aprofundado dos fenómenos envolvidos no processo de impacto de sprays tanto através de análises teóricas como de investigações experimentais.
Entretanto, o fenómeno de splash tem vindo a ser objecto de estudo de muitos investigadores devido à sua relevância no processo de combustão em motores de injecção directa a gasolina e gasóleo, mas também numa grande variedade de outros dispositivos industriais nos quais ocorre impacto de sprays em superfícies sólidas. Bai and Gosman (1995) desenvolveu um modelo para prever os resultados do impacto de gotas de sprays em paredes com temperatura abaixo do ponto de ebulição do combustível. Este modelo – formulado usando uma combinação de análises teóricas e dados experimentais de uma grande variedade de fontes – foi mais tarde melhorado (Bai et al., 2002) refinando o termo da energia de dissipação e melhorando as características de pós-impacto. De facto, recentemente tem sido dada uma grande atenção a este regime quer através da definição de critérios de transição que melhor se adequam às condições da configuração experimental em estudo, quer através da caracterização do comportamento das gotas durante todos os estágios do regime (expansão da ―lamela‖, formação da coroa e sua propagação, etc.) através de análises teóricas e de dados experimentais. Para além dos critérios de transição, outro dos aspectos que controlam as características das gotas secundárias após impacto é a energia de dissipação viscosa, sendo assim essencial a sua correcta definição para a modelação destes escoamentos. Contudo, ao contrário do spreading, existe pouco literatura disponível relacionada com este parâmetro em específico e, mais importante ainda, existe alguma ambiguidade sobre aquilo que este parâmetro representa exactamente. Além disso, a maioria das relações da energia de dissipação foram deduzidas para o regime de spread, i.e., desde o início da expansão da lamela até que a gota atinja a sua extensão máxima, ou seja, sem ocorrer splash. Esta situação pode ser superada através de algumas hipóteses assumidas mas que, obviamente acarretam erros.
viii
O presente trabalho é dedicado ao estudo de impacto de sprays em paredes sólidas com a presença de um escoamento cruzado. O principal objectivo da tese é melhorar a qualidade do modelo de atomização de base utilizado (modelo do Bai et al., 2002) através da utilização de novas correlações – para os critérios de transição entre deposition e splash –, e novas relações – para a energia de dissipação – disponíveis na literatura. Os resultados numéricos são então comparados com os dados experimentais do estudo do Arcoumanis et al. (1997) para escoamentos cruzado com duas velocidades diferentes (5 e 15 m/s).
Dos resultados apresentados, conclui-se que a utilização de diferentes critérios de transição pode trazer melhores resultados mas apenas em alguns parâmetros estudados (ver também Silva et al., 2011). Por outro lado, não foram encontradas melhorias quando se introduziram no modelo de base as novas equações para a energia de dissipação, deixando claro a necessidade premente de maior investigação nesta área em particular.
Palavras-chave
Spray, Impacto de parede, Impacto de gotas, Splash, Critérios de transição, Dissipação de energia
ix
Resumo Alargado
A modelação de escoamentos turbulentos multifásicos tem vindo a gerar grande interesse nas últimas décadas na comunidade científica devido à sua importância em diversas aplicações, como por exemplo industriais e ambientais, ou em processos químicos e biomédicos. De facto, no que diz respeito às aplicações industriais, o impacto do spray de combustível nas superfícies dos motores tornou-se um assunto de elevado interesse devido à sua influência na preparação da mistura antes da combustão e, consequentemente, no desempenho do motor e emissão de poluentes (Barata e Silva, 2005). Contudo, continua a ser necessária bastante investigação no que toca à interacção spray-parede mas também relativamente aos fenómenos específicos que ocorrem durante todo o processo. Estas lacunas não permitem ainda definir quais as condições óptimas no cilindro para o melhor desempenho do motor. Assim, o principal desafio para os investigadores prende-se com o estudo aprofundado dos fenómenos envolvidos no processo de impacto de sprays tanto através de análises teóricas como de investigações experimentais.
Entretanto, o fenómeno de splash tem vindo a ser objecto de estudo de muitos investigadores devido à sua relevância no processo de combustão em motores de injecção directa a gasolina e gasóleo, mas também numa grande variedade de outros dispositivos industriais nos quais ocorre impacto de sprays em superfícies sólidas. Bai and Gosman (1995) desenvolveu um modelo para prever os resultados do impacto de gotas de sprays em paredes com temperatura abaixo do ponto de ebulição do combustível. Este modelo – formulado usando uma combinação de análises teóricas e dados experimentais de uma grande variedade de fontes – foi mais tarde melhorado (Bai et al., 2002) refinando o termo da energia de dissipação e melhorando as características de pós-splash. De facto, recentemente tem sido dada uma grande atenção a este regime quer através da definição de critérios de transição que melhor se adequam às condições da configuração experimental em estudo, quer através da caracterização do comportamento das gotas durante todos os estágios do regime (expansão da ―lamela‖, formação da coroa e sua propagação, etc.) através de análises teóricas e investigações experimentais.
Para além dos critérios de transição, outro dos aspectos que controlam as características das gotas secundárias após impacto é a energia de dissipação viscosa, sendo assim essencial a sua correcta definição para a modelação destes escoamentos. Contudo, ao contrário do spreading, existe pouco literatura disponível relacionada com este parâmetro em específico, mas, mais importante ainda, existe alguma ambiguidade sobre aquilo que este parâmetro representa exactamente. Além disso, a maioria das relações da energia de dissipação foram deduzidas para o regime de spread, i.e., desde o início da expansão da lamela até que a gota atinja a sua extensão máxima, ou seja, sem ocorrer splash. Esta situação pode ser superada através de algumas hipóteses assumidas mas que, obviamente acarretam erros.
x
O presente trabalho é dedicado ao estudo de impacto de sprays em paredes sólidas com a presença de um escoamento cruzado. O principal objectivo da tese é melhorar a qualidade do modelo de base (modelo do Bai et al., 2002) através da utilização de novas correlações – para os critérios de transição entre deposition e splash –, e novas relações – para a energia de dissipação – disponíveis na literatura.
O modelo de Bai et al. (2002) considera quatro regimes de impacto: stick, rebound,
spread e splash. A existência de cada um destes regimes depende das características das
gotas incidentes e das condições da superfície sólida, incluindo se esta se encontra seca ou molhada (Bai and Gosman, 1995). Para ambos os casos, o critério de transição que define a separação entre os regimes de spread e splash foi derivada do dados de Stow e Hadfield (1981), resultando num número de Weber crítico dependente do número de Laplace. Os limites entre os regimes de stick e rebound, e rebound e spread – que foram derivados dos dados de Lee e Hanratty (1988) – para paredes molhadas foram estabelecidos com números de Weber de 2 e 20, respectivamente. Além disso, Bai and Gosman (1995), na primeira versão do modelo, deduziram as suas próprias equações para a energia de dissipação (função do número de Weber crítico) e, posteriormente refinadas no modelo seguinte (Bai et al, 2002).
Este modelo foi incorporado num método computacional 3D baseado nas soluções das equações de Reynolds-averaged Navier-Stokes para a fase do gás, e um modelo SSF (stochastic separated flow) baseado no Eddy lifetime para a fase dispersa. O modelo resolve as equações de energia para cada gota secundária – podendo esta resultar em (até) seis parcelas – e os tamanhos das gotas secundárias resultantes do splash seguem uma distribuição característica. O modelo produziu resultados satisfatórios para o caso particular testado pelos autores, mas não obtiveram evidências claras da aplicabilidade do modelo a outras condições. Assim, numa primeira fase deste trabalho, para além do critério de transição original do modelo de atomização usado (Bai et al., 2002), foram testadas no modelo global as correlações estabelecidas por Mundo et al. (1995), Cossali et al. (1997), Senda et al. (1999) e, Huang e Zhang (2008). Na segunda fase do trabalho, testaram-se várias equações para a energia de dissipação encontradas na literatura e deduzidas pelos seguintes autores: Chandra
et al. (1991) e Pasandideh-Fard et al. (1996), para além da equação original do modelo. Os
termos não-identificados da equação deduzida por Chandra et al. (1991) foram quer deduzidos de outras hipóteses assumidas, quer obtidos de dados de outras fontes. Os termos da energia de dissipação foram inseridos no modelo de base original. Numa segunda instância, trocou-se o critério de transição do modelo original (Bai et al., 2002) pelo do Cossali et al. (1997) que tinha apresentado bons resultados no estudo anterior para um caso específico. Todos os resultados numéricos são comparados com os dados experimentais do estudo do Arcoumanis et al. (1997) para escoamentos cruzado com duas velocidades diferentes ( e ). São apresentados gráficos referentes à distribuição da frequência dos diâmetros das gotas mas também gráficos apresentando a velocidade normal de cada classe de gotas em função do diâmetro das gotas. Todos os resultados são apresentados em quatro posições diferentes ao longo da extensão do domínio da solução tanto para gotas com movimento
xi ascendente como descendente. Além disso, todas as simulações foram efectuadas para um escoamento cruzado de e .
Dos resultados apresentados, conclui-se que a utilização de diferentes critérios de transição pode trazer melhores resultados (ver também Silva et al., 2011). A utilização de critérios de transição do Cossali et al. (1997) apresentou significativas melhorias nos resultados das distribuições dos diâmetros das gotas com movimento ascendente para ambas as velocidades de escoamento cruzado utilizado. Contudo, o mesmo critério apresentou resultados menos coerentes nos gráficos das velocidades das gotas com sentido ascendente. Por outro lado, não foram encontradas melhorias quando se introduziram no modelo de base as novas equações para a energia de dissipação, o que alerta para a necessidade de mais estudos sobre este parâmetro em particular.
xii
This page has been intentionally left blank for
double-sided copying.
xiii
Index
ACKNOWLEDGMENTS ... III ABSTRACT... V RESUMO ... VII RESUMO ALARGADO ... IX INDEX ... XIII FIGURE INDEX ... XVII TABLE INDEX... XXI NOMENCLATURE ... XXIII I. INTRODUCTION ... 1 1. BACKGROUND ... 1 2. LITERATURE REVIEW ... 3 2.1. Wall Impingement... 3 2.1.1. Impingement Regimes ... 62.1.2. Effect of Heat Transfer ... 7
2.1.3. Incident angles ... 12
2.1.4. Wall Roughness ... 12
2.1.5. Liquid Film ... 13
2.1.6. Multi Droplet Interactions ... 16
2.1.7. Droplet-Wall Impingements Models ... 17
i. Transition Criteria ... 18
ii. Post-Impingement Characteristics... 22
3. OBJECTIVES ... 22
4. OVERVIEW ... 22
II. MATHEMATICAL MODEL ... 23
1. INTRODUCTION ... 23
2. CONTINUOUS PHASE ... 23
2.1. Introduction ... 23
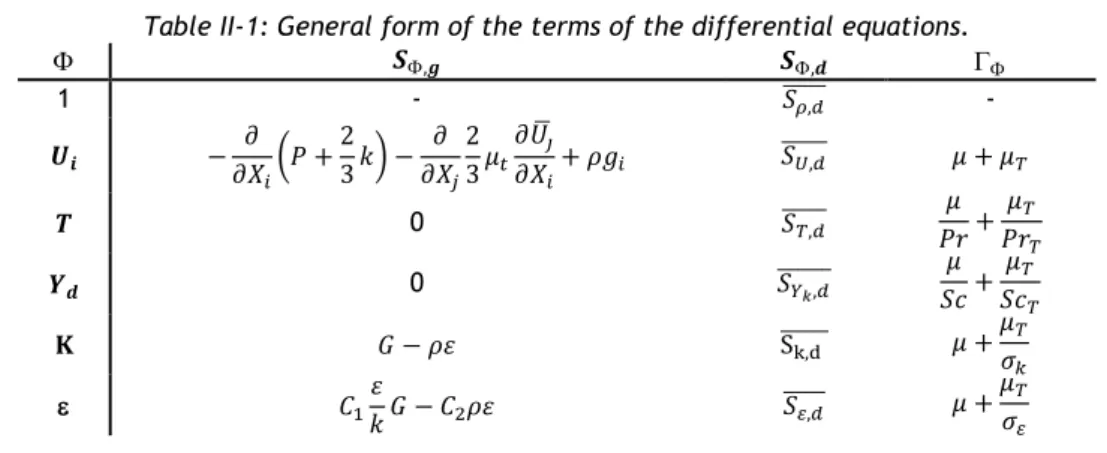
2.2. Governing differential equations ... 23
2.3. Finite-difference equations ... 26
2.4. Numerical Method ... 26
2.5. Solution Procedure ... 28
xiv
3.1. Introduction ... 28
3.2. Particle Tracking – Lagrangian Particle Dispersion Model ... 29
4. INTERACTION BETWEEN CONTINUOUS AND DISPERSED PHASE ... 32
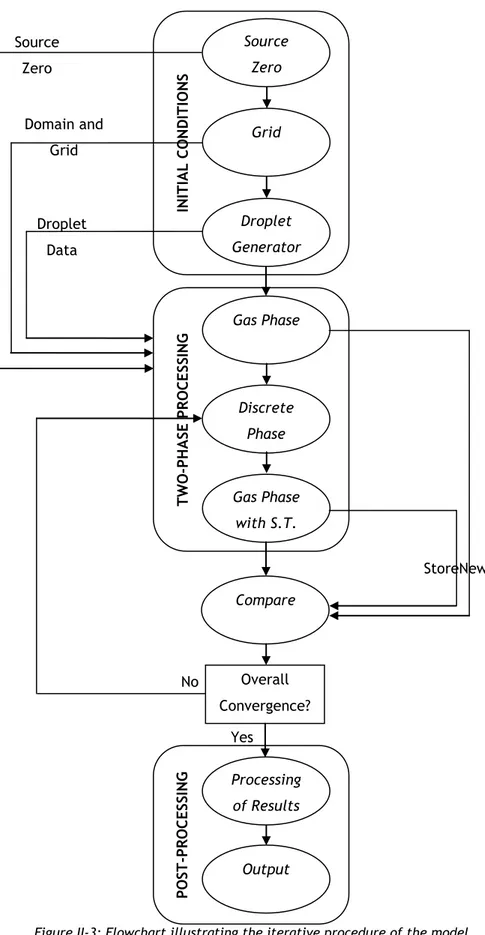
5. IMPLEMENTATION AND PROCEDURE OF THE MODEL ... 33
6. BOUNDARY CONDITIONS ... 35 6.1. Continuous Phase ... 35 6.2. Dispersed Phase ... 35 6.2.1. Atomization Conditions ... 36 6.2.2. Impingement Regimes ... 36 i. Deposition ... 37 ii. Rebound ... 37 iii. Splash ... 37 Mass ratio ... 37
Secondary Droplets Sizes ... 38
Number of Secondary Droplets: ... 38
Velocity of Secondary Droplets ... 39
6.2.3. Regime Transition Criteria ... 42
III. RESULTS ... 45
1. INTRODUCTION ... 45
2. MESH INDEPENDENCE ... 45
3. TRANSITION CRITERIA ... 47
4. ENERGY DISSIPATION LOSS ... 56
4.1. Transition Criterion of Bai et al. (2002) ... 58
4.2. Transition Criterion of Cossali et al. (1997) ... 64
4.3. Comparison and Discussion ... 70
IV. CONCLUSIONS... 73
V. REFERENCES ... 75
VI. ANNEXES ... 85
1. ANNEX 1 ... 86
2. ANNEX 2 ... 89
2.1. Nabber and Reizt (1988) ... 89
2.2. Watkins and Wang (1990) ... 89
2.3. Nagaoka et al. (1994) ... 90
2.4. Senda et al. (1994) ... 90
2.5. Bai and Gosman (1995) ... 92
2.6. Gavaises et al. (1996) ... 93
xv
2.8. Park and Watkins (1996) ... 96
2.9. Mundo et al. (1997, 1998) ... 98
2.10. Xu et al. (1998) ... 99
2.11. Senda et al. (1999) ... 100
2.12. Lee and Ryou (2000) ... 104
2.13. Grover and Assanis (2001) ... 104
2.14. Bai et al. (2002) ... 106
2.15. Lemini and Watkins (2002) ... 108
References ... 110
xvi
This page has been intentionally left blank for
double-sided copying.
xvii
Figure Index
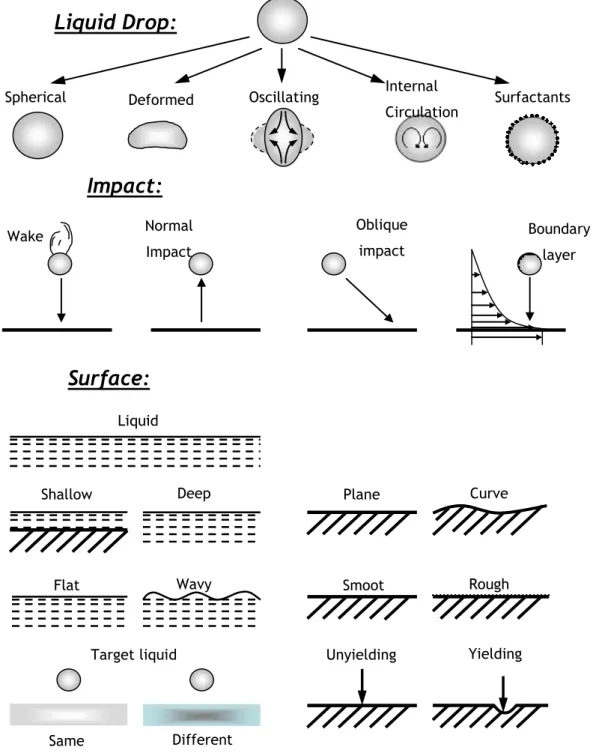
Figure I-1: Survey of parameters governing the impact of a liquid drop (Rein, 1993)... 4
Figure I-2: Morphology of drop impact. (Rioboo et al., 2001) ... 6
Figure I-3: Possible outcome of single droplets impacting onto non-heated dry surfaces. The classification is in accordance with the characteristic time scale, as in Rioboo et al. (2001). (Moreira et al., 2010) ... 7
Figure I-4: Boiling and lifetime curves of a droplet gently deposited on a heated surface. (Moreira et al., 2010) ... 9
Figure I-5: Overview of droplet global representations of the impact regimes and transition conditions for a dry heated wall. a) Bai and Gosman, 1995; b) Rein, 2002; c) Lee and Ryu, 2006. ... 10
Figure I-6: Model of break-up form (Senda et al., 1999)... 11
Figure I-7: Morphological comparison between splashes created by: (a) an isolated single drop, and (b) by a drop in a spray, time interval between frames is 62.5 µs. (Kalantari and Tropea, 2007) ... 16
Figure I-8: Scale parameters involved in multiple drop impact (Moreira et al., 2010). ... 17
Figure II-1: Nodal configuration for the west face of a control volume (Barata, 1989). ... 27
Figure II-2: Nodal configuration for a control volume (Barata, 1989). ... 27
Figure II-3: Flowchart illustrating the iterative procedure of the model. ... 34
Figure II-4: Domain of solution. ... 35
Figure II-5: Diagram illustrating the free spray experiment and the plane of measurements. ... 36
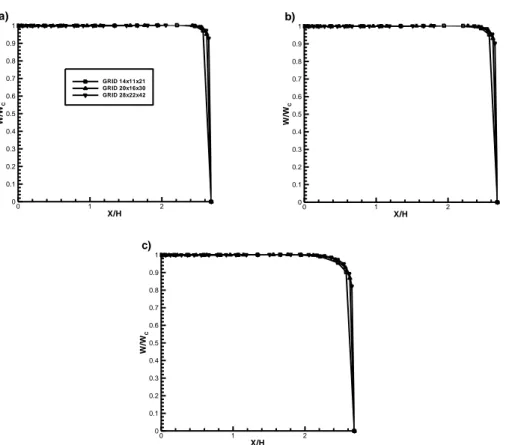
Figure II-6: Diagram illustrating droplet impingement on to a wall (Bai et al., 2002). 40 Figure III-1: Dimensionless horizontal profile, at Y/H = 0.5, of the horizontal velocity component, W, at a) Z/H = 1.3, b) Z/H = 2.3 and c) Z/H = 8.3. ... 46
Figure III-2: Dimensionless vertical profile, at X/H = 0.05, of the horizontal velocity component, W, at a) Z/H = 1.3, b) Z/H = 2.3 and c) Z/H = 8.3. ... 46
Figure III-3: Dimensionless vertical profile of the horizontal velocity component, W, at the position and . ... 47
Figure III-4: Illustration of the four locations where the results have been taken. .... 48
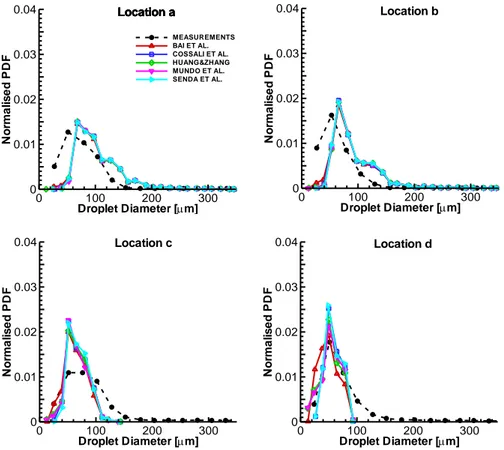
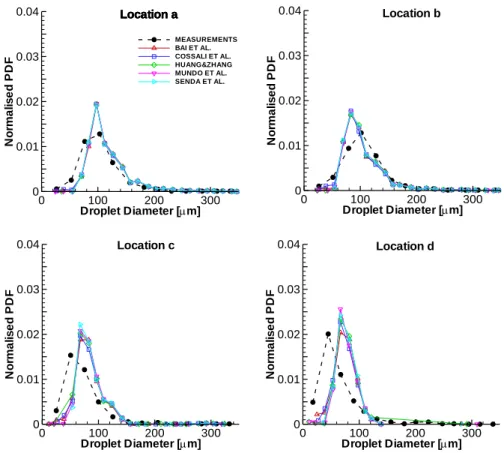
Figure III-5: Size distributions of downward-moving droplets at four locations for a cross flow velocity of 5 m/s. ... 49
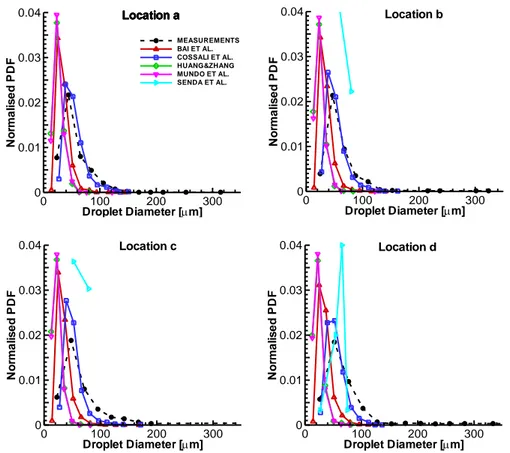
Figure III-6: Size distributions of upward-moving droplets at four locations for a cross flow velocity of 5 m/s. ... 50
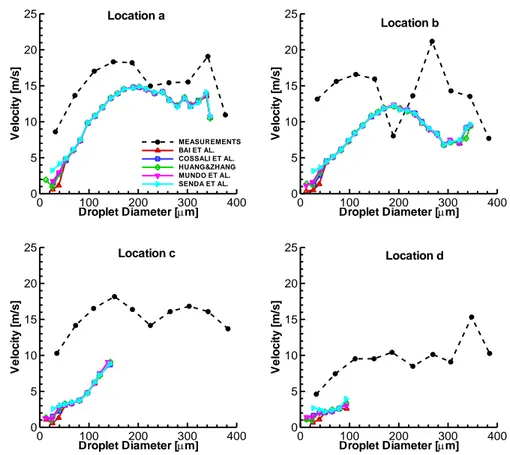
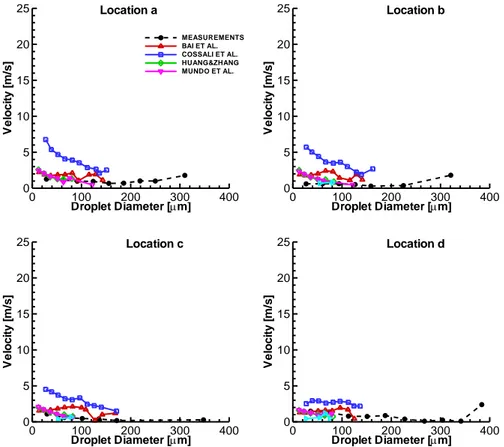
Figure III-7: Velocity-size correlation of downward-moving droplets at four locations for a cross flow velocity of 5 m/s. ... 51
xviii
Figure III-8: Velocity-size correlation of upward-moving droplets at four locations for a cross flow velocity of 5 m/s. ... 52 Figure III-9: Size distributions of downward-moving droplets at four locations for a cross flow velocity of 15 m/s. ... 53
Figure III-10: Size distributions of upward-moving droplets at four locations for a cross flow velocity of 15 m/s. ... 54
Figure III-11: Velocity-size correlation of downward-moving droplets at four locations for a cross flow velocity of 15 m/s. ... 54 Figure III-12: Velocity-size correlation of upward-moving droplets at four locations for a cross flow velocity of 15 m/s. ... 55 Figure III-13: Tracking of a number of drops during their trajectory through the simulation. ... 56
Figure III-14: Size distribution correlation of downward-moving droplets at four locations for a crossflow velocity of 5 m/s and transition criteria of Bai et al. (2002). ... 59
Figure III-15: Size distribution correlation of upward-moving droplets at four locations for a crossflow velocity of 5 m/s and transition criteria of Bai et al. (2002). ... 60 Figure III-16: Velocity-size correlation of downward-moving droplets at four locations for a crossflow velocity of 5 m/s and transition criteria of Bai et al. (2002). ... 61 Figure III-17: Velocity-size correlation of upward-moving droplets at four locations for a crossflow velocity of 5 m/s and transition criteria of Bai et al. (2002). ... 61
Figure III-18: Size distribution correlation of downward-moving droplets at four locations for a crossflow velocity of 15 m/s and transition criteria of Bai et al. (2002). ... 62
Figure III-19: Size distribution correlation of upward-moving droplets at four locations for a crossflow velocity of 15 m/s and transition criteria of Bai et al. (2002). ... 63 Figure III-20: Velocity-size correlation of downward-moving droplets at four locations for a crossflow velocity of 15 m/s and transition criteria of Bai et al. (2002). ... 63 Figure III-21: Velocity-size correlation of upward-moving droplets at four locations for a crossflow velocity of 15 m/s and transition criteria of Bai et al. (2002). ... 64
Figure III-22: Size distribution correlation of downward-moving droplets at four locations for a crossflow velocity of 5 m/s and transition criteria of Cossali et al. (1997). ... 65
Figure III-23: Size distribution correlation of upward-moving droplets at four locations for a crossflow velocity of 5 m/s and transition criteria of Cossali et al. (1997). ... 65 Figure III-24: Velocity-size correlation of downward-moving droplets at four locations for a crossflow velocity of 5 m/s and transition criteria of Cossali et al. (1997). ... 66
Figure III-25: Velocity-size correlation of upward-moving droplets at four locations for a crossflow velocity of 5 m/s and transition criteria of Cossali et al. (1997). ... 67
Figure III-26: Size distribution correlation of downward-moving droplets at four locations for a crossflow velocity of 15 m/s and transition criteria of Cossali et al. (1997). .. 68
Figure III-27: Size distribution correlation of upward-moving droplets at four locations for a crossflow velocity of 15 m/s and transition criteria of Cossali et al. (1997). ... 68
xix Figure III-28: Velocity-size correlation of downward-moving droplets at four locations for a crossflow velocity of 15 m/s and transition criteria of Cossali et al. (1997). ... 69 Figure III-29: Velocity-size correlation of upward-moving droplets at four locations for a crossflow velocity of 15 m/s and transition criteria of Cossali et al. (1997). ... 70
Figure VI-1: The major physical phenomena governing film flow (Stanton and Rutland, 1996). ... 96
Figure VI-2: The process of droplet-wall impingement is analogous to the motion of a spring-mass system impinging on the wall (Xu et al., 1998). ... 100 Figure VI-3: Phenomenological model for fuel film movement (Senda et al., 1999). 103 Figure VI-4: Overview splash model: (a) before impact one droplet approaches the surface, (b) during impact the incoming droplet is transformed into 1 wall film droplet and 3 splashed droplet, (c) after impact 1 wall film droplet sticks to the surface and 3 splashed droplets rebound into the gas phase. ... 106
xx
This page has been intentionally left blank for
double-sided copying.
xxi
Table Index
Table I-1: Main dimensionless groups governing drop impact. ... 5
Table II-1: General form of the terms of the differential equations. ... 25
Table II-2: Turbulence model constants. ... 26
Table II-3: Dispersed phase source terms (Sommerfeld, 1998). ... 32
Table II-4: Dispersed phase source terms (Chen and Pereira, 1992). ... 33
Table II-5: Impingement Regimes and Transition Criteria. ... 44
Table III-1: Splash Transition Criteria studied in this work. ... 48
Table III-2: Dissipative energy loss relationship and corresponding observations. ... 57
Table III-3: The four relationships tested in this study. ... 58
Table VI-1: Regime transition conditions for the impingement models. ... 86
Table VI-2: The post impingement model proposed by Nabber and Reitz (1988). ... 89
Table VI-3: The post impingement model proposed by Wang and Watkins (1990). .... 90
Table VI-4: The post impingement model proposed by Senda et al. (1994). ... 91
Table VI-5: The post impingement model proposed by Bai and Gosman (1995). ... 92
Table VI-6: The post impingement model proposed by Gavaises et al. (1996). ... 93
Table VI-7: The post impingement model proposed by Stanton and Rutland (1996). . 95
Table VI-8: The post impingement model proposed by Park and Watkins (1996). ... 97
Table VI-9: The post impingement model proposed by Mundo et al. (1997, 1998). ... 99
Table VI-10: The post impingement model proposed by Lee and Ryou (2000). ... 104
Table VI-11: The post impingement model proposed by Grover and Assanis (2001). . 105
Table VI-12: The post impingement model proposed by Bai et al. (2002). ... 107
Table VI-13: Characteristics and conditions under which the transitions criteria between the regimes ―deposition‖ and ―splash‖ used in this study have been proposed. .... 114
xxii
This page has been intentionally left blank for
double-sided copying.
xxiii
Nomenclature
Ck , C3 Empirical constant
C, C1, C2 Dimensionless model constant
cf Friction coefficient
cp Specific heat
CT The turbulence coefficient
CD Drag coefficient
d General diameter of a droplet
̅ Scale parameter; mean diameter
dmax Maximum spread of the droplet upon impact
d32 Sauter mean diameter
dsp Diameter of film disc
dt The time step
dv Volumetric mean diameter
e Restitution coefficient
EK Droplet kinetic energy
E Droplet surface energy
ED Dissipated energy
F Force
f Frequency
G Turbulence energy production term
g Gravitational acceleration
gi External forces
h Thickness of the film disc
K Splashing/deposition dimensionless parameter k Correction factor; turbulent kinetic energy
K1 Modified Bessel function of third kind and first order.
le Eddy length scale
m Mass
NS Total number of secondary droplets
N Number of droplets
NIB Number of impacts causing break-up
xxiv
q Scale parameter
p Number of secondary parcels; random number [0;1]; pressure
Qi Source terms
Ruv Correlation coefficient
r32 Sauter mean radius (SMR)
Ra Surface roughness
r General droplet radius
SU, SH, Sm Sk, S Inter-phase source terms S, g Source term of the gas
S, d Source term of the droplet.
Si Source term due to interphase transport
Sm Source term due to transfer caused by evaporation
TB Liquid boiling point temperature
TLeid Leidenfrost temperature
TN Nukiyama temperature
TPA Pure adhesion temperature
TPR Pure rebound temperature
Ts Surface temperature
TW Wall temperature
t Time
tc Time scale; eddy transit time
V Velocity; volume
vdrift Relative velocity between the particle and the fluid
Greek symbols
The form of the density function; random number [0;1]
The shape of the density function
t Time steps
Turbulent kinetic energy dissipation rate
Wall film thickness; scale parameter
bl Boundary layer thickness
Density
βmax Maximum diameter ratio of film disc
Surface tension; variance of a Gaussian distribution
xxv
Turbulent Prandtl numbers for dissipation
air Shearing force between the film and the gas by unit surface area
p Droplet relaxation time
FL Eddy lifetime
w The shearing stress
Viscosity; location parameter
Dynamic viscosity
T Turbulent kinematic viscosity
Effective diffusion coefficient
Dependent variable
p Scalar value
Dissipation function
az Azimuthal angle
a Advancing contact angle
I Incident angle
S Reflection angle; ejection angle of secondary droplets
Break-up probability Subscripts a After impact b Before impact c Critical value d Droplet f Liquid film
I Incoming droplet or incident droplets
N Normal components
p Refer to the particle
S Splash or secondary droplets; refer to surface conditions
R Rebound T Tangential components Superscripts Fluctuation (rms) velocity
̇
Evaporation rate⃗
Velocity vectorxxvi
Non-dimensional numbers
La Droplet Laplace number d 2
d
ILa
Oh Droplet Ohnesorge number
I d
d
Re
We
Oh
Re Droplet Reynolds number
dd
Iu
relRe
rm Mass ratio I S mm
m
r
We Droplet Weber number
dV
INd
IWe
2
RND Dimensionless roughness I a NDd
R
R
non Non-dimensional wall film thickness
I non
d
1
I. Introduction
1.
Background
The modelling of multiphase flows has been gathering high interest in the last decades due to its relevance in several applications, such as in industrial processes (e.g. spray drying, transport systems, and manufacturing and material processing), energy conversion and propulsion (e.g. pulverized-coal-fired furnaces and solid propellant rocket) and fire suppression (e.g. Sprinkler system). Multiphase flows can be subdivided into four categories: gas-liquid, gas-solid, liquid-solid and three-phase flows (Crowe et al., 1998). The spray impingement onto solid walls is a very specific example of gas-liquid flows, which can be found in each one of the application specified above. Fuel injection systems in internal combustion (IC) engines, gas turbines, ink jet printing, cooling systems, spray painting and coating are some examples of this particular multiphase flow.
The impact of fuel droplets onto a solid wall became a subject of great importance in the scientific community because it is a frequent event in injection systems (both in direct and indirect), which affects the mixture preparation before the combustion and, consequently, the engine performance and pollutant emissions (Cartellieri and Wachter, 1987). In small bore direct injection (DI) engines, the effects of droplet/wall interactions can be quite evident due to the reduced distance between the injector and the piston and the higher rates of injection, which results in increased emissions of gases such as nitric oxides and unburned hydrocarbons (Matsui and Sughiara, 1988).
However, there is still a lack of knowledge concerning the spray-wall interaction but also regarding the exact phenomenon occurring during the process, which does not allow clarifying the most favorable conditions for the optimal engine performance. Hence, the main challenge for the investigators lies in attaining a much deeper understanding of the phenomena involved in the spray impingement process, through either theoretical analysis or experimental investigations.
Despite spray impact phenomena are difficult to analyze in operating engines – because of the problems of access –, useful information can be obtained, for example, through photographic techniques in specially adapted engines (e.g. Winterbone et al., 1994). The details of the information that can be obtained from this approach are very limited, and it is difficult to alter the test conditions. For these reasons, most of the recent experimental investigations of impacting sprays have been conducted in specially constructed test rigs or bombs (e.g. Arcoumanis et al., 1997; Kalantari and Tropea, 2010). Under these circumstances, many experimental investigations have already been carried out to study the complex interactions between individual design parameters and working conditions: Katsura
et al., (1989), and Chandra and Avedisian (1991) studied the region of impingement of single
2
the influence of different angles of impact in the size range of the droplets; Andreassi et al. (2007) studied the influence of high injection pressure on the spray impingement phenomenon; and Su and Yao (1999) found that the spray-wall impactions depends on the distance from the nozzle to the impacted surface. In addition, numerous parameters were found to influence the outcomes during the impingement process. The frequency of injection alters the boundary conditions at the spray nozzle and greater injection pressures extend the area of impact (Park and Lee, 2004) and increase the droplet impact velocity. The latter parameter improve the number flux of small size droplets which are prone to interact with the surrounding air and therefore with vaporization and mixing (Meingast et al., 2000). Arcoumanis and Chang (1993) showed that the heat transfer rate increase with the impact velocity and with the frequency of injection and later (Arcoumanis and Cutter, 1995) added crossflow to simulate the swirl movement used in practical engines to enhance the mixture preparation inside the cylinder. Also, the effect of a fluid film on the spray impingement experiment has been studied (Ozdemir and Whitelaw, 1992). It was found that that the impact on the wall generated a new fraction of larger droplets which were spattered out of the liquid film.
In order to clarify the characteristics of the spray/wall interaction and taking part of the detailed information that was difficult to measure by mean of the experimental work, the computational modelling also grew up in the lasts decades. The first attempt to clarify the spray wall interaction process through numerical simulation of spray impingement was performed by Nabber and Reitz (1988), who considered three alternative ways of tracking the droplets after the impact: the stick model, in which impinging droplets are stick on the wall; the rebound model, in which the droplets are reflected elastically; and, finally, jet model which assumes that after impingement the droplets are moving along the wall surface with the same velocity magnitude as before the impact. The authors employed the KIVA code (Amsden et al. 1989) and of the three ways of post-impingement droplet tracking, the Jet model was found to produce the best results.
Later, Senda et al. (1994) developed an impingement model to predict the secondary atomization and liquid film formation resulting from the impact of the incident droplet on the wall but also the heat transfer between the wall film and the heated wall. The model was mainly based on the previous work of Wachters and Westerling (1966) but obtained good results only for the particular initial injection and impingement conditions considered.
In 1993, Yoshikawa et al. (1993) performed a 3-D modelling of the spray-valve interaction and observed extensive drop interaction between the induction port and intake valve. This interaction is an important source of liquid atomization and vaporization. A better understanding of these interactions between the liquid and induction surfaces was thinking to help in designing injection systems and control strategies to improve engine performance and to control emissions. Nagaoka et al. (1994) used a particle film model in 3D calculations of SI engines. However, their model could not predict the transient behaviour of the wall film effectively because of the assumption that the wall film did not move. As an effort to resolve
3 this problem, Lee (1999) proposed the static model for predicting transient behavior of films by modifying the lens model of Nagaoka et al. (1994).
Meanwhile, it turned out that splash was an important physical phenomenon in small-bore, direct-injected gasoline and diesel engines, as well as in a variety of other industrial devices in which sprays impinge on solid surfaces. Bai and Gosman (1995) developed a model to predict the outcomes of spray droplets impacting on a wall with temperatures below the fuel boiling point. This model, which has been formulated using a combination of simple theoretical analysis and experimental data from a wide variety of sources, was later improved (Bai et al., 2002) by refining the energy dissipation loss and by enhancing the post-splashing characteristics. Similarly, Stanton and Rutland (1996) proposed a sub-model involving the splash effect and liquid film model. However, while in the Bai and Gosman model, the ejection angle was randomly chosen in the range from 5 and 50 , in the Stanton and Rutland model, it was uniformly determined from linear interpolation of the experimental data obtained by Mundo et al. (1995).
In fact, recently, significant attention has been given to this regime either through defining transition criteria and post-impingement characteristics that better fit specific experimental configuration with certain conditions or by characterizing the behavior of the drop during all the stages of the regime (expansion of the lamella, crown formation and propagation, etc.) through both theoretical analysis and experimental investigation.
2.
Literature Review
The review of the relevant background and central concepts required for the comprehension of the work is introduced in this chapter and the various phenomena are presented in the following sections.
2.1. Wall Impingement
The characterization of the various phenomena resulting from the impact of droplets onto solid and liquid surfaces is a complex and interdisciplinary task which cover a wide variety of technical applications, such as ink-jet printing, rapid spray cooling of hot surfaces (turbine blades, rolls in rolling mills for steel production, lasers, semiconductor chips, and electronic devices), annealing, quenching of aluminium alloys and steel, fire suppression by sprinklers, internal combustion engines (intake ducts of gasoline engines or piston bowls in direct-injection diesel engines), incinerators, spray painting and coating, plasma spraying, and crop spraying. Understanding the associated physical phenomena is of utmost importance in order to formulate reliable boundary conditions in numerical codes for spray simulation. This explains the large number of studies, reported in the literature, on the dynamics of impinging droplets, within quite dissimilar scientific areas.
Pioneering studies on certain aspects of droplet impact were conducted by Tomlinson (1861; 1864), Worthington (1876; 1877; 1908), Thompson and Newall (1885) in the second half
4
of the nineteenth century. In fact, Worthington (1908) was the first to investigate these impacts systematically and to photograph water droplets as they impinged on a solid surface. Despite the limited technology of that time, the author could distinguish between spread and disintegration, which he related to the different impact velocity. Subsequently, many experimental studies have been carried out with the aim of describing the impact of droplets and determining impact regimes (Rein, 1993; Prosperetti and Oguz, 1993; and Tropea, 1999).
Figure I-1: Survey of parameters governing the impact of a liquid drop (Rein, 1993). Wake
Liquid
Shallow Deep Plane Curve
d
Flat Wavy Smoot
h
Rough
Same Different
Target liquid Unyielding Yielding
Spherical Oscillating Surfactants
Liquid Drop:
Impact:
Surface:
Internal Circulation Boundary layer Normal Impact Oblique impact Deformed5 However, there are numerous parameters that influence the droplet and the collision regime (Figure I-1) which result on different outcomes: a drop may be spherical or elliptic (due to oscillations) at the moment of impact; it may impact on the free surface of a liquid in a deep pool, on a thin liquid film on a wall, or on a dry solid surface; the impact may be normal (perpendicular) or oblique, in air or in vacuum; the liquid may be Newtonian or non-Newtonian (e.g., a viscoelastic polymer or a surfactant solution); the liquids of the drop and pool/film may be miscible or immiscible; the solid surface may be hard or soft, rough or smooth, chemically homogeneous or heterogeneous, it may also be porous, flat or curved, at a temperature different from that of the drop or the same. On liquid surfaces, pre-existing or generated waves may affect the flow pattern. The impact may result in the drop spreading over the solid surface, receding, rebounding, or even levitating if the evaporation near a hot wall is sufficiently strong for the Leidenfrost effect; a crater may form in the liquid bulk in a pool and later on collapse, leading to the formation of the so-called Worthington jet, which flows out from its centre and is subjected to capillary breakup. The impact on a liquid film may result in crown formation, propagation, and breakup, as well as in tiny bubble trapping, or, under certain conditions, non-coalescence and even rolling over the surface. In addition, the outcome of drop impact depends on the impact velocity, its direction relative to the surface, drop size, the properties of the liquid (its density, viscosity, viscoelasticity, and some other non-Newtonian effects for rheological complex fluids), the surface or interfacial tension, the roughness and wettability of the solid surface, the non-isothermal effects (e.g., solidification and evaporation), and air entrapment. In very strong impacts, liquid compressibility is also a factor (Yarin, 2006).
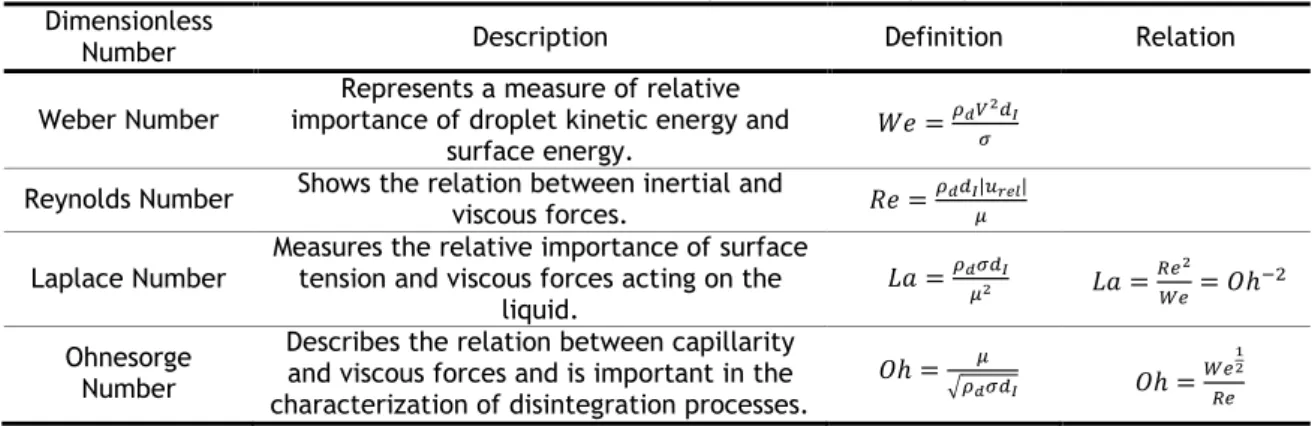
Prediction of the exact mechanism involves accounting for the relative magnitude of the forces involved at the impact of the droplet, which are usually grouped in dimensionless numbers. The main dimensionless groups governing drop impact and employed in the present work are presented as follow:
Table I-1: Main dimensionless groups governing drop impact.
Dimensionless
Number Description Definition Relation
Weber Number importance of droplet kinetic energy and Represents a measure of relative
surface energy.
Reynolds Number Shows the relation between inertial and viscous forces. | |
Laplace Number Measures the relative importance of surface tension and viscous forces acting on the
liquid.
Ohnesorge Number
Describes the relation between capillarity and viscous forces and is important in the characterization of disintegration processes.
√
The essential influencing parameters affecting drop impact are reviewed in the following sections in order to provide an essential state of the art related with droplet and spray impingement.
6
2.1.1. Impingement Regimes
Fuel sprays impinging on surfaces involve a collection of droplets that interact between them. However, given the complexity of the spray flow, an accurate description of single droplet impacts provides an essential understanding of the fundamental mechanism which constructs a spray. From experimental data of single droplet impinging on surfaces, Bai and Gosman (1995) identified four main impingement regimes (ordered according to the impact energy, in ascendant order): stick, rebound, spread and splash. These regimes describe how a droplet behaves in the impingement process and the existence of each one depends on the properties of the impinging droplets and the impingement surface.
The stick regime occurs at low Weber numbers and when the wall temperature, , is below a characteristic temperature, . Here, the droplet adheres to the wall in a nearly spherical form. Increasing the impact energy and under specific conditions, the droplet may bounces off the surface after the impact (see Figure I-2 a)):
If the wall is dry and , it occurs where the contact between the liquid in the droplet and the wall is prevented by a layer of vapour.
If the wall is wet and the impact energy is low, it happens when an air film is trapped between the droplet and the liquid film, which makes energy losses low and results in bouncing.
a) Rebound and Partial Rebound
b) Spread (Deposition)
c) Prompt and Corona Splash.
Figure I-2: Morphology of drop impact. (Rioboo et al., 2001)
The spread regime happens when the droplet impact on the wall with moderate energy and spread out to form a wall film taking the shape of a lamella with visible outer rim, as shown in Figure I-2 b). If there is a wall film on the surface, the droplet will merge with it. For last, at very high impact velocities, the lamella take the shape of crowns consisting on a
7 thin liquid sheet with an unstable free rim – the splash regime – as shown in Figure I-2 c). Splashing may be manifested in a variety of forms ranging from ejection of a single, central droplet via jetting to numerous droplets evolved from a crown.
In 2001, Rioboo et al. (2001) added the occurrence of fingering, replaced the ambiguous splash with ―disintegration‖ and differentiated four disintegration mechanisms: prompt splash, corona splash, receding splash and partial rebound. The authors categorized the impact regimes according to their characteristics time scale as presented in Figure I-3. Later, Moita and Moreira (2007) added the finger breakup regime.
Figure I-3: Possible outcome of single droplets impacting onto non-heated dry surfaces. The classification is in accordance with the characteristic time scale, as in Rioboo et al. (2001). (Moreira et
al., 2010)
The fingering regime takes place at moderate impact velocities, when the rim of the lamella destabilize during the spreading phase at a dry surface (Yarin, 2006). Those regular structures may grow ahead of the contact line and further breakup during the last stages of spreading. In the presence of a rough surface, small portions of the lamellas fail to transpose those asperities and, consequently, the surface tensions don‘t succeed in preserve the cohesion of the lamella – this mechanism is called as receding break-up.
2.1.2. Effect of Heat Transfer
The surface temperature is an important parameter that affects the outcome of the spray impingement phenomenon. However, the consideration of the surface temperature factor introduces further complexity in the analysis of the interaction between the drops and the surface, making it more difficult to an accurate description of the spray impingement
8
phenomenon. Depending on the surface temperature, diverse heat transfer mechanisms may develop when a droplet impacts onto a heated surface. Bai and Gosman (1995) have identified the following characteristic temperatures that are used to identify the impingement regimes on hot solid surfaces:
Liquid boiling point temperature;
Pure adhesion temperature: below this temperature an impinging droplet adheres at low impact energy;
Nukiyama temperature: temperature of maximum evaporation for a specific liquid (CHF – critical heat flux), also known as critical temperature (Nukiyama, 1966);
Pure rebound temperature: above this temperature bounce occurs at low impact energy;
Leidenfrost temperature: temperature of minimum evaporation for a specific liquid (Leidenfrost, 1966).
The relation for the characteristic temperatures defined above is as follows:
Four main heat transfer regimes can be identified during spray impingement and heated surface interaction, as depicted in Figure I-4. These regimes are usually associated with temperature dependence of the heat removed by droplet gently deposited onto a hot surface, or conversely, by the droplet lifetime (Moreira et al., 2010):
I) Single phase/film evaporation : heat transfer occurs mainly by conduction and free convection, without phase change. This regime is upper limited by the saturation temperature of the liquid;
II) Nucleate boiling : as the surface temperature overcomes the saturation temperature of the liquid and the heat transfer from the surface to the liquid is large enough to cause phase transition, vapour bubbles are formed close to the wall (region ) and move through the liquid by buoyancy up to the liquid–air interface (region ). The heat is removed by vaporization and increases with the surface temperature up to a maximum at the Critical Heat Flux Temperature ( );
III) Transition : as the vaporization rate increases, an insulating vapour layer forms at the liquid–solid interface and the heat flux decreases down to a local minimum at the Leidenfrost temperature.
IV) Film boiling/Leidenfrost regime : a stable vapour layer forms, which precludes contact between the droplet and the surface and through which heat is transferred by conduction. Radiation starts to play a non-negligible role only at higher temperatures (region ), and in the case of fuel droplets, ignition may also occur, after which a slight decrease in droplet lifetime curve occurs (region in Figure I-4b).
9 Figure I-4: Boiling and lifetime curves of a droplet gently deposited on a heated surface. (Moreira et
al., 2010)
However, Wang et al. (2000) showed that this association is not so straightforward but, for ease of analysis, it is convenient to follow the picture given by Naber and Farrel (1993) that the film evaporation and nucleate boiling regimes are related with a wetting regime (region I and II) while the film boiling regime is associated with a non-wetting regime (region IV). In the transition regime, the liquid is in contact with the surface only intermittently, with partial contact only, due to separations from the surface caused by vapour expelled from the liquid (region III).
As said before, above the temperature corresponding to the local minimum in the boiling curve, the Leidenfrost phenomenon occurs, which is characterized by the appearance of a thin vapour layer, or vapour cushion, between the liquid and the surface (why referred as a non-wetting regime). With fuel drops and at high wall temperatures, auto-ignition of the fuel occurs (Rein, 2002a). Since it only takes place with liquid fuel, this doesn‘t appear in Figure I-4. Based on these observations, Habachi et al. (1999) made an assumption that the piston does not have any significant fuel film when the surface temperature exceeds the average between the boiling point and Leidenfrost temperature. When the wall temperature is above the wall is assumed to be dry.
Notwithstanding the universality of the previous heat transfer regimes for impacting droplets and sprays, the critical points of the boiling curves are influenced by impacting conditions (Panão and Moreira, 2005). In fact, the Leidenfrost temperature depends not only on the materials and wall properties but also on various other parameters such as the initial mass, size and temperature of the droplet; the impact velocity and angle of impact; and the pressures in the ambient gas (Baumeister and Simon, 1973; Bernardin and Mudawar, 1999; Nishio and Hirata, 1978; Yao and Cai, 1978; Emmerson, 1975). In addition, extensive researches have been developed to observe the influence of the fluid properties, surface roughness, and surface contamination on the Leidenfrost temperature, e.g. Bernardin and
10
Mudawar (1999). On the other hand, some authors prefer to define the Leidenfrost temperature as a dynamic property (Gottfried et al., 1966) which can be obtained experimentally as the temperature at which the vapour layer rebounds the droplets (Naber and Farrel, 1993). This is the so-called ―pure rebound temperature‖ which is, in fact, the boundary considered in the majority of the studies reported in the literature, since the identification of the different heat transfer regimes is often based on the observation of droplet morphology.
Different representations of the impinging regimes, for a dry heated wall, have been proposed by Bai and Gosman, 1995; Lee and Ryu, 2006; and Rein, 2002 (Figure I-5). These representations offer a good qualitative description of the heat induced phenomena despite the difference in the criteria used to define the boundary temperatures: they can be based on the observations of the droplet morphology (for the case of the first two authors above mentioned) or on the variation of the Leidenfrost temperature with impact conditions (Rein, 2002).
Figure I-5: Overview of droplet global representations of the impact regimes and transition conditions for a dry heated wall. a) Bai and Gosman, 1995; b) Rein, 2002; c) Lee and Ryu, 2006.
11 In turn, Senda et al. (1999) identified six different types of break-up when a droplet impinges on a heated surface (see Figure I-6), which are function of the surface temperature and the incoming droplet Weber number. For these experiments water was used as liquid and it is assumed that when a droplet impacts on the surface it deforms to a radial film on the surface. The most common regimes are:
N type: At a surface temperature above 200 ºC, the radial film breaks up since vapour blows through the centre of the film. This ―N type‖ is characterised by the fact that small droplets are blown upward with the vapour. After the vapour blow-through process, a radial film remains on the surface in a separated form.
H type: When the droplet diameter or impinging velocity increases for N type impingement, the H type appears and the number of spots where vapour blows through the film increases compared with the N type. The small droplets attributed to blow-through are distributed over the film, but the blow-through of vapour is weak compared to the N type. The separated films which remain on the surface after vapour blow-through are the N type.
V type: In this state the radial film does not decrease. The V type appears at surface temperatures of 300 ºC - 400 ºC. No partial blow through of vapour is observed, which is different from the N type, and the radial film breaks up after or when the film leaves the surface. The radial film does not remain on the surface, which dries in a short time. As the droplet diameter or impinging velocity increases further from that of the V type, break up droplets disperse in the radial direction and transition is made to the F type.
F type: In this type, the radial film leaves the surface the film state because vapour underneath the film is blown out in the radial direction. Thereafter, as the diameter of the film further increases, the radial film is torn and broken up into droplets. In the F type, vapour passes under the radial film. The behaviour of this vapour can be confirmed in those small droplets dispersed from under radial film in the radial direction, and the dispersing velocity is faster than the film velocity.
12
2.1.3. Incident angles
The impingement angle, , formed by the droplet trajectory and the surface of impact, is also an important parameter influencing the dynamic behavior of the impacting droplet, as the fine-tuning of injector position and inclination in an IC engine plays a fundamental role on engine performance (e.g., Wang et al. 2004)
Jayaratne and Mason (1964) investigated the impact of a water droplet on a liquid surface with low collision energy. The authors observed that the droplets would either coalesce or bounce with the water surface. In the latter case, the outgoing velocity and the mass exchange between the impinging droplet ant the liquid film were found to be function of the impact angle. Senda et al. (1999) observed that the normal incident droplet led to a larger amount of liquid on the wall than the droplet with other impact angles. In fact, the authors found that with smaller impingement angles the droplet slide along the surface and the fuel film changed from circular to elliptic form.
Meanwhile, Mundo et al. (1995) found that in contrary to the fluid properties, the incident angle and the ratio between the normal and tangential momentum had a strong influence on the reflected droplet. A small impingement angle led to a large ratio between tangential and normal momentum of the primary droplet, which led to a narrow distribution, both in front of and behind the point of impact, for both momentum components of the reflected droplet. Experimental data from the study showed that the ratio between the tangential momentum of the reflected droplet and the primary incoming droplet was greater than one. This indicates that the momentum in the normal direction is partially transformed into tangential momentum.
Okawa (2008) conducted an experimental study to investigate the effect of impingement angle on the total mass of secondary droplets produced during the collision of single water drops onto a plane water surface. From available experimental data (Okawa, 2006), the approximate deposition-splashing limit was expressed by . The range of impingement angles and drop diameter tested was within and , respectively. In fact, the primary drop diameter was rather small and consequently the range of dimensionless film thickness ( ) was within . The authors proposed a correlation for the number of secondary droplets, based on their own experimental results.
2.1.4. Wall Roughness
Several authors (Engel, 1955; Levin and Hobbs, 1971; Mundo et al., 1994; Mundo et
al., 1995; Mundo et al., 1998; Mutchler, 1970; Stow and Hadfield, 1981; Stow and Stainer,
1977) have observed that the surface roughness is an important parameter in droplet impingement dynamics. In fact, changes in surface roughness affect the number, the total volume and the size distribution of secondary droplets but also alter the local incidence angle of the impingement droplet. This effect becomes important when the droplets are small compared to the surface roughness. In addition, rough surfaces dramatically lower the critical
13 threshold for splash that is observed for a smooth surface (Randy et al., 2006a). Mundo et al. (1994) showed that the mass of the splash seems to decrease with increased surface roughness, which was later confirmed by Mundo et al. (1998). The latter study identified that high surface roughness makes it impossible for the fluid from an impinging droplet to be redirected in a direction normal to the surface. The splash mass is referred to by Mundo et al. (1994) as a non-dimensional quantity defined by the ratio between the splashed and the incoming droplet mass.
For droplets with high kinetic energy, the deformation of the droplet upon impact is much more irregular in rough surfaces than in the case of the smooth surfaces. In this latter case, a corona is formed in the deformation process around the point of impingement. When the wall is rough, the high tangential momentum of the incident droplet leads to a sudden and rigorous disintegration into secondary droplets. A corona and the associated instabilities before atomization are no longer identifiable. A number of secondary droplets appear behind the impact location as a result of the surface roughness (Mundo et al., 1995).
On the other hand, there are no great differences between droplets with low kinetic energy impacting on the rough surface and those impacting on smooth surfaces because the surface roughness, in this range, does not promote the splashing of the primary droplet. The droplet deposits on the surface and the liquid flows out over the wall forming a wall film.
Mundo et al. (1995) observed in their experiments that while in smooth surfaces, the diameter distribution of the secondary droplets depends on the fluid properties (viscosity and surface tensions) and kinematic parameters (velocity and size of the primary droplets), in the case of rough surfaces, the diameter distribution of the secondary droplets becomes narrower with smaller mean diameter. The influence of liquid properties was also found to be less important in the case of a rough surface. From Mutchler (1970) and Ghadiri (1978) experimental observations, the ejection angle of secondary droplets have sub ranges with higher probabilities exist dependent on the surface roughness. For instance, Ghadiri (1978) found that angle varies in a range of [ ] in situations where droplets splash on a rough soil surface; Mutcher (1970) found that the high probability for was [ ] for the case of smooth hard walls.
The Leidenfrost temperature increase with surface roughness for impacting droplets (Bernardin and Mudawaar, 1997) but decrease for sessile droplets (Avedisian and Koplik, 1987). Using a three dimensional numerical code, Bussman et al. (2000) found that the effect of surface roughness was to initially decrease the number of fingers at early times, suggesting that the magnitude of the surface roughness is related to the strength of the perturbation of the advancing fluid.
2.1.5. Liquid Film
Roisman et al. (2006) presented the possible outcomes of droplets impact onto a liquid film: float over the film, deposition and coalescence with the film, bounce or rise of a droplet ejection cascade (impacts at small Weber numbers); formation of a crater on the