ISSN: 1809-4430 (on-line) www.engenhariaagricola.org.br
1 Universidade Federal da Grande Dourados/ Dourados - MS, Brasil. 2 Universidade Federal de Viçosa/ Viçosa - MG, Brasil,
3 Instituto Federal do Sudeste de Minas Gerais/ Manhuaçu - MG, Brasil, Received in: 4-7-2017
Doi: http://dx.doi.org/10.1590/1809-4430-Eng.Agric.v38n3p361-368/2018
CASTOR BEANS QUALITY SUBJECTED TO DIFFERENT STORAGE
TEMPERATURES AND PERIODS
André L. D. Goneli
1, Paulo C. Corrêa
2, Ana P. L. R. Oliveira
3, Cesar P. Hartmann Filho
4*,
Guilherme C. Oba
14*Corresponding author. Universidade Federal da Grande Dourados/ Dourados - MS, Brasil. E-mail: [email protected]
KEYWORDS
armazenability,
Ricinus communis
L.,
post-harvest.
ABSTRACT
The control of the
temperature of the storage air have the ability to improve a better
preservation of some types of agricultural products. However, the most effective
temperature for storage as well as the duration of storage varies between products.
Therefore, special attention should be concentrated on the storage temperature and its
effects on the integrity and longevity of the produce. The objective of the present study
was to evaluate the effects of storage temperature and storage period on the quality of
castor beans. Castor seeds with a water content of approximately 6.1% (w.b.) were stored
for 180 days at temperatures of 15, 25 and 35 °C. The quality of the seeds was evaluated
every 45 days throughout the study period by measuring dry matter loss, electrical
conductivity, color, and the free fatty acid and peroxide content of the crude oil extracted.
Our results indicated that: a) higher storage temperature negatively affect the quality of
the seeds and the extracted oil; b) the negative effect of temperature increase with longer
storage period; c) the storage temperature of 15 °C least affect the quality of castor bean
and the extracted oil.
INTRODUCTION
Castor bean (Ricinus communis L.) has become a highly versatile and promising crop in recent decades in terms of its highly profitable agroenergy supply chain and capacity to generate employment opportunities directly and indirectly (Poletine et al., 2012; Goneli et al., 2016). These benefits are due to some unique characteristics of castor bean, including their adaptability to a wide range of environmental conditions across temperate and semi-arid regions, and its high oil content (approximately 45%), which is rich in ricinoleic acid (90%). These beneficial characteristics prompted the development of the Brazilian National Biodiesel Program and a broad range of industrial applications, because the raw material can be used for the production of several products, including lubricants, paints, varnishes, foam products, plastics materials, food products, and pharmaceuticals products (Campos & Santos, 2015; Mohamed & Mursy, 2015).
Therefore, considering the range of application of castor bean, research interest has intensified to identify the limitations of the production of castor beans and to
increase the value of the harvested crop. In this context, research advancements have improved the production and maintenance of castor bean, which in turn determine the market value and commercial viability of this crop (Negedu et al., 2013; Silva et al., 2013; David et al., 2014; Santoso et al., 2015). With the storage of the product, in addition to its qualitative maintenance, a better time for commercialization can be achieved due to the capacity to storage the material and wait for its most attractive price (Hartmann Filho et al., 2016). However, in Brazil, given the difficult interaction between the field and the commercial sector, generally, the static capacity becomes insufficient to meet the production and, a series of problems appear, compromising both market range and commercialization value (Nascimento et al., 2016).
storage period can accentuate product deterioration (Zonta et al., 2014; Polat, 2015; Dias et al., 2016). In this context, product deterioration involves dry matter losses, changes in color, and poor quality of by-products such as crude oil, due, mainly, to the lipidic deterioration, wich have the ability to elevate some undesirable characteristics undesirable to the oil, like the acidity and peroxide content (Del Campo et al. 2014; Paraginski et al. 2015; Hartmann Filho et al., 2016).
Therefore, the present study aimed to evaluate the effects of storage temperature and storage period on the quality of castor bean.
MATERIAL AND METHODS
The study included crop processing, storage, and evaluation of the quality of the castor beans and its crude oil, and was conducted at the Laboratory of Physical Properties and Quality of Agricultural Produce at the Viçosa Federal University in the city of Viçosa, Minas Gerais, Brazil.
The Guarani castor bean variety was used in this study. The fruits were harvested manually from the middle part of the first plant bundle with approximately 11% (w.b.) water content. (average water content that the product was collected in the cultivation region, Várzea da Palma, MG). Following this, the fruits were mechanically broken, and the seeds were separated from the shell. For the processing, a machine for corn on cob was adapted to the culture of castor bean. In view of the processing made in a machine adapted to the culture in study, a manual selection of grains, with no type of defect, was made to do not generate results inconsistent to the reality.
After processing, the water contents of the beans were approximately 6.1% (w.b.). The beans were transferred to jute sacks and subjected to storage temperatures of 15, 25, and 35 °C (to have a wide product temperature range) for 180 days. The analyses of the variables were determined at the start of the experiment and subsequently at intervals of 45 days. The products were stored in B.O.D. incubators at the three temperatures under the same storage conditions. The mean values of relative humidity of environmental air were recorded during the storage period using two thermo-hygrometers, six times a day. The temperature of the grain mass remained constant or in thermal equilibrium with the storage temperatures throughout the experiment.
Castor beans quality was evaluated by analyzing dry matter loss, electrical conductivity, and color. The quality of crude oil was assessed by determining the free fatty acid and peroxide content. The water content of each treatment was determined via gravimetric analysis in an oven at 105 ± 3 °C, for 24 h, with two repetitions (Brasil, 2009).
The dry matter of castor beans during storage was evaluated by performing five test repetitions for each treatment. Each repetition was composed of approximately 100 g of product, which was placed in perforated and waterproof packages, that were sealed and transferred to jute sacks containing the remaining beans. The mass of each repetition and water content of the material was measured at the beginning and then at 45-day intervals. The dry matter loss was calculated using [eq. (1)].
( ) (
)
( )
* *
*
(i) (θ)
i θ
(i)
i
m
m
-1 + U
1 + U
DML =
100
m
1 + U
(1)
Where,
DML: dry matter loss, %;
m(i): initial mass of bean samples, g.;
m(θ): mass of the samples at time θ, g;
Ui*: initial water content of bean samples, decimal d.b., and
Uθ*: water content of the samples at time θ, decimal d.b.
For the evaluation of electrical conductivity, four subsamples of 50 seeds were used in each treatment. Seeds were weighed and then hydrated using 75 mL of distilled deionized water for 24 h at 25 °C in 200 mL plastic cups. After this period, the electrical conductivity of the solution was determined using a Digimed conductivity meter, model DM3. Each reading (measured in S cm-1) was divided by its respective mass, and the final result of the test was expressed in S cm-1 g-1 (Vieira & Krzyzanowski, 1999).
The color was assessed by directly reading the reflectance of the beans using a tristimulus colorimeter (illuminant 10°/D65) and the Hunter color scale.
Coordinate values were obtained for the coordinates “L” (luminosity), “a” (green and red hues), and “b” (blue and
yellow hues). For each measurement, an average of three readings was obtained.
Using the values of the perceived variations
represented in the coordinates “L”,“a”,and “b” (Equations
2, 3, and 4, respectively), we calculated the total color difference (Equation 5) and the chroma index, which defined color intensity and purity (Equation 6).
(t) (t0)
L
L
L
=
−
(2)(t) (t0)
a
a
a
=
−
(3)(t) (t0)
b
b
b
=
−
(4)2 2 2
E L a b
= + + (5)
2 2
r
C
=
a
+
b
(6)Where,
E: color difference; Cr: chroma index;
t: storage period, days, and
t0 : beginning of the storage period.
The free fatty acid content was measured in accordance with the AOCS (2012), method Ca 5a-40, by dissolving three samples 5 g oil samples in ethyl alcohol, heating the solution to 60 - 65 °C, and titration with 0.1 N sodium hydroxide 0.1 N. The fatty acid content was calculated using [eq. (7)].
g
C V N
FFA =
m
(7)Where,
FFA: free fatty acids, %;
C: molar mass of the predominant acid;
Vg: volume of standardized NaOH solution, ml;
N: normality of NaOH solution, and
m: sample mass, g.
The predominant fatty acid in castor beans is ricinoleic acid, with a molar mass of 298 g mol-1.
The peroxide content was determined in accordance with the AOCS (2011), method Cd 8b-90, by dissolving three 5 g oil samples in 50 mL of a solution of acetic acid isooctane (3:2, v/v), with addition of 0.5 mL of a saturated solution of potassium iodide, followed by trituration with 0.01 N sodium thiosulfate solution (Na2S2O3) 0.01 N. The volume used in titration after addition of 0.5 mL of the starch indicator solution indicated the peroxide concentration in meq of peroxide kg-1, using [eq. (8)]:
PI =
N A - B
(
)
1000
é
ë
ù
û
m
(8)
Where,
PI: peroxide index content in meq kg-1 of the lipid fraction;
A: Volume of the sodium thiosulfate (Na2S2O3) solution used during trituration, in ml;
B: Volume of the sodium thiosulfate (Na2S2O3) solution used during titration of the reagents without the sample, in ml;
N: normality of the sodium thiosulfate (Na2S2O3) solution, and
m: sample mass, in g.
The experiment was conducted in subdivided plots 3 x 5, with three storage temperatures in each plot and five distinct storage periods in each subplot, in an entirely random design, with four replicates. The latent effect was evaluated by subjecting the data to polynomial regression analysis. The models were selected on the basis of the size of the coefficient of determination (R2), the significance of regression (using the F test), and the biological phenomenon under study.
RESULTS AND DISCUSSION
The water content of the castor beans throughout the storage period varied during the study. However, this may be a result of the hygroscopic characteristics of the
beans and relative humidity variation during the storage. Consequently, phenomena such as sorption and desorption likely occured, as described by Tiecker Junior et al. (2014) and Bessa et al. (2015) (Table 1).
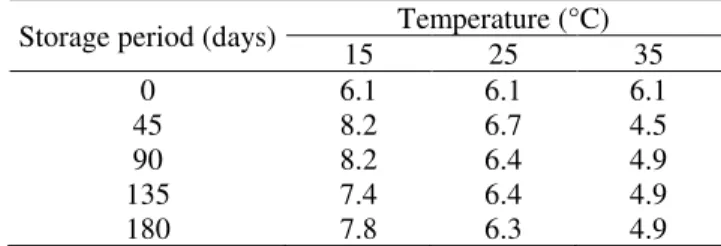
TABLE 1. Average water content (% w.b.) of beans during storage at different temperatures.
Storage period (days) Temperature (°C)
15 25 35
0 6.1 6.1 6.1
45 8.2 6.7 4.5
90 8.2 6.4 4.9
135 7.4 6.4 4.9
180 7.8 6.3 4.9
Moreover, throughout the 180 day storage period, the increase in the storage temperature decreased the equilibrium water content of the beans; this occurred because relative humidity decreased as the storage temperature increased and resulted in a lower equilibrium water content (Table 1). The average relative humidity at the storage temperatures of 15, 25 and 35 °C, was 75%, 62%, and 40%, respectively.
It is worth mentioning that although all treatments presented the same initial water content (at t0), the treatments at the lowest and highest temperatures (15 and 35 °C) presented a greater variation between the initial and final values. This indicates that, because the temperature directly affected ambient relative humidity, the water content of the beans became susceptible to alterations in either sorption (in the case of beans stored at 15 °C) or desorption (in the case of beans stored at 35 °C (Table 1).
The evaluation of the dry matter loss during storage revealed that, in general as storage temperature increased, dry matter loss increased. This effect was accentuated as storage period increased (Figure 1). After 45 days of the storage period - the first evaluation phase - the dry matter loss observed for storage temperatures of 15, 25, and 35 °C was 0.17%, 0.22%, and 0.29%, respectively (Figure 1). Therefore, due the storage time potentiated the deleterious effects, as evidenced by the multiplicative parameters of the adjusted equations and by the linear manner as the storage progressed, at 180 days storage was observed losses of 0.7%, 0.9%, and 1.2%, respectively.
Storage time (days)
0 45 90 135 180
Dr
y
m
atter
lo
ss
(
%)
0.00 0.25 0.50 0.75 1.00 1.25
1.50 15 °C
25 °C 35 °C
Estimated values
DML15 °C = 0.0037 ST (R2 = 0.9333)
DML25 °C = 0.0050 ST (R2 = 0.9858)
DML35 °C = 0.0065 ST (R2 = 0.9915)
Therefore, independent of the storage temperature used, the dry matter loss exceeded 0.5%. However, this loss occurred at different periods at the three temperatures evaluated, and corresponded to 135, 100, and 77 days storage at 15, 25, and 35 °C, respectively (Figure 1). Del Campo et al. (2014) and Paraginski et al. (2015) found that storage temperature directly affected dry matter loss, due the capacity of this factor influence the respiratory processes, increasing, or not, the metabolic rate of the product, and therefore the consumption of its reserves. Therefore, while the process of deterioration is inevitable, this process can be attenuated by using lower storage temperatures to increase product storage (Coradi et al., 2015a).
The analysis of electrical conductivity indicated that the increase in the storage temperature was a determining factor in the decrease of bean quality, as well as storage time. This change in electrical conductivity was observed, generally, at 45 days, due to the increased in the results with the elevation of temperature, and progressed linearly over time in this action (Figure 2). Furthermore it was observed for the adjusted equations the elevation of multiplicative coefficients as the elevation of the storage temperature, which proved the negative effect of the increase factor over time.
Storage time (days)
0 45 90 135 180
Elec
tric
al
con
d
u
ctiv
ity
(
S c
m
-1 g -1 g -1 )
0 80 82 84 86 88 90
92 15 °C
25 °C 35 °C
Estimated values
EC15 °C = 80.9347 + 0.0309 ST (R2 = 0.9831) EC25 °C = 80.9746 + 0.0416 ST (R2 = 0.9867) EC35 °C = 81.0882 + 0.0525 ST (R2 = 0.9775)
FIGURE 2. Electrical conductivity of absorption solution of castor beans as a function of storage temperature and storage period.
Our study design also provided information on the integrity of the seeds - in particular on its cellular membranes. An increase in storage temperature and of storage period accentuated the deterioration processes, causing physical and structural damage in the beans. This damage might have contributed to lixiviation of the solubles, which are essential for the preservation of the quality of the produce and, consequently, its storability. With the deterioration of cellular integrity, lixiviation of solubles occurs because the cellular membranes no longer efficiently function as a selective barrier at the start of absorption, and thus resulted in higher electrical conductivity values in the solution (Dias et al., 2016; Hartmann Filho et al., 2016). Deterioration often occurs when the product is stored under extreme conditions, such as storage for long periods at high temperatures because membrane integrity is gradually deteriored (Bezerra et al., 2015).
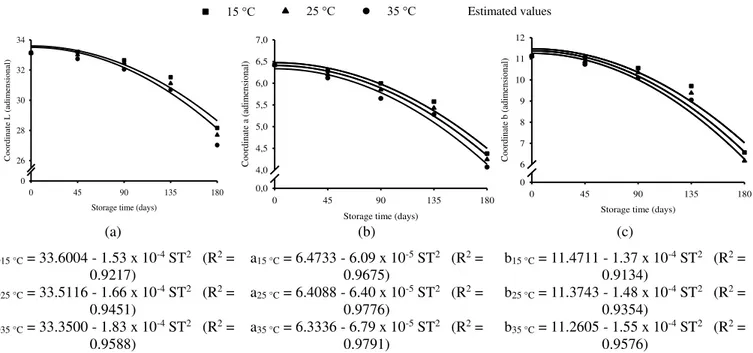
Bean color during storage also underwent changes,
which were also accentuated at higher storage
temperatures (Figure 3). Change in color was revealed by the darkening of the beans, which was evidenced by the
decrease in the “L,” “a,” and “b” values (Figure 4).
Therefore, darkening occurred when the produce exhibited values corresponding to darker hues, such as black rather than white (Figure 4a), green rather than red (Figure 4b), and blue rather than yellow (Figure 4c).
Storage time (days)
0 45 90 135 180
Co
lo
r
d
if
fer
en
ce
(a
d
im
en
sio
n
al)
0 2 4 6 8 10
15 °C 25 °C 35 °C
Estimated values
ΔE15 °C = 0.0049 + 0.0630 exp (0.0262 ST) (R2 = 0.9968)
ΔE25 °C = 0.0464 + 0.0979 exp (0.0242 ST) (R2 = 0.9942)
15 °C 25 °C 35 °C Estimated values
Storage time (days)
0 45 90 135 180
Co
o
rd
in
ate
L
(
adi
m
ens
io
n
al)
0 26 28 30 32 34
Storage time (days)
0 45 90 135 180
Co
o
rd
in
ate
a
(
ad
im
en
si
o
n
al)
0,0 4,0 4,5 5,0 5,5 6,0 6,5 7,0
Storage time (days)
0 45 90 135 180
Co
o
rd
in
ate
b (
adi
m
ens
io
n
al)
0 6 7 8 9 10 11 12
(a) (b) (c)
L15 °C = 33.6004 - 1.53 x 10⁻⁴ ST2 (R2 = 0.9217)
L25 °C = 33.5116 - 1.66 x 10⁻⁴ ST2 (R2 = 0.9451)
L35 °C = 33.3500 - 1.83 x 10⁻⁴ ST2 (R2 = 0.9588)
a15 °C = 6.4733 - 6.09 x 10⁻⁵ ST2 (R2 = 0.9675)
a25 °C = 6.4088 - 6.40 x 10⁻⁵ ST2 (R2 = 0.9776)
a35 °C = 6.3336 - 6.79 x 10⁻⁵ ST2 (R2 = 0.9791)
b15 °C = 11.4711 - 1.37 x 10⁻⁴ ST2 (R2 = 0.9134)
b25 °C = 11.3743 - 1.48 x 10⁻⁴ ST2 (R2 = 0.9354)
b35 °C = 11.2605 - 1.55 x 10⁻⁴ ST2 (R2 = 0.9576)
FIGURE 4. Differences in the coordinates “L” (a), “a” (b), and “b” (c) of castor beans, as a function of storage temperature and storage period.
Similar results were observed by Hartmann Filho et al. (2016) when evaluating the color of coffee beans after harvest. The authors observed the darkening of the produce, which was expressed as a decrease in the values
of “L,” “a,” and “b,” and this darkening correlated with higher storage temperatures and longer storage periods.
It is likely that higher storage temperatures increased the metabolic rate of the produce, as observed in Figure 3 for dry matter loss, and directly affected the
product’s appearance. So, this variable was demonstrated by the fact that the increase in storage temperature affected bean quality, and the effect was accentuated by the increase in the storage period. This result corroborates the findings of Coradi et al. (2015b) for soybeans and of Elias et al. (2016) for kidney beans.
In addition, the change in coloration (darkening) could be confirmed by determining the chroma index. This index reveals the extent of reduction in the saturation of the typical colors of the material, which acquires a more grayish hue, as observed by Mcguire (1992) (Figure 5). Silochi et al. (2016) reported that the chroma index could be used to characterize product quality, which directly impacts market acceptance and commercialization.
15 °C 25 °C 35 °C Estimated values
Storage time (days)
0 45 90 135 180
Ch
ro
m
a
(adi
m
ens
io
n
al)
0 7 8 9 10 11 12 13 14
Cr15 °C = 13.1687 - 1.49 x 10⁻⁴ ST2 (R2 = 0.9274) Cr25 °C = 13.0517 - 1.59 x 10⁻⁴ ST2 (R2 = 0.9478) Cr35 °C = 12.9158 - 1.67 x 10⁻⁴ ST2 (R2 = 0.9653)
The analysis of the extracted oil indicated that higher storage temperatures were correlated with increased free fatty acid and peroxide content, beginning at the first observation period of 45 days storage. The differences in contents were higher between storage temperatures of 15 and 35 °C, and smaller between storage temperatures of 15
and 25 °C (Figure 6). The free fatty acid content of crude oil extracted from beans stored at 15, 25, and 35 °C was 0.27%, 0.29%, and 0.36% at 45 days of storage (Figure 6a), whereas the peroxide content under the same conditions was 2.21, 2.44, and 4.56 meq kg-1 of the lipid fraction (Figure 6b).
15 °C 25 °C 35 °C Estimated values
Storage time (days)
0 45 90 135 180
Fr
ee
fatty a
cid
s (
%)
0,0 0,2 0,4 0,6 0,8 1,0 1,2
Storage time (days)
0 45 90 135 180
Pe
ro
x
id
e
in
d
ex (
m
eq k
g
-1 )
0 2 4 6 8 10 12
(a) (b)
FFA15 °C = 0.2134 + 0.0013 ST (R2 = 0.9000) FFA25 °C = 0.1918 + 0.0022 ST (R2 = 0.9000) FFA35 °C = 0.1576 + 0.0046 ST (R2 = 0.9100)
PI15 °C = 1.3572 + 0.0190 ST (R2 = 0.6100) PI25 °C = 1.2008 + 0.0275 ST (R2 = 0.8300) PI35 °C = 2.7749 + 0.0397 ST (R2 = 0.9300)
FIGURE 6. Free fatty acid content (a) and peroxide content (b) of crude oil extracted from castor beans as a function of storage temperature and storage period.
However, due to product deterioration during storage, which was evident by an increase in the multiplicative coefficients of the adjusted equations, the harmful effect of higher temperatures may be accentuated. This effect was corroborated by the results observed at 90 days of storage, when the free fatty acid content at 15, 25, and 35 °C was 0.33%, 0.39%, and 0.57%, respectively, and peroxide content at these temperatures was 3.07, 3.68, and 6.35 meq kg-1 of the lipid fraction (Figure 6).
Bezerra et al. (2015) observed that the quality of castor bean crude oil was influenced by ambient conditions and the storage period of the raw material. The degree of preservation of the raw material can determine the properties of the by-products. In addition, the quality of the crude oil can be used as a parameter for evaluating the degree of preservation of the raw material because characteristics such as the free fatty acid content indicates the stage of deterioration of the raw material (Hartmann Filho et al., 2016).
Despite the depreciation of the castor bean crude oil with storage temperature and period, we found that 180 days storage of castor beans resulted in qualities that were lower than the limits established by ANVISA (Brasil, 2005). Our results indicated that the acidity index of the crude oil from castor beans at 15, 25, and 35 °C at 180-days storage was 0.90, 1.17, and 1.96 mg KOH g-1, respectively, and the peroxide content for the same treatments was 4.78, 6.15, and 9.92 meq kg-1 of the lipid fraction (see Figure 6).This restricts the commercialization of castor bean crude oils in Brazil since acidity indexes exceed 4.0 mg KOH g-1 and peroxide content exceeds 15.0 meq kg-1 of the lipid fraction.
The acidity of castor bean oil can also be determined using the acidity index, which is defined as the amount of KOH (in mg) necessary to neutralize 1 gram of sample. The free fatty acid content can be converted to the acidity index by multiplying the value by 1.99. Crude castor bean oil can be subclassified using this index. According to Santos et al. (2007) reported that this oil could be commercially classified as medicinal (no acidity), industrial no 1 (maximum acidity of 1%), and industrial no 3 (maximum acidity of 3%). Therefore, castor bean oil can be classified as industrial oil no 1 when the beans were stored at 15 °C for 180 days and industrial no 3 when stored at 25 or 35 °C for 180 days.
CONCLUSIONS
Increased storage temperature negatively affect the quality of castor beans and its byproducts. This effect is accentuate as the storage period increased from 15 to 35 °C and storage duration increase from 45 days to 180 days.
The highest grade commercial quality oil is only achieve when beans were stored at 15 °C for up to 180 days.
ACKNOWLEDGEMENTS
REFERENCES
AOCS (1993) Official methods and recommended practices of the American Oil Chemists Society.
Champaign, AOCS, 4th ed. [AOCS Official method Ac 3-44].
AOCS (2012) Official methods and recommended practices of the American Oil Chemists Society.
Champaign, AOCS, 3th ed. [AOCS Official method Ca 5a-40].
AOCS (2011) Official methods and recommended practices of the American Oil Chemists Society.
Champaign, AOCS, 6th ed. [AOCS Official method Cd 8b-90].
Bessa JFV, Donadon JR, Resende O, Alves RMV, Sales JF, Costa LM (2015) Armazenamento do crambe em diferentes embalagens e ambientes: parte I - qualidade fisiológica. Revista Brasileira de Engenharia Agrícola e Ambiental 19(3):224-230.
Bezerra PHS, Biaggioni MAM, Silva MAP, Sperotto FCS, Brandão FJB (2015) Efeito do armazenamento na
qualidade dos grãos e do óleo de crambe para produção de biodiesel. Revista Energia na Agricultura 30(3):310-318.
Brasil (2009) Ministério da Agricultura, Pecuária e Abastecimento. Regras para análise de sementes. Brasília, DF, Secretaria de Defesa Agrícola, MAPA/ACS. 399p.
Brasil (2005) Ministério da Saúde. Agência nacional de vigilância sanitária. Regulamento técnico para óleos vegetais, gorduras vegetais e creme vegetal. Resolução RDC n. 270 de 22/09/2005. Diário Oficial da República Federativa do Brasil, Brasília, DF, 23 set. 2005. Seção 1, n. 184.
Campos ESC, Santos VML (2015) Estudo do processo de extração de óleo de mamona em cooperativas do pólo São Francisco. Engevista 17(4):477-490.
Coradi PC, Milane LV, Camilo LJ, Andrade MGO, Lima RE (2015a) Qualidade de grãos de milho após secagem e armazenamento em ambiente natural e resfriamento artificial. Revista Brasileira de Milho e Sorgo 14(3):420-432.
Coradi PC, Milane LV, Camilo LJ, Prado RLF, Fernandes TC (2015b) Qualidade de grãos de soja armazenados em baixas temperaturas. Brazilian Journal of Biosystems Engineering 9(3):197-208.
David AMSS, Araujo EF, Araujo RF, Mizobutsi EH, Amaro HTR, Dos Reis ST (2014) Qualidade sanitária de sementes de mamona (cv. IAC-226). Comunicata Scientiae 5(3):311-317.
Del Campo BG, Brumm TJ, Bern CJ, Nyendu GC (2014) Corn cob dry matter loss in storage as affected by temperature and moisture content. Transactions of the American Society of Agricultural and Biological Engineers 52(2):573-578.
Dias DCFS, Oliveira GL, Vallory GG, Silva LJ, Soares MM (2016) Physiological changes in Jatropha curcas L. seeds during storage. Journal of Seed Science 38(1):41-49.
Elias MC, Ziegler V, Romano CM, Alves GH, Paraginski RT, Oliveira M (2016) Physicochemical properties and enzymatic bean grains dried at different temperatures and stored for 225 days. Semina: Ciências Agrárias
37(3):1295-1306.
Goneli ALD, Corrêa PC, Oliveira GHH, Oliveira APLR, Orlando RC (2016) Moisture sorption isotherms of castor beans. Part 2: thermodynamic properties. Revista
Brasileira de Engenharia Agrícola e Ambiental 20(8):757-762.
Hartmann Filho CP, Goneli ALD, Masetto TE, Martins EAS, Oba GC, Siqueira VC (2016) Quality of second season soybean submitted to drying and storage. Pesquisa Agropecuária Tropical 46(3):267-275.
Mcguire RG (1992) Reporting of objective color measurements. Hortscience 27(12):1254-1255.
Mohamed MH, Mursy HM (2015) Improving quantity and quality of castor bean oil for biofuel growing under severe conditions in Egypt. Energy Procedia 68:117-121.
Nascimento Q, Marques JC, Miranda LM, Zambra EM (2016) Perdas quantitativas no transporte curto de grãos de milho (Zea mays L.) em função de aspectos gerais de pós-colheita no norte do estado de Mato Grosso. Navus: Revista de Gestão e Tecnologia 6:60-71.
Negedu A, Ameh JB, Umoh VJ, Atawodi SE, Rai MK (2013) Effects of autoclaving on the proximate
composition of stored castor (Ricinus communis) seeds. Nusantara Bioscience 5(2):51-56.
Paraginski RT, Rockenbach BA, Santos RF, Elias MC, Oliveira M (2015) Qualidade de grãos de milho armazenados em diferentes temperaturas. Revista Brasileira de Engenharia Agrícola e Ambiental 19(4):358-363.
Polat HE (2015) Effects of Different Storage Conditions on the Nutritional Qualities of Barley and Maize. Tarim Bilimleri Dergisi - Journal of Agricultural Sciences 21(2):246-255.
Poletine JP, Maciel CDG, Silva TRB, Zanotto MD (2012) Efficiency of seed treatment with fungicides in castor bean crop genotypes. Journal of Food, Agriculture &
Environment 10(2):512-516.
Santos RF, Kouri J, Barros MAL, Marques FM, Firmino PT, Requião LEG (2007) Aspectos econômicos do agronegócio da mamona. In: Azevedo DMP, Beltrão NEM. O agronegócio da mamona no Brasil. Brasília, Embrapa Informação Tecnológica, 2 ed. cap 1, p22-41.
Santoso BB, Parwata IGMA, Jaya IKD (2015) Seed viability and oil contente of castor bean (Ricinus communis
L.) as affected by packaging materials during storage. International Journal of Applied Science and Technology 5(2):56-61.
Silva JEB, Guerra HOC, Lacerda RD, Barros Júnior G, Formiga LA (2013) Produção e qualidade do fruto da mamona em semeio e rebrote sob estresse hídrico fenológico. Revista Brasileira de Engenharia Agrícola e Ambiental 17(11):1167-1172.
Tiecker Junior A, Guimarães LE, Ferrari Filho E, Castro B, Del Ponte EM, Dionello RG (2014) Qualidade físico-química de grãos de milho armazenados com diferentes umidades em ambientes hermético e não hermético. Revista Brasileira de Milho e Sorgo 13(2):174-186.
Vieira RD, Krzyzanowski FC (1999) Teste de
condutividade elétrica. In: Krzyzanowski FC, Vieira RD, França Neto JB (ed). Vigor de sementes: conceitos e testes. Londrina, ABRATES, p4-1 a 4-26.