HOLOS, Ano 30, Vol. 3 - Edição Especial - XXV ENTMME / VII MSHNT 184
DEVELOPMENT OF A HYDRODYNAMIC MODEL OF A HYDROCYCLONE INCLUDING
THE SIMULATION OF AIR-CORE EFFECT, USING THE FINITE VOLUME METHOD
G. F. AGUILERA¹ e J. E. ARISMENDY2 ¹Sumicol S.A. – Organización Corona
2Universidad Pontificia Bolivariana (Colombia)
gaguilera@corona.com.co1; juanesteba.arismendy@alfa.upb.edu.co2 Artigo submetido em novembro/2013 e aceito em dezembro/2013
DOI: http://dx.doi.org/10.15628/holos.2014.1824
ABSTRACT
The hydrocyclone is one of the most used classification equipment in industry, particularly in mineral processing. Maybe its main characteristic is to be a hydrodynamic separation equipment, whereby it has a high production capability and different levels of efficiency are depending on the geometrical configuration, operational parameters and the type of material to be processed. Nevertheless, there are a few successful studies regarding the modelling and simulation of its hydrodynamic principles, because the flow behavior inside is quite complex. Most of the current models are empirical and they are not applicable to all cases and types of minerals. One of the most important problems to be solved, besides the cut size and the effect of the physical properties of the particles, is the distribution of
the flow inside the hydrocyclone, because if the work of the equipment is at low slurry densities, very clear for small hydrocyclones, its mechanic behavior is a consequence of the kind of liquid used as continuous phase, being water the most common liquid. This work shows the modelling and simulation of the hydrodynamic behavior of a suspension inside a hydrocyclone, including the air core effect, through the use of finite differences method. For the developing of the model, the Reynolds Stress Model (RSM) for the evaluation of turbulence, and the Volume of Fluid (VOF) to study the interaction between water and air were used. Finally, the model shows to be significant for experimental data, and for different conditions of an industrial plant.
HOLOS, Ano 30, Vol. 3 - Edição Especial - XXV ENTMME / VII MSHNT 185
1 INTRODUCTION
The hydrocyclone is one of the most versatile unit of processing used in solids handling. This apparatus was introduced into industry at first time in 1891, and the first patent of use was given in the United States too. (Murthy & Udaya Bashkar, 2012). M. G. Driessen reported the first application of a hydrocyclone in mining industry in 1939. At this time other applications were reported too, as in the petroleum and chemical industry, or in processing of paper and food, because of its important advantages such as high efficiency in classification, easy installation due to its moving parts, low maintenance costs and space savings (Bouso, 2001). Nevertheless, also nowadays is possible to optimize the hydrocyclones as equipment of mineral processing, taking in account its operation parameters, separation efficiency and improvements in costs based in a better operation. It is feasible if the understanding of the hydrodynamics of the process is reached. (Bahamón, Alzate & Quintana, 2009).
But the understanding the work of the process dynamics is not an easy task because of the complexity of the flow inside the hydrocyclone. There are several empirical correlations based in geometrical and operational parameters that predict the efficiency of the separation, and give limited information under a short range (Karimi et al, 2012; Wu Chen, Zydek & Parma, 2000). In the other hand, the attempt of to reach the comprehension of the tridimensional interaction between solid-fluid inside the hydrocyclones had used instrumental methods to determine the velocity of the liquid phase flow by lasser doppler velocimetry (LDV), expensive and complex studies limited to particular cases. For this reason, simulations based in Computational Fluid Dynamics (CFD) have been successful. The clue of the methodology of solution of CFD models consists in to divide the domain under study in a very huge control volumes and in to change the partial differential equations into their algebraic equivalent by integration. (Murthy et al, 2012; Patankar & Suhas, 1980).
In addition, in the last years it has been shown that this CFD techniques give a valuable prediction for the interaction fluid-particles, and a solution for the field of flow inside this (B. Wang & A.B Yu, 2006; Wang Li et al, 2008; Delgadillo & Rajamani, 2006). But until now, most of the studies don´t have the effect of the air-core, with no real application in industry in consequence. (Nowakowski et al, 2004).
This work used CFD applied to the 40mm hydrocyclone hydrodynamics, including the air-core affect and the validation of the simulated operation with comparison with experimental data at fixed pressure. The CFD application was done with Ansys Fluent 12.1 ®, able to solve complex arrangements of partial differential equations.
2 DEFINITION OF THE EXPERIMENTAL FOUNDATIONS FOR THE STUDY
This study will be applied to the case of kaolin classification by hydrocyclones. In real processes, this classification of kaolin by hydrocyclones usually works at low solid concentrations, as showed in figure 1. In this case, the classification of the kaolin suspension is not affected by the increase of solid contents in the operation range of the industrial plant, as showed in table 1 and figures 1, 2 and 3. This fact is relevant because is necessary validate the model based on the hypothesis of operation of the hydrocyclone working only with water inside, without any effects
HOLOS, Ano 30, Vol. 3 - Edição Especial - XXV ENTMME / VII MSHNT 186 over viscosity and assuming the water movement is kinetically similar to dilute the suspension with enough separation between particles without interaction effect between them.
Table 1 - Solid concentrations in which the suspensions of kaolin could be considered as very dilute.
Volumetric Fraction of Solids (φ) % Weight Suspension DensityρP (g/L) Weight Flow (kg Solids/s)
0.012 3.06% 1019.2 0.0725
0.02 5.04% 1032 0.109
0.03 7.44% 1048 0.125
0.04 9.77% 1064 0.141
0.05 12.04% 1080 0.194
Figure 1 - Classification of a dilute suspension of kaolin in a 40mm hydrocyclone, at low solid contents (=0.012).
Figure 2 - Classification of a dilute suspension of kaolin in a 40mm hydrocyclone, at several conditions of volume fraction of solids 0 .4 0 .6 0 .8 1 2 4 6 8 10 20 40 60 80 100 200 400 600 800 1000 0 5 10 15 20 25 30 35 40 45 50 55 60 65 70 75 80 85 90 95 100 105 Pcte= 34-35 psi v = 0.012 (Feed) v = 0.012 (OverFlow) v = 0.012 (UnderFlow) % C u mu lati ve M ass Particle Diameter, (m) 0 .4 0 .6 0 .8 1 2 4 6 8 10 20 40 60 80 100 200 400 600 800 1000 0 5 10 15 20 25 30 35 40 45 50 55 60 65 70 75 80 85 90 95 100 105 v = 0.012 (UnderFlow) v = 0.02 (UnderFlow) v = 0.03 (UnderFlow) v = 0.04 (UnderFlow) v = 0.05 (UnderFlow) % C u mu lati ve M ass PArticle Diameter, (m) ANÁLISIS DE DTP LÁSER
EVALUACIÓN DE CLASIFICACIÓN HIDROCICLÓN 40 mm
Febrero 14 de 2013 Pcte= 34-35 psi 0 .4 0 .6 0 .8 1 2 4 6 8 10 20 40 60 80 100 200 400 600 800 1000 0 5 10 15 20 25 30 35 40 45 50 55 60 65 70 75 80 85 90 95 100 105 Particle Diameter, (m) % C u mu lati ve M ass P cte= 34-35 psi v = 0.012 (OverFlow) v = 0.02 (OverFlow) v = 0.03 (OverFlow) v = 0.04 (OverFlow) v = 0.05 (OverFlow) ANÁLISIS DE DTP LÁSER
EVALUACIÓN DE CLASIFICACIÓN HIDROCICLÓN 40 mm
HOLOS, Ano 30, Vol. 3 - Edição Especial - XXV ENTMME / VII MSHNT 187 Under this short analysis is clear that is valid the hypothesis to use the model working with water only, and to approximate the solution to the case of a very dilute suspension.
3 MATHEMATICAL MODEL AND BASIC ECUATIONS
The equations that rule the efficiency and velocity in non compressible fluids are described by differential equations of continuum of Navier-Stokes, as could be seen in equation 1 and 2:
0 i i x u t Equation (1)
i j i j j i j i j j i i g u u x x u x x p x u u t u ' ' Equation (2)Where i,j=1,2,3 are the sub-indexes that represent the coordinate system, is the density of the fluid, ui is the velocity, p is the pressure and he viscosity.
The term ui'uj'
is the Reynolds stress tensor and represents the turbulent fluctuations of the flow. There are several models o represent this term, such as the models - RNG and RSM (Reynolds Stress Model). Those models were used successfully in hydrocyclones because they don't assume isotropic turbulence.
3.1 Volume of Fluid Method (VOF)
The VOF model can model two or more immiscible fluids by solving a single set of momentum equations and tracking the volume fraction of each of the fluids throughout the domain (Sánz & Acosta, 2010). Typical applications include the prediction of jet breakup, the motion of large bubbles in a liquid, the motion of liquid after a dam break, and the steady or transient tracking of any liquid-gas interface.
3.2 Reynolds Stress Model for turbulence (RSM)
The equation for the Reynolds stress tensor can be given by
ij ij ij ij ij k j i k j i G P D x u u t u u ' ' Equation (3)Where all the terms represent the time (local derivative time) to the left. To the right the convection term can be represented by: Dij, the Turbulent Difussion, Pijis the stress production
term, Gij is the term for pushing, ij is the pressure term and ij is the dissipation term.
And other important terms as the turbulent kinetic energy, (4) and the turbulent dissipation rate e (5), are solved by the following equations:
2
. 2 1 2 1 . . t ij ij j k t j i i M G P x k x x u k t k Equation (4)HOLOS, Ano 30, Vol. 3 - Edição Especial - XXV ENTMME / VII MSHNT 188
k C k G C P C x x x u t k j ij ij t j i i 2 2 3 1 . . 2 1 . . . Equation (5)The values of the constants of the model are assigned as k =0.82, C=0.09, k =0.82,
C1=1.44, C2=1.92. C3 is evaluated as a function of the flow in direction of the gravitational
vector.
4 EXPERIMENTAL WORK
A kaolin suspension was classified by a 40mm hydrocyclone, always with the same feed, but varying the solid contents, at 5 different values. All of this solid content values within the dilute range, the same of figure 1. The pressure is constant and the geometry of the hydrocyclone. Each different condition was checked with density of suspension, mass flow and PSD.
5 MODELLING USING VOF METHOD
5.1 Geometry and meshing
To built the geometry of hydrocyclone, the tool used was Design Modeller of the specialized software in CFD, ANSYS FLUENT 12.1 ®. This geometry is shown in figure 4. Every small control volume is added to the others to built with all control volumes the mesh over the hydrocyclone. This process of meshing was built with the same tool Desing Modeller, but with the option “MESHING”. This option was selected with 63,000 nodes of hexahedric shape. At this point the frontier conditions, or restrictions of the model, are given.
Figure 3 - Geometry of the hydrocyclone.
Du = 14mm Con1 =175.17mm Cyl2 =128.62mm Dc = 40mm Cyl1=142mm Do = 16.08mm Lv = 35.25mm D = 26.36 mm L = 62,32mm Feed = 6.19 x 15.7 mm
HOLOS, Ano 30, Vol. 3 - Edição Especial - XXV ENTMME / VII MSHNT 189
5.2 Application of the RSM Method
The flow simulation was done using a 3D geometry and the partial differenital equations were solved using ANSYS FLUENT 12.1 ®, with the method of finite volume. The turbulence model used was RSM, and water as a continuum phase under atmospheric conditions. The algorithm SIMPLE (Semi-Implicit Method for Pressure-Linked Equations) was used to make the match between pressure and velocity to solve the Navier-Stokes equations. The interpolation Method was PRESTO, used very often in the analysis of cyclones. The order of the special discretization was quadratic (QUICK) used for hexahedric meshing. The hydrocyclone has an air core due to the high pressure and tangential feed. For this reason the best model to analyze the interaction between air and water is (VOF) having an superficial tension of 73,5 dinas/cm.
5.3 Frontier Conditions
In table 2 the frontier conditions used to built the model are shown.
Table 2 – Frontier Conditions. Frontier Conditions
Residue VOF
Feed Pressure at the entrance (psig) Vol. Fraction (water)
35 1
Underflow Pressure at the exit (psig) Vol. Fraction (water)
0 0
Overflow Pressure at the exit (psig) Vol. Fraction (water)
0 0
6 RESULTS OBTAINED
6.1 Contour of Pressure and axial velocity
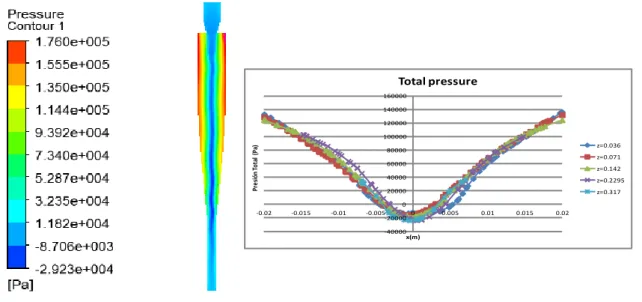
As shown in figure 5, the model gives the contour of pressure and axial velocity. The pressure is high in the upper wall of the hydrocyclone, meanwhile inside the air-core is the lower pressure (even negative one). Those results are agreed with theory.
Figure 4. Contour of pressure inside the hydrocyclone given by the model.
-40000 -20000 0 20000 40000 60000 80000 100000 120000 140000 160000 -0.02 -0.015 -0.01 -0.005 0 0.005 0.01 0.015 0.02 Pr es ión Tot al ( Pa ) x(m) Total pressure z=0.036 z=0.071 z=0.142 z=0.2295 z=0.317
HOLOS, Ano 30, Vol. 3 - Edição Especial - XXV ENTMME / VII MSHNT 190 Taking the pressure profile shown in figure 5, is possible to calculate the width of the air core. The air core is placed only in the places with negative pressure. After reviewing the corresponding data from the pressure profile, it was found that the air core has 8.6 mm. Thus, the width of the ring of underflow has 2.7 mm, for the diameter of the spigot of 14 mm.
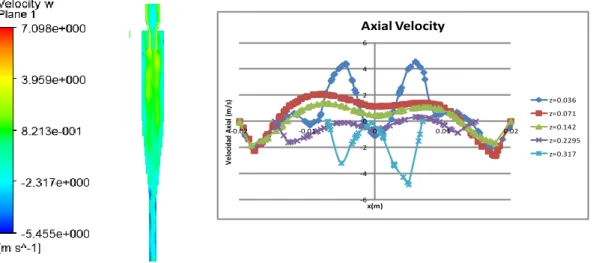
Other important analysis come from the velocity profiles. As is shown in figure 6, the velocity is not maximum in the middle of the flow, as expected. This maximum of velocity is placed close to the wall when the flow goes in direction to underflow or is close to the air core when the flow goes to direction to overflow. This is agreed with the theory of forces inside the hydrocyclone and the definition of cut size. Also is the behavior observed in the hydrocyclone: more volume of suspension with lower solid contents corresponds to the overflow, as shown in table 3.
Figure 5. Contour of axial velocity inside the hydrocyclone given by the model.
The value of the split of flows inside the hydrocyclone; after running the model 55% of the flow goes to the overflow, and 45% goes to the underflow. Based in the experimental data presented in table 3, the experimental split of flows is approximately 57% for the overflow and 42% for the underflow. This is a very good result taking in account the experimental error of the measurement system and the difficulty to take the data due to the high pressure of the different currents.
Table 3. Summary of experimental data.
7 CONCLUSIONS
The CFD model is an effective method to analyze the flow split, pressure distribution and axial velocity in a hydrocyclone. The results obtained are very close to experimental data, taking in
AL (g/L) SF (g/L) BF (g/L) AL (g/L) SF (g/L) BF (g/L) AL (g/L) SF (g/L) BF (g/L) AL (g/L) SF (g/L) BF (g/L) 1,032.3 1,005.5 1,082.8 1,055.6 1,008.9 1,143.4 1,063.0 1,011.7 1,163.1 1,086.3 1,013.0 1,195.4 Qal (L/h) QSF (L/h) QBF (L/h) Qal (L/h) QSF (L/h) QBF (L/h) Qal (L/h) QSF (L/h) QBF (L/h) Qal (L/h) QSF (L/h) QBF (L/h) 5,438.4 3,131.8 2,306.6 5,509.9 3,140.7 2,369.2 5,614.9 3,209.3 2,405.6 5,620.4 3,216.4 2,404.0 57.6 42.4 57.0 43.0 57.2 42.8 57.2 42.8 v=0.012 v=0.03 v=0.04 v=0.05 -6 -4 -2 0 2 4 6 -0.02 -0.01 0 0.01 0.02 V el oc ida d A xi al ( m /s ) x(m) Axial Velocity z=0.036 z=0.071 z=0.142 z=0.2295 z=0.317
HOLOS, Ano 30, Vol. 3 - Edição Especial - XXV ENTMME / VII MSHNT 191 account the experimental error of the measurements. Besides, this study includes the effect of the air core, and for this reason is possible to determine the width of the air core, the width of the flow just before the spray at the exit of the hydrocyclone, and the velocity profile inside the equipment. This fact is very important because is possible to analyze certainly the forces inside as a result of a flow of rising air and a flow of water going down.
8 ACKNOWLEDGES
The authors thank to Sumicol and its Technical Manager Camilo Vega, for support this study, and to the research groups of Universidad Pontificia Bolivariana, Thermodynamics and Energy, and Pulp & Paper; and the professors Hader Alzate, Germán Quintana and Andres Tabares.
9 REFERENCES
1. RAMA, Y., MURTHY, K. UDAYA BHASKAR. Parametric CFD studies on hydrocyclone. Powder Technology, Volume 230 pg. 36-47, 2012.
2. BOUSO, J. L. Hitos historicos en el desarrollo de la clasificación. IX Simposium sobre Procesamiento de Minerales, Puyehue, Chile, 2001.
3. BAHAMON, D., ALZATE, H., & QUINTANA, G. Simulación del patrón de flujo en fase simple para diferentes diseños de separadores cónicos. Universidad Pontificia Bolivariana, Editorial UPB, 2009.
4. KARIMI, M. G. AKDOGAN, DELLIMORE, K. H., & BRADSHAW, S.M. Quantification of numerical uncertainy in computational fluid dinamics modeling of hydrocyclones. Ninth International Conference on CFD in the Minerals and Process Industries, CSIRO, Melbourne, Australia, 2011. 5. WU CHEN, ZYDEK, N., & PARMA, F. Evaluation of hydrocyclone models for practical
applications. Chemical Engineering Journal, Volume 80, Issues 1–3, 1 pg. 295–303, 2000. 6. WANG, B., YU, A., B. Numerical study of particle–fluid flow in hydrocyclones with different
body dimensions. Minerals Engineering, Volume 19, Issue 10, pg. 1022–1033, 2006.
7. WANG LI- YANG, ZHENG ZHI-CHU, WU YING-XIANG, GUO JUN, ZHANG JUN & TANG CHI. Numerical and experimental study on liquid-solid flow in a hydrocyclone. Journal of Hydrodynamics, Ser. B, Volume 21, Issue 3, pg. 408-418, 2008.
8. DELGADILLO, J.A. & RAJAMANI, R. Exploration of hydrocyclone designs using computational fluid dynamics. International Journal of Mineral Processing, Volume 84, Issues 1–4, 19, pg 252– 261, 2006
9. SANZ, A., ACOSTA A. Simulación CFD de Tipo Euleriana-Euleriana de dos fluidos de un lecho fluidizado bidimensional con incorparaciones de los efectos. Universidad Carlos III de Madrid. Departamento de Ingeniería Térmica y de Fluidos. Plenum, 2010.
10. NOWAKOWSKI, A. F., CULLVAN, J.C., WILLIAMS, R.A., & DIAKOWSKY, T. Application of CFD to modelling of the flow in hydrocyclones. Is this a realizable option or still a research challenge?. Minerals Engineering, Volume 17, Issue 5, pg 661–669, 2004.
11. BHASKAR, K. U., MURTHY, Y., RAJU M., TIWARI, S., SRIVASTAVA J. K., & RAMAKRISHNAN, N. CFD Simulation and experimental validation studies on hydrocyclones. Minerals Engineering,
HOLOS, Ano 30, Vol. 3 - Edição Especial - XXV ENTMME / VII MSHNT 192 Volume 20, Issue 1, pg 60–71, 2006.
12. PATANKAR, S. Numerical heat transfer and fluid flow. Computational and Physical Processes in Mechanics and Thermal Sciences Taylor & Francis. P. 197, 1980.