Western-style diet changes murinometric and metabolic parameters of rat
offspring in time-specific windows
A dieta do estilo ocidental altera parâmetros murinométricos e metabólicos da
própria de rat em janelas específicas
DOI:10.34117/bjdv6n7-470
Recebimento dos originais: 20/06/2020 Aceitação para publicação: 20/07/2020
Elizabeth do Nascimento
Postgraduate in Nutrition, Federal University of Pernambuco (UFPE), Recife, PE, Brazil Department of Nutrition, Federal University of Pernambuco (UFPE), Recife, PE, Brazil
Corresponding author
Giselia de Santana Muniz
Postgraduate in Nutrition, Federal University of Pernambuco (UFPE), Recife, PE, Brazil Department of Nutrition, Federal University of Pernambuco (UFPE), Recife, PE, Brazil
Amanda Alves Marcelino da Silva
Postgraduate of Health Sciences, University of Pernambuco, Recife, Pernambuco-College of Nutrition, Petrolina Campus, University of Pernambuco, Petrolina, Pernambuco, Brazil
Raquel de Araújo Santana
Department of Nutrition, Federal University of Pernambuco (UFPE), Recife, PE, Brazil
Diogo Antonio Alves de Vasconcelos
Post-graduate Program in Nutrition, Physical Activity and Phenotipic Plasticity, Federal University of Pernambuco, Brazil
Taisy Cinthia Ferro Cavalcante
Postgraduate of Health Sciences, University of Pernambuco, Recife, Pernambuco-College of Nutrition, Petrolina Campus, University of Pernambuco, Petrolina, Pernambuco, Brazil
ABSTRACT
The present study evaluated the effects of the western-style diet in the time-specific windows of rodents. Male Wistar rats were divided into three groups fed on a Control diet during all experimental period (CC); a western-style diet after lactation (CW); and a westernized diet throughout entire experimental period (WW). Body weight, food and energy intake, abdominal fat, glucose tolerance, biochemical parameters and serum hormones were evaluated. Higher body weight (CC=408.6±11.3g; CW=474.1±9.2g; WW=475.8±16.3g, p<0.001), increased abdominal fat (CC=12.6±0.8g; CW=34.1± 2.3g; WW=33.2± 2.4g, p<0.001), reduced food intake (CC=26.3±0.8g; CW=17.0±0.6; WW=18.4±0.9g, p<0.001), and similar energetic intake were found among the groups fed on the western-style diet regardless to the exposure time. Also, the area under the curves of glucose tolerance test, glucose, triacylglycerol, VLDL-c and total cholesterol blood levels were higher in the western-style diet groups compared to the control groups (p<0.01). However, levels of hormones were different according to specific windows of dietary exposure. The CW group showed higher corticosterone (CC=263.4± 109.1;CW= 339.9±16.6; WW=305.5±16.2ng/mL, p<0.001) and leptin levels (CC=8.2 0.7;CW=14.5 1.4;WW=9.1 0.7ng/mL p<0.001); and the WW group showed raised
insulin levels (CC=6.7±0.3;CW=8.0±0.3;WW=10.5±0.8ng/mL, p<0.001). Then, the western-style diet enhanced signals of metabolic imbalance in both groups, but the outcomes varied according to the windows of dietary exposure.
Keywords: Western-style diet; glucose tolerance, hyperinsulinemia, hyperleptinemia, abdominal fat,
rats.
RESUMO
O presente estudo avaliou os efeitos da dieta do estilo ocidental nas janelas de tempo específicas dos roedores. Ratos Wistar machos foram divididos em três grupos: alimentados com dieta controle durante todo o período experimental (CC); uma dieta de estilo ocidental após a lactação (CW); e uma dieta ocidentalizada durante todo o período experimental (WW). Foram avaliados peso corporal, ingestão de alimentos e energia, gordura abdominal, tolerância à glicose, parâmetros bioquímicos e hormônios séricos. Maior peso corporal (CC = 408,6 ± 11,3g; PC = 474,1 ± 9,2g; WW = 475,8 ± 16,3g, p <0,001), aumento da gordura abdominal (CC = 12,6 ± 0,8g; PC = 34,1 ± 2,3g; WW = 33,2 ± 2,4g, p <0,001), consumo alimentar reduzido (CC = 26,3 ± 0,8g; PC = 17,0 ± 0,6; WW = 18,4 ± 0,9g, p <0,001) e consumo energético semelhante entre os grupos alimentados com a dieta de estilo ocidental, independentemente do tempo de exposição. Além disso, a área sob as curvas do teste de tolerância à glicose, glicemia, triacilglicerol, VLDL-c e níveis sanguíneos de colesterol total foram maiores nos grupos de dieta do estilo ocidental em comparação aos grupos de controle (p <0,01). No entanto, os níveis de hormônios foram diferentes de acordo com janelas específicas de exposição alimentar. O grupo CW apresentou níveis mais elevados de corticosterona (CC = 263,4 ± 109,1; PC = 339,9 ± 16,6; WW = 305,5 ± 16,2ng / mL, p <0,001) e níveis de leptina (CC = 8,2 0,7; PC = 14,5 1,4; WW = 9,1 0,7 ng / mL p <0,001); e o grupo WW apresentou níveis elevados de insulina (CC = 6,7 ± 0,3; PC = 8,0 ± 0,3; WW = 10,5 ± 0,8 ng / mL, p <0,001). Então, a dieta do estilo ocidental aumentou os sinais de desequilíbrio metabólico nos dois grupos, mas os resultados variaram de acordo com as janelas de exposição da dieta.
Palavras-chave: Dieta de estilo occidental, tolerância a glicose, hyperinsulinemia, hiperleptinemia,
gordura abdominal, ratos.
1 INTRODUCTION
The type of nutrition in the early fetal stage and/or immediately after birth has been seen to be critical health of descendents. It has been suggested that a western-style diet used during gestation (defined as high in simple sugars, trans and saturated fats, sodium and poor in fibers) may have deleterious outcomes on the health of offspring. The western-diet affects early development of offspring by making them susceptible to non-communicable diseases (obesity, type 2 diabetes and cardiovascular disease) throughout life (Elahi et al., 2009). Maternal nutrition with high-fat diet during gestation or during gestation and lactation, as well as an inadequate post-weaning diet closely correlated with an increased susceptibility of the offspring to the metabolic diseases in the short and/or long term (Howie et al., 2009; Jones et al., 2009; Oliveira et al., 2011). Continuous ingestion of hyperlipidic diets by the offspring leads to endothelial dysfunction (Khan et 109 al., 2004), high body weight, dyslipidemia and hepatic steatosis (Elahi et al., 2009).
Inadequate food habits characterized by high consumption of food rich in saturated lipids, sugar and sodium as well as, industrialized foods are frequently observed in western societies associated with a high prevalence of overweight/obesity. According to the World Health Organization (WHO), the problem of the number of overweight people has more than doubled in the world population since 1980. Only in 2017, studies showed that 39% of adults aged 18 years and over were overweight and 13% were obese (WHO, 2018). Overweight and obesity featured by an increased abdominal fat are associated with hypertension, glucose intolerance, hyperinsulinism, dyslipidemias, hepatic steatosis and cardiovascular disease risks (Mathieu et al., 2009; Eguchi et al., 2011). Early life has been widely studied and shown to be a period of high vulnerability to environment factors as nutrition. Nutritional aggressions at the developmental phase have dentrimental consequences for the health of offspring. However, little is known about either the effects of long-term ingestion of a human-like western-style diet nor the effects of this diet during post-weaning on long-term health.
The current study used the western-diet (rich in lipids and carbohydrates and poor in fibers) adapted for animals to test its effects on different times. Our hypothesis is the western-style diet offered post weaning is more deleterious to health than when offered continuously in metabolic terms. In this way, the aim was to evaluate the metabolic and murinometric parameters of the western-style diet on the offspring when the diet is offered only in the post-weaning period or whole time of experimental protocol.
2 MATERIALS AND METHODS
All animal procedures followed the National Council for the Control of Animal Experimentation requirements and were approved by the Ethical Committee on Experimental Animal of the Federal University of Pernambuco (UFPE), Brazil, under protocol 23076.048926/2010-88 according to the Guidelines for the Care and Use of Laboratory Animals (Bayne K. Revised Guide for the Care and Use of Laboratory Animals available. Americ Physiolog Soc. The Physiologist. 1996; 39(4): 199-208).
ANIMALS
Female Wistar rats 90–120 days old with body weight between 220–250g were mated with males 120–150 days old with body weight 320–359g. The animals were obtained from the colony of the Department of Nutrition of the Federal University of Pernambuco. When the dams were pregnant (0 day was considered when spermatozoa were found in the vaginal smear), they were separated and placed in individual cages under constant conditions of temperature (20ºC), 55-60% humidity,
luminosity (12-12h cycle, lights on at 6pm) and free access to water and standard laboratory chow diet. Monitoring of the female’s body weight gain assessed the pregnancy evolution.
DIETS AND EXPERIMENTAL GROUPS
The pregnant rats were randomly divided into two groups (n=5 per group) according to diet: Control (C, fed on standard chow diet all time); and Western-style diet (W, fed on western-style diet during gestation and lactation). On second postnatal day, the litters were reduced into eight pups by littermater. At weaning (22 days old), two males from each litter were randomly allocated to be fed on either a standard chow diet (Presence®, final composition in kcal % of macronutrients: 23% protein; 4% fat, 63% carbohydrate, 5% fiber and 3.6 kcal/g) or for western-style diet (final composition in kcal % of macronutrients: 14.7% protein; 52.6% carbohydrate, 33.3% lipids, 0.3% fiber and 4.2kcal/g). The offspring born from W dams are referred as WW (n = 8). The offspring born from C dams (n=8) are referred as CC (n = 8) or CW (n = 10), according to their post-weaning dietary intake. The male pups were kept in groups of two individuals per cage up to 140-142 days, when they were euthanized. The female pups were used in another experiment. The schematic experimental protocol adopted by the study is presented below (Figure 1).
Figure 1. Schematic experimental protocol: The control group received isoenergetic casein-based diet during gestation and lactation, and then standard chow diet after weaning. The experimental groups received “western-style ingredient– based diet during gestation, lactation and post weaning (WW group) or after weaning (CW group). G21: 21st gestation
day; PND 0: day of birth; PND21: 21st post-natal day, for weaning. PND22: 22nd post-natal day, with western-style diet.
Source: The authors
The adjustments of the ingredients in the formula for the western-style diet (protein value) were necessary to provide specific conditions needed for the growth and maintenance periods of rodents. The standard chow diet (Presence®) was offered to the rodents in order to control the post-weaning diet. The western-style diet (W) (high amount of sodium, sugar and fat) had respective
composition (kcal %) according to growth or maintenance phase: In the growth period, the composition was 19.9% protein; 49.3% carbohydrate and 31.5% lipids and 4.2kcal/g; and in the maintenance period, the composition was 14.7% protein; 52.6% carbohydrate, 33.3% lipids, 0.3% fiber and 4.2kcal/g. The proportion of macronutrients in the western-style diet (Table 1) was based on the experimental diet based according family budget survey (POF - Pesquisa de Orçamentos
Familiares) adapated to experimental research (CARVALHO, et al., 2013.). Also, it was based on
the amount of lipids intake in Europe and United States of America (Sharma et al., 2003; Astorg et al., 2004; Drewnowski & Almiron-Roig, 2010).
The two different versions (growth and maintenance) of the western-style diet were prepared by the Laboratory of Experimental Nutrition and Dietetics, Nutrition Department, UFPE. The macronutrient centesimal composition of this growth phase was analyzed by the Food Experimentation and Analysis Laboratory, Nutrition Department, UFPE. The composition of fatty acid has previously published in Ferro Cavalcante et al. (2013). In short, the fatty acids in the diet composition had 68% saturated fat (SFA), 16% monounsaturated fat (MUFA) and 16% polyunsaturated fat (PUFA) whereas the standard chow diet had 26% saturated fat, 12% monounsaturated fat and 62% polyunsaturated fat. Both diets had adequate ratios of n-3: n-6 according to Reeves (1997) (Cavalcante et al., 2013). The amount of sodium was 2.5 higher than in the control diet during the perinatal period, as well as the amount of the simple sugar.
MURINOMETRIC MEASURES
Body mass was measured at intervals (21st 60th, 90th, 120th days of age). The range of body weight gain was calculated according to the following equation: [%WG= Final weight (g) x 100 / Initial weight (g) – 100] (Bayol et al., 2004). Body dimensions (body length, thoracic and abdominal circumference) were obtained at the 60th, 90th and 120th days of age. Body length (BL) was determined
as the distance from the nose to the anus, measured with a digital caliper (Starrett®, Series 799, São Paulo, Brazil, 0.01-mm precision). We calculated the Lee index [Lee index=cube root 207 of body weight (g) / nose-to-anus length (cm3)] (Bernardis, 1970) and Body Mass Index [BMI= body weight (g)/length (cm2)] from the relation between weight and body length (Novelli et al., 2007). Lee index higher than 0.30 or BMI higher than 0.68 in animals older than 60 days were considered to be strongly associated with obesity (Novelli et al., 2007).
FOOD INTAKE
Pups between 28 and 38 days old were individually housed for 10 days in metabolic cages. The first 4 days were used for their adaptation to the cage. Subsequently, the food consumption was
determined daily for each animal during 5 days by the difference between the amount of food provided (25 g) at the onset of the light phase and the amount of remaining food 24 h later. At adulthood, the offspring (110-to-120 days old) were again individually housed in metabolic cages for 10 days using the same procedure when younger during 5 days providing 40 g of food. Fresh diet was available daily and any remaining chow from the previous day was discarded.
GLUCOSE TOLERANCE TEST (GTT)
Glucose tolerance test (GTT) was performed after fasting overnight (6:00 p.m. to 6:00 a.m.) between the 120th and 125th day old of rats. Blood samples were taken from tip of tail to withdraw
approximately 10 μL of blood. The first blood sample (baseline) was collected before glucose injection. As for the GTT, 50% glucose solution intraperitoneal (Equiplex Pharmaceutical Ltd., GO, Brazil) at 1 mg/g per body weight was intraperitoneally administered. Blood glucose levels were monitored using a glucometer (Accuchek®) before (0 time) and 30, 60, 90 and 120 minutes after glucose administration. The area under glucose curve (AUC glucose) was obtained according to the glycemic values at 0, 30, 60 and 120 minutes by using the trapezoidal method (Le Floch et al., 1990).
EUTHANASIA AND ECTOPIC FAT WEIGHT
The animals fasted overnight one day before euthanasia. The rodents were deeply anaesthetized with 10mg/kg xylazine and 100mg/kg ketamine intraperitoneally delivered, and they were sacrificed at 143±2 days of age. Blood samples were rapidly obtained by cardiac puncture. These samples were pooled in heparinized and non-heparinized tubes, and centrifuged at 1048g for 20min. Serum and plasma were stored at -70oC. Ectopic fat depots (epididymal, retroperitoneal and peri-renal fat pads) were carefully removed and weighed. The abdominal ectopic fat was obtained from each animal and relativized to the total mass weight and expressed in g%. The weight of the ectopic fat was recorded according to the Marte® scale (AS-1000), in increments of 0.001g and maximum capacity of 500g.
BIOCHEMICAL AND HORMONAL ASSESSMENT
Glucose, triglyceride (TG) total cholesterol and fractions, high-density-lipoprotein cholesterol (HDL-c) were measured in the plasma of rodents using commercial kits (Labtest®, MG, Brazil) according to the manufacturer´s instructions. Very low-density-lipoprotein cholesterol (VLDL-c) and LDL-c values were obtained using the Friedewald calculations (Friedewald et al., 1972) when cholesterol levels were below 100mg/dL (Sanchez‐Muniz & Bastida, 2008). Plasma leptin, corticosterone and insulin levels were measured following manufacturer’s instructions of commercial
immunoenzimatic assays (ELISA) (Enzo Life Sciences®, Farmingdale, NY, EUA). The sensitivity or detection limit of assays was 67.2 ng/mL for leptin and 26.99 pg/mL for corticosterone. Plasma insulin levels were measured performing manufacturer’s instructions of ELISA commercial kit (Alpco®, Salem, NH, EUA). The sensitivity of the insulin assay was 0.399 μIU/ml. Readings were obtained by microplate TP reader (Thermoplate, São Paulo, Brasil).
STATISTICAL ANALYSES
All values are given as means ± standard error of means (SEM). The normality of data was realized using the Kolmogorov Simirnov test. Regarding to statistical analysis, one-way ANOVA for simple comparison or two-way was performed followed by Bonferroni’s post-hoc test with diet and time as factors. Significance was set at P≤0.05. Data analysis was performed using Graph Pad Prism 5.0 statistical software (Graph Pad Software Inc., La Jolla, CA, USA).
3 RESULTS
MURINOMETRIC MENSURES AND FOOD INTAKE
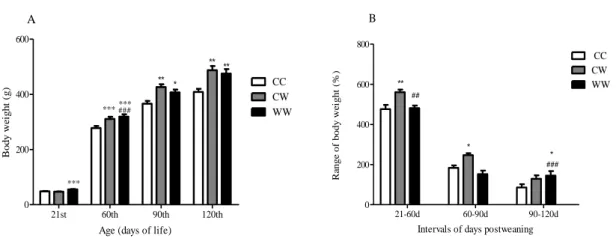
Litters from mothers subjected to the western-style diet during gestation and lactation showed greater body weight at 21days (CC, 48.52±1.25; CW, 47.06±1.01; WW, 55.08±1.15; F=14.31; p<0.001) (Figure 2A). The high body weight of initial life corresponded to a higher body weight in adulthood (Figure 2B). However, the highest body mass gain in the two groups occurred in different periods. In the CW group, it occurred between the 21st and 60th-days; but, in the WW group occurred between the 90th and 120th days (Figure 2B). The percentual body mass gain after weaning of the WW group (744%) was similar to the CC group (778%) and both was lower than the CW (936%) group.
Figure 2. Effects of the westernized diet during pregnancy and lactation chronically or post-weaning on body weight and body weight gain (from 21st to 120th day) of rats. A) Body weight, B) Range of body weight gain from
weaned pups (21 to -120 days old) Values are expressed as means (±SEM). Groups: Control (CC, n=8); Control-Westernized (CW, n=8); Control-Westernized-Control-Westernized (WW, n=8). **P<0.01; ***P<0.001 Data analyzed by one way ANOVA followed by post-hoc Bonferroni test. ***vs CC; ###vs CW.
21st 60th 90th 120th 0 200 400 600 CC CW WW ******### *** * ** ** ** A
Age (days of life)
B o d y w ei g h t ( g ) 21-60d 60-90d 90-120d 0 200 400 600 800 CC CW WW ** * * ## ### B
Intervals of days postweaning
Ra n g e o f b o d y w e ig h t (% )
Source: The authors
The daily relative food and energy intake was lower in both groups fed on western-style diet at the ages of 28-38 days (Figure 3) and also at adulthood (110-120 days) in comparison with CC group (Figure 4).
Figure 3. Effects of the westernized diet during pregnancy and lactation chronically or post-weaning on daily food consumption and energy intake in the early post-weaning (28 to 38 days old) from pups of rats. A) Intake food per 100g of body weight during 5 days (34th, 35th, 36th, 37th and 38th); B) Overall food intake; C) Energy intake during 5 days
(34th, 35th, 36th, 37th and 38th); D) Overall average caloric intake. *P<0.05; **P<0.01 ***P<0.001vs chow fed controls
(CC). Values were expressed as means (±SEM). Data analyzed by one-way ANOVA (A,C) or two-way repeated measure ANOVA (B,D) followed by Bonferroni post-hoc test.
1 2 3 4 5 5 10 15 20 25 CC CW W W A *** *** *** *** ** *** *** *** *** Days A ve ra ge da il y re la ti v e f o o d i n ta k e ( g /1 0 0 g ) CC CW WW 0 5 10 15 20 *** *** B Groups O v er al l av er ag e r el at iv e f o o d i n ta k e ( g /1 0 0 g ) 1 2 3 4 5 30 40 50 60 70 80 CC CW WW ** ** ** ** C Days Av er ag e d ail y r elativ e en erg y in ta k e (k ca ls /1 0 0 g ) CC CW WW 0 20 40 60 80 *** ** D Groups Ove ra ll a ve ra ge r ela tiv e en er g y in ta k e (k ca ls /1 0 0 g )
Source: The authors
Figure 4. Effects of the westernized diet during pregnancy and lactation, chronically or post-weaning on daily food consumption intake in the early post-weaning (110 to 120 days-old) from pups of rats. A) Intake food per 100g of body weight during 5 days (110th, 111st, 112nd, 113rd and 114th); B) Overall relative food intake per energy intake; C)
Intake food per 100g of body weight during 5 days (115th, 116th, 117th, 118th and 119th); D) Overall relative food intake
per energy intake. *P<0.05; ***P <0.001vs standard fed controls (CC). Values were expressed as means (±SEM). Data analyzed by one-way ANOVA (A,C) or two-way repeated measure ANOVA (B,D) followed by Bonferroni post-hoc test.
1 2 3 4 5 2 4 6 8 CC CW WW *** *** *** *** *** *** *** *** *** *** A Days A v er ag e d ai ly f o o d i n ta k e (g /1 0 0 g ) CC CW WW 0 2 4 6 8 *** *** B Groups O ve ra ll a v er age r el at iv e foo d i n ta k e (g /10 0 g) 1 2 3 4 5 10 15 20 25 30 CC CW WW *** *** *** *** *** *** *** *** *** *** C Days Av er ag e d ai ly r el at iv e fo o d i n ta k e (g /1 0 0 g ) CC CW WW 0 5 10 15 20 25 *** *** D Groups O v er al l av er ag e re la ti v e e n er g y i n ta k e (k ca ls /1 0 0 g )
The western-style diet also influenced murinometric measures. There was found in both groups fed western-style diet (CW and WW), higher abdominal circumference (AC), Lee index and BMI compared to the CC group. The WW group also showed a greater thoracic circumference (TC) (Table 1). This increase in murimometric parameters in the western groups was confirmed by measuring abdominal fat (Table 1). The percentage increase of abdominal fat in the groups fed on the westernized diet was evaluated. We observed that both western-style diet groups had more abdominal fat than the control group. The increase was 117.3% for CW and 109.9% for WW in comparison to the CC group (Table 1).
Table 1. Murinometric parameters of the offsprings submitted to western-style diet throughout perinatal life and post-weaning or only post-weaning.
Measures
Groups (age)
60d old 90d old 120d old
CC CW WW CC CW WW CC CW WW BL (cm) 21.30 ±0.30 22.40 ±0.20* 22.29 ±0.15* 23.73 ±0.42 24.20 ±0.29 23.23 ±0.27 24.56 ±0.36 25.02 ±0.19 24.35 ±0.25 AC (cm) 15.98 ±0.20 16.76 ±0.29 15.93 ±0.23 17.11 ±0.36 19.01 ±0.34* 17.75 ±0.33 17.99 ±0.33 19.13 ±0.42* 18.10 ±0.33* TC (cm) 13.48 ±0.13 13.82 ±0.19 13.90 ±0.15 14.53 ±0.18 15.22 ±0.17 15.06 ±0.19 15.21 ±0.22 15.72 ±0.15 16.31 ±0.28* LI (3√g/ cm) 0.30 ±0.00 0.30 ±0.00 0.31 ±0.00 0.30 ±0.00 0.31 ±0.00* 0.32 ±0.00* 0.30 ±0.00 0.31 ±0.00* 0.32 ±0.00* BMI (g/cm2) 0.60 ±0.02 0.61 ±0.03 0.64 ±0.01* 0.65 ±0.01 0.73 ±0.01*** 0.76 ±0.01*** 0.67 ±0.01 0.78 ±0.02** 0.75 ±0.02* CC (Control–Control, n=8), CW (Control-Westernized, n=9), WW (Westernized-Westernized, n=8). Body Length (BL), Abdominal Circumference (AC), Thoracic Circumference (TC), Body Mass Index (BMI) and Lee Index (LI). Values are expressed as means ± S.E.M. Data analyzed by two way RM ANOVA followed by Bonferroni post hoc test. *P<0.05; **P<0.01; ***P<0.001 vs CC.
Source: The authors
GLUCOSE TOLERANCE TEST (GTT), BIOCHEMICAL AND HORMONAL PARAMETERS The glucose tolerance test (GTT) was conducted at 110-115 days. It was elevated at 30 and 60 minutes (Figure 4A) in both groups fed on the western-style diet with a greater area under the glycemic curve (Figure 4B). The biochemical changes in glycemic and lipemic parameters were observed in both groups (CW and WW). However, corticosterone and leptina levels were only found in CW group. On the other hands, hyperinsulinism was found only the in WW group (Table 2).
Table 2. Biochemical parameters and hormonal levels of the offspring after 12h fasting (140-145 days-old) submitted to western-style diet throughout perinatal life and post-weaning or only post-weaning.
Parameters GROUPS CC CW WW P Fasting glucose(mmol/L) 6.53±0.23 12.27±0.49* 11.31±1.29* < 0.001 Triacylglycerol (mg/dL) 43.95±4.15 74.49±7.07* 78.65±9.27* =0.01 Total cholesterol (mg/dL) 61.55±3.64 99.02±6.33* 69.79±2.30δ =0.004 VLDL (mg/dL) 7.53±0.65 12.72±1.57* 16.62±1.34* <0.001
Three groups of rats are shown: CC= Control (n=8); CW= Control-Westernized (n=9); WW= Westernized-Westernized (n=8); WC= westernized-control (n=8). Dyslipidemia was observed among groups fed westernized diet. ns= no significance. Values are means ±S.E.M. *vs CCδ vs CW. Mean value was significantly different when compared to control group, except in the case of HDL-c and LDL-c levels. Data analyzed by one way ANOVA followed by Bonferroni
post-hoc test
Source: The authors
4 DISCUSSION
The present study shows that the rodents fed western-style diet during preganancy and lactation and/or post-weaning develop greater body mass, high ectopic fat depots in the abdominal region, hyperglycemia, hyperglyceridemia, hyperleptinemia, hyperinsulinism, hypercholesterolemia and high corticosterone at adulthood with small differences according to time-specific windows of dietary exposure.
The similar results in the present work relative to body weight gain have been observed in previous studies using HFD for dams during perinatal period or by weaned pups, leading to a greater body weight gain (Elahi et al, 2009; Bayol et al, 2007). Anthropometric measurements of body dimensions such as length, circumference and body mass index showed effects for the CW and WW groups. BMI; and the Lee index means obesity risk parameter of the animals with 60 days of age (Bernardis, 1970; Novelli et al., 2007). In the classic study of Novelli et al. (2007), only BMI is not considered a body fat mass index; however, it is associated with the signals of metabolic syndrome (Novelli et al., 2007).
The increased amount of lipids presents in the western-style diet is correlated with alterations in murinometric measures. Hyperplasia and hypertrophy of adipocytes are closely related to intake of HFD in early life (Samuelsson et al., 2008). In humans, birth weight or BMI in infancy and/or in adolescence is important as body weight predictors in adult life (Deckelbaum & Williams, 2001). With respect to experimental animals, this prediction is less explored and unclear (Elahi et al 2009). Although the groups (WW and CW) showed higher body weight at the end of the experimental period, the percentage of weight gain after weaning was different between the groups fed western diet. The lower body mass gain by the WW group compared to the CW group may be associated to metabolic changes in the relationship to adaptive predictive response as defended by Gluckman (Gluckman, 2005). We hypothesized that food and energy intake had been the same between the CW
HDL-c (mg/dL) 34.68±2.81 52.63±9.43 41.79±7.21 ns
LDL-c (mg/dL) 19.87±2.66 25.47±4.68 25.12±5.55 ns
Insulin (ng/mL) 6.74±0.20 7.99±0.23 10.11±0.28* δ <0.001
Corticosterone (ng/mL) 263.4±28.03 389.9±24.20* 305.5 ±23.68 =0.005
and WW groups after weaning, since the outcomes are different between groups due to the time-specific window.
The literature has reported that animals subjected to a hypercaloric or hyperlipidic diet diminish their food intake for balancing energetic needs. Or yet, it shown that hyperphagia in adulthood is caused by these diets are more palatable (Bayol et al., 2007). The western-style diet used in the current study did not induce hyperphagia in ether the WW or CW group. We attribute this fact to the increased levels of leptin or insulin found in the CW and WW groups, respectively. Increased leptin and/or insulin levels are associated with reduced food intake (Hansen et al., 2004; Zanchi et al., 2017). The rats chronically subjected to a high-fat diet have shown reduced hypothalamic NPY activity. NPY content being negatively correlated to plasma leptin concentrations (Hansen et al., 2004). Although NPY was not analyzed in the current model, 77% greater leptin was found in blood of the CW group blood compared to the CC group and the plasmatic insulin was found 150% higher in the WW group than CW group.
There was an increase of abdominal ectopic fat in the WW and CW groups compared to the CC group. These results agree with the findings demonstrated by Elahi et al. (2009), who observed a higher total body fat percentage in animal groups fed lipid-rich diet, either throughout entire experiment or only after weaning (Elahi et al., 2009). Abdominal fatty tissue increases intensely in terms to metabolism than subcutaneous fatty tissue. This occurs due to the higher catecholamine effects on lipolysis and a lesser antilipolitic effect of insulin. Hence, it occurs a higher mobilization of fatty acids of the abdominal depots than subcutaneous femoral gluteus depots (Wajchenberg, 2000; Lafontan & Berlan, 2003). Also, there is an expression of several inflammatory proteins (Bezpalko et al., 2015) mainly secreted by visceral adipocytes, such as adiponectin, angiotensinogen, interleukin-6 (IL-6), plasminogen activator inhibitor-1 (PAI-1) and the cholesterol ester transfer protein (CETP) (Lafontan & Berlan, 2003). In addition, it has known that the glucocorticoids are important to lipid homeostasis regulation. Excess and/or chronic glucocorticoid exposure may lead to lipid disorders such as central obesity, dyslipidemia and fatty liver (Wang et al., 2012). High corticosterone levels found in the CW group probably help to explain a raised amount of visceral fat in this group.
The previous studies have reported that an increase of visceral fatty is associated with a dyslipidemic state and a metabolic syndrome (Després, Lemieux & Prud’homme, 2001; Grundy et al, 2005; Kissebah & Krakower, 1994). Hyperglycemia and hypertriglyceridemia found in both groups fed western-style diet regardless to the period of onset of the diet. In turns, it showing the impact of diet on biochemical metabolic parameters and the strong relationship between abdominal fat depot and murimometric measurements found in our results.
The leptin synthetized by adipocytes is regulated by nutritional and energetic status cellular. In this study we found high cholesterol, triacylglycerol and leptin levels in CW group. In general, increased stored triglyceride results of leptin production, whereas a decreased stored fat diminishes leptin level (Myers & Greenwald-Yarnell, 2013). The leptin and other factors are involved in energy expenditure, lipid metabolism and glucose metabolism (Fraulob et al.,2012). In contrast, hyperinsulinism was found in the WW group. So, it may be associated to the early exposure of the pancreas to the high-fat diet. The use of a lipid-rich diet in rats during gestation and lactation changed the pancreatic beta cells mass, altering OGTT (oral glucose tolerance test) and induced hyperglycemia (Gregorio et al., 2013).
Consumption of a high fat diet during several critical development windows shows a strong reduction of the glucokinase and glucose transporter 2 (GLUT2) expression in the pancreas with lesser β-cells amount (Cerf et al., 2005). The monitoring of male Wistar rats up to three months old fed high-fat diet showed elevated acinar cell proliferation,and number, and large size of β-cells. It seems that beta-cell population presented hyperfunction by increasing insulin secretion without restoring normoglycemia (Cerf et al., 2012). These authors suggested that a long-term ingestion of high-fat diets might induce adaptive status in pancreatic islets (Cerf et al., 2012). The hypothesis of β-cell mass dysfunction in the WW group may be related to the hyperglycemia preceding the insulin level increase (Wells et al., 2003). According to Cerf et al. (2012), β-cell hyperplasia may not depend on glycemia or insulinemia changes, thus suggesting that more β-cells are required for glucose homeostasis.
Besides the high fat diet, the role of sugar and sodium in the westernized diet on animal metabolism disorders must not be neglected (Tranchida et al., 2012). The western-style diet used in this study contained twice sucrose and 2.5 times more sodium concentration than control diet. Srinivasan et al. (2006) exhibited altered insulin secretory pattern in response to several glucose concentrations found in pancreatic islets isolated from 120-day-old animals (Srinivasan et. al., 2006). In addition, a high sodium intake may be impaire insulin sensitivity by increasing the circulating amounts of free fatty acids (Donovan et al., 1993), consequently, worsening the pancreatic function (Cerf, 2010). Salt-sensitive rats fed on diet high in sodium showed insulin resistance likely due to different mechanisms related to obesity. The insulin pathway involving one or more metabolic downstream located in the steps of phosphatidylinositol 3-kinase and Akt activation (Ogihara et al., 2002). Therefore, our data demonstrated that there are different and similar metabolic outcomes with respect to the windows of dietary exposure. Additional researches are necessary to clarify other physiometabolic consequences and molecular mechanisms related to the western-style diet following different times of dietary exposure.
5 CONCLUSION
In the present study, the rats submitted to a western-style diet in different times of dietary exposure exhibited distint and similar consequences. Both groups fed on a western-style diet showed ectopic abdominal obesity and imminent signals of metabolic syndrome development. But, our results do not allow us conclude that western-style diet when offered continuously is less deleterious than when offered only post weaning.
ACKNOWLEDGMENTS
We appreciate the technical assistance provided by the LEAAL and by the Experimental Food Analysis Laboratory at the Federal University of Pernambuco in performing diet analysis and dietary fatty acid profiles.
FUNDING
The present study was supported by CNPq, process 476841/2010-0. 474 475
CONCEIVED THE IDEA
EN, RAS, SLS
PERFORMED THE STUDIES
TCFC; AAMS; JCF
INTERPRETATION OF THE DATA
EN, TCFC, RMC, GSM, JCF
DRAFTED THE MANUSCRIPT
EN, TCFC, RAS, CGL, AAMS, DAAV, SLS. All Authors read and approved the final manuscript.
CONFLICT INTERESTS
The authors declare that they have no competing interests.
CONSENT FOR PUBLICATION
REFERENCES
Astorg P, Arnault N, Czernichow S, Noisette N, Galan P & Hercberg S (2004). Dietary intakes and food sources of n-6 and n-3 PUFA in French adult men and women. Lipids, 39: 527-535.
Bayne K. Revised Guide for the Care and Use of Laboratory Animals available. Americ Physiolog Soc. The Physiologist. 1996; 39(4): 199-208
Bayol S, Jones D, Goldspink G & Stickland NC (2004). The influence of undernutrition during gestation on skeletal muscle cellularity and on the expression of genes that control muscle growth. Br J Nutr, 91: 331-339.
Bayol SA, Farrington SJ & Stickland NC (2007). A maternal 'junk food' diet in pregnancy and lactation promotes an exacerbated taste for 'junk food' and a greater propensity for obesity in rat offspring. Br J Nutr, 98: 843-851.
Bernardis LL (1970). Prediction of carcass fat, water and lean body mass from Lee's "nutritive ratio" in rats with hypothalamic obesity. Experientia, 26: 789-790.
CARVALHO, MF, Costa MKME, Muniz GS, Manhãs de Castro R, Nascimento E. Experimental diet based on the foods listed in the Family Budget Survey is more detrimental to growth than to the reflex development of rats. Revista de Nutrição, v. 26, n. 2, p. 177-196, 2013. https://doi.org/10.1590/S1415-52732013000200006
Cerf ME (2010). High fat programming of beta-cell failure. Adv Exp Med Biol, 654: 77-89. doi: 10.1007/978-90-481-3271-3_5.
Cerf ME, Chapman CS & Louw J (2012). High-fat programming of hyperglycemia, hyperinsulinemia, insulin resistance, hyperleptinemia, and altered islet architecture in 3-month-old wistar rats. ISRN Endocrinol, 2012: 627270. doi: 10.5402/2012/627270
Cerf ME, Williams K, Nkomo XI, Muller CJ, Du Toit DF, Louw J & Wolfe-Coote SA (2005). Islet cell response in the neonatal rat after exposure to a high-fat diet during pregnancy. Am J Physiol Regul Integr Comp Physiol, 288: R1122-1128.doi: 10.1152/ajpregu.00335.2004
Deckelbaum RJ & Williams CL (2001). Childhood obesity: the health issue. Obes Res, 9: 239S-243S.
Després JP, Lemieux I & Prud’homme D (2001). Treatment of obesity: need to focus on high risk abdominally obese patients. BMJ, 322: 716–720.
Donovan DS, Solomon CG, Seely EW, Williams GH & Simonson DC (1993). Effect of sodium intake on insulin sensitivity. Am J Physiol, 264: E730-734. DOI:10.1152/ajpendo.1993.264.5.E730
Drewnowski A & Almiron-Roig E (2010). Fat Detection: Taste, Texture, and Post Ingestive Effects: Human Perceptions and Preferences for Fat-Rich Foods. Montmayeur JP, le Coutre J, editors.
Eguchi Y, Mizuta T, Sumida Y, Ishibashi E, Kitajima Y, Isoda H, Horie H, Tashiro T, Iwamoto E, Takahashi H, Kuwashiro T, Soejima S, Kawaguchi Y, Oda Y, Emura S, Iwakiri R, Ozaki I, Eguchi T, Ono N, Anzai K, Fujimoto K & Koizumi S (2011). The pathological role of visceral fat accumulation in steatosis, inflammation, and progression of nonalcoholic fatty liver disease. J Gastroenterol, 46: 70-78. doi: 10.1007/s00535-010-0340-3.
Elahi MM, Cagampang FR, Mukhtar D, Anthony FW, Ohri SK & Hanson MA (2009). Long-term maternal high-fat feeding from weaning through pregnancy and lactation predisposes offspring to hypertension, raised plasma lipids and fatty liver in mice. Br J Nutr, 102: 514-519. doi: 10.1017/S000711450820749X.
Ferro Cavalcante TC, Lima da Silva JM, da Marcelino da Silva AA, Muniz GS, da Luz Neto LM, Lopes de Souza S, Manhaes de Castro R, Ferraz KM & do Nascimento E (2013). Effects of a westernized diet on the reflexes and physical maturation of male rat offspring during the perinatal period. Lipids, 48: 1157-1168. doi: 10.1007/s11745-013-3833-z.
Fraulob JC, Souza-Mello V, Aguila MB & Mandarim-de-Lacerda CA (2012). Beneficial effects of rosuvastatin on insulin resistance, adiposity, inflammatory markers and non-alcoholic fatty liver disease in mice fed on a high-fat diet. Clin Sci (Lond), 123: 259-270.
Kissebah AH & Krakower GR. Regional adiposity and morbidity. Physiol Rev, 74: 761– 811. doi:10.1152/physrev.1994.74.4.761
Friedewald WT, Levy RI & Fredrickson DS (1972). Estimation of the concentration of low-density lipoprotein cholesterol in plasma, without use of the preparative ultracentrifuge. Clin Chem, 18: 499-502.
Gluckman PD, Hanson MA & Spencer HG (2005). Predictive adaptive responses and human evolution. Trends Ecol Evol, 20: 527-533.
Gregorio BM, Souza-Mello V, Mandarim-de-Lacerda CA & Aguila MB (2013). Maternal high-fat diet is associated with altered pancreatic remodelling in mice offspring. Eur J Nutr, 52:759-769. doi: 10.1007/s00394-012-0382-9.
Grundy SM, Cleeman JI, Daniels SR, Donato KA, Eckel RH, Franklin BA, Gordon DJ, Krauss RM, Savage PJ, Smith SC Jr, Spertus JA, Costa F, American Heart Association, National Heart. Lung, & Blood Institute (2005). Diagnosis and management of the metabolic syndrome: an American
Heart Association/National Heart, Lung, and Blood Institute Scientific Statement. Circulation, 112: 2735-52. doi: 10.1161/circulationaha.105.169404.
Hansen MJ, Jovanovska V & Morris MJ (2004). Adaptive responses in hypothalamic neuropeptide Y in the face of prolonged high-fat feeding in the rat. J Neurochem, 88: 909-916.
Howie GJ, Sloboda DM, Kamal T & Vickers MH (2009). Maternal nutritional history predicts obesity in adult offspring independent of postnatal diet. J Physiol, 587:905-915. doi: 10.1113/jphysiol.2008.163477.
Jones HN, Woollett LA, Barbour N, Prasad PD, Powell TL & Jansson T (2009). High-fat diet before and during pregnancy causes marked up-regulation of placental nutrient transport and fetal overgrowth in C57/BL6 mice. FASEB J, 23: 271-278. doi: 10.1096/fj.08-116889.
Khan I, Dekou V, Hanson M, Poston L & Taylor P (2004). Predictive adaptive responses to maternal high-fat diet prevent endothelial dysfunction but not hypertension in adult rat offspring. Circulation, 110: 1097-1102.
Le Floch JP, Escuyer P, Baudin E, Baudon D & Perlemuter L (1990). Blood glucose area under the curve. Methodological aspects. Diabetes Care, 13: 172-175.
Mathieu P, Poirier P, Pibarot P, Lemieux I & Despres JP (2009). Visceral obesity: the link among inflammation, hypertension, and cardiovascular disease. Hypertension, 53: 577-584. doi: 10.1161/HYPERTENSIONAHA.108.110320.
Myers MG & Greenwald-Yarnell M. (2013). Leptin. Handbook of Biologically Active Peptides, 1129–1134. doi:10.1016/b978-0-12-385095-9.00152-4
Novelli EL, Diniz YS, Galhardi CM, Ebaid GM, Rodrigues HG, Mani F, Fernandes AA, Cicogna AC& Novelli Filho JL (2007). Anthropometrical parameters and markers of obesity in rats. Lab Anim, 41: 111-119.
Ogihara T, Asano T, Ando K, Sakoda H, Anai M, Shojima N, Ono H, Onishi Y, Fujishiro M, Abe M, Fukushima Y, Kikuchi M & Fujita T (2002). High-salt diet enhances insulin signaling and induces insulin resistance in Dahl salt-sensitive rats. Hypertension, 40: 83-89.
Oliveira TW, Leandro CG, de Jesus Deiro TC, dos Santos Perez G, da Franca Silva D, Druzian JI, Couto RD & Barreto-Medeiros JM (2011). A perinatal palatable high-fat diet increases food intake and promotes hypercholesterolemia in adult rats. Lipids, 46: 1071-1074. doi: 10.1007/s11745-011-3604-7
Reeves PG (1997). Components of the AIN-93 diets as improvements in the AIN-76A diet. J Nutr, 127: 838S-841S.
Samuelsson AM, Matthews PA, Argenton M, Christie MR, McConnell JM, Jansen EH, Piersma AH, Ozanne SE, Twinn DF, Remacle C, Rowlerson A, Poston L & Taylor PD (2008). Diet-induced obesity in female mice leads to offspring hyperphagia, adiposity, hypertension, and insulin resistance: a novel murine model of developmental programming. Hypertension, 51: 383-392.
Sanchez‐Muniz FJ & BASTIDA S (2008). Do not use the Friedewald formula to calculate LDL‐ cholesterol in hypercholesterolaemic rats. Eur J Lipid Sci Technol, 110: 295-301. doi.org/10.1002/ejlt.200700280.
Sharma S, Murphy SP, Wilkens LR, Shen L, Hankin JH, Henderson B & Kolonel LN (2003). Adherence to the Food Guide Pyramid recommendations among Japanese Americans, Native Hawaiians, and whites: results from the Multiethnic Cohort Study. J Am Diet Assoc, 103: 1195-1198.
Srinivasan M, Katewa SD, Palaniyappan A, Pandya JD & Patel MS (2006). Maternal high-fat diet consumption results in fetal malprogramming predisposing to the onset of metabolic syndrome-like phenotype in adulthood. Am J Physiol Endocrinol Metab, 291: E792-799. Doi:10.1152/ajpendo.00078.2006
Tranchida F, Tchiakpe L, Rakotoniaina Z, Deyris V, Ravion O & Hiol A (2012). Long-term high fructose and saturated fat diet affects plasma fatty acid profile in rats. J Zhejiang Univ Sci B, 13: 307-317. doi: 10.1631/jzus.B1100090
Wells L, Vosseller K & Hart GW (2003). A role for N-acetylglucosamine as a nutrient sensor and mediator of insulin resistance. Cell Mol Life Sci, 60: 222-228.