Physical-chemical properties of meat from confined lambs with
different levels of cottonseed in the diet
1Propriedades físico-químicas da carne de cordeiros confinados com níveis de caroço
de algodão na dieta
Luiz Gustavo de Pellegrini2*, Neila Silvia Pereira dos Santos Richards3, Renius de Oliveira Mello3, Rafael
Sanches Venturini4 and Sérgio Carvalho5
ABSTRACT - The aim of this study was to evaluate the effect of different levels of cottonseed (0, 100, 200, 300
and 400 g Kg-1) on the physical and chemical parameters of the meat of finishing lambs. Forty-five uncastrated male
lambs were distributed in a completely randomised design with five treatments of nine replications. The pH values were not influenced by the levels of cottonseed. The lipid and ash content showed significant differences, but were not adjusted by the linear or quadratic equations. Losses during thawing increased, as did cohesiveness, and water activity and water retention capacity decreased as the levels of cottonseed in the diet rose. Tocopherols, cooking loss, toughness and chewiness were adjusted using quadratic equations. In the instrumental colour evaluation, L*, b* and h° showed increasing linear behaviour. The inclusion of up to 400 g of cottonseed in the diet affects the physical-chemical composition and the colour of the produced meat.
Key words: Feeding. Gossypol. Longissimus dorsi. Quality.
RESUMO - Objetivou-se avaliar o efeito dos níveis de caroço de algodão (0; 100; 200; 300 e 400 g Kg-1) na terminação
de cordeiros sobre os parâmetros físicos e químicos da carne. Utilizou-se 45 cordeiros, machos, não castrados, distribuídos ao acaso em delineamento inteiramente casualizado com cinco tratamentos e nove repetições cada. Os valores de pH, não foram influenciados pelos níveis de caroço de algodão. Os teores de lipídios e cinzas apresentaram diferença significativa, mas não foram ajustados pelas equações lineares ou quadráticas. As variáveis perdas por descongelamento e coesividade aumentaram, e a atividade de água e capacidade de retenção de água diminuíram com o incremento de caroço de algodão na dieta. Já os tocoferóis, perdas por cocção, dureza e mastigabilidade foram ajustados através de equações quadráticas. Na avaliação instrumental de cor o L*, b* e h° demonstraram comportamento linear crescente. Logo a inclusão de até 400 g de caroço de algodão na dieta influencia a composição físico-química e na cor da carne produzida.
Palavras-chave: Alimentação. Gossipol. Longissimus dorsi. Qualidade.
DOI: 10.5935/1806-6690.20200036 *Author for correspondence
Received for publication 17/11/2017; approved on 17/04/2020
1Trabalho extraído da Tese de Doutorado do primeiro autor, apresentada ao Programa de Pós-Graduação em Ciência e Tecnologia dos Alimentos, Universidade Federal de Santa Maria
2Programa de Pós-Graduação em Ciência e Tecnologia dos Alimentos, Departamento de Tecnologia e Ciência dos Alimentos, Centro de Ciências Rurais, Universidade Federal de Santa Maria/UFSM, Santa Maria-RS, Brasil, lgpellegrini@ibest.com.br (ORCID ID 0000-0001-5133-0753) 3Departamento de Tecnologia e Ciência dos Alimentos, Centro de Ciências Rurais, Universidade Federal de Santa Maria/UFSM, Santa Maria-RS,
Brasil, neilarichardsprof@gmail.com (ORCID ID 0000-0001-6610-5567), reniusmello@gmail.com (ORCID ID 0000-0002-5934-7784)
4Departamento de Educação, Instituto Federal de Educação, Ciência e Tecnologia Farroupilha, Campus São Vicente do Sul/IFFAR SVS, São Vicente do Sul-RS, Brasil, rs_venturini@hotmail.com (ORCID ID 0000-0001-6512-9196)
5Departamento de Zootecnia, Centro de Ciências Rurais, Universidade federal de Santa Maria/UFSM, Santa Maria-RS, Brasil, scarvalhoufsm@hotmail.com (ORCID ID 0000-0003-1861-0205)
INTRODUCTION
The use of confinement when finishing lambs stands out as being an efficient system, producing young animals which are ready for slaughter more quickly and have better quality meat. In view of this, agro-industrial residue, by-products and co-products are seen as feeding alternatives in animal nutrition, especially for ruminants (RODRIGUES; RONDINA, 2013), since they replace traditional, generally more costly, ingredients.
One important co-product of the textile industry which is used in feeding ruminants is cottonseed. This has mean values of 96% dry matter, 22.87% crude protein, 52.38% neutral detergent fibre, 38.7% acid detergent fibre, 14.73% ether extract, 11.2% lignin and 3.6% mineral matter (RUFINO JUNIOR et al., 2015), quantities that make this co-product a good energy and protein supplement. Absalan et al. (2011) evaluated the performance of Zandi lambs receiving diets with 0, 4, 8 or 16% cottonseed in dry matter as a substitute for barley grain, and obtained better (P<0.05) daily weight gains (0.234, 0.252, 0.252, 0.244 kg) and feed conversion (6.11, 5.59, 5.44, 5.65); however, the 16% treatment gave a poorer result (P<0.05) than the other treatments with cottonseed, suggesting to the authors that up to 8% cottonseed be included in the diet.
However, the use of cottonseed must be carefully analysed, not only due to its high fat content, since in ruminants (usually above 7%) this is related to poor digestibility of the fibre and a consequently lower food intake (NATIONAL RESEARCH COUNCIL, 2007), but mainly due to the presence of gossypol. This is a yellow, polyphenolic compound, which is present at high concentrations in cottonseed (TILYABAEV et al., 2010), and which can cause acute or chronic poisoning, resulting in such changes as respiratory difficulty, impaired weight gain, anorexia, weakness, apathy and even death, in addition to possible cases of heart failure (GADELHA et al., 2014a).
Furthermore, there are suspicions that using cottonseed in the diet has an undesirable effect on the characteristics of the meat, since cold stores have received complaints from consumers dissatisfied with the quality of the meat from confined animals with cottonseed in their diet (CALKINS; HODGEN, 2007).
The aim of this research therefore was to evaluate the effect of diets containing different levels of cottonseed on the physical and chemical parameters of the meat when finishing lambs in confinement.
MATERIAL AND METHODS
The animals were confined on the Julio de Castilhos Campus of the Farroupilha Federal Institute of Education, Science and Technology, located in the district of Julio de Castilhos, Rio Grande do Sul, with the approval of the Ethics Committee on the Use of Animals, under protocol no 01.0378.2015/001.2015. Forty-five uncastrated male Ile de France lambs were used. After weaning, at approximately 60 days of age, they were confined in individual, fully covered stalls with an area of
approximately 2 m2 equipped with drinking troughs and
feeders.
The experimental diets (Table 1) corresponded to the addition of different levels of cottonseed: 0, 100, 200, 300 and 400 g Kg-1 dietary dry matter, formulated
to be isoproteic, with a bulk to concentrate ratio of 40:60 and including a complete mineral mixture, calculated to meet the nutritional demands of growing lambs, as per the National Research Council (2007). The diet was offered
ad libitum, twice a day, at pre-established times (08:00
and 17:00), with the amount adjusted to keep leftovers at approximately 10% of the total amount offered.
The experimental period was preceded by seven days of animal adaptation. The feeding trial started after the adaptation period, extending until each lamb reached the pre-established slaughter weight, corresponding to 60% of live weight at maturity, i.e. a live weight of 36 kg. Upon reaching the slaughter weight, the animals were fasted for 12 hours and slaughtered in accordance with the rules of the Regulations for the Industrial and Sanitary Inspection of Products of Animal Origin (BRASIL, 1952).
Immediately after chilling, the carcase was sectioned longitudinally and the longissimus dorsi muscle removed. This was sectioned, with each portion destined for analysis as per Cañeque and Sañudo (2005).
Temperature and pH were taken immediately after slaughter and the measurement repeated 1, 2, 3, 4, 5, 6, 12, 18 and 24 hours thereafter, using respectively a digital thermometer (HI 98501, Hanna Instruments, Chile) and a digital potentiometer (UP 25, Denver Instruments, USA) calibrated in a buffer solution with a pH of 4.0 and 7.0, and equipped with a glass-body penetration electrode. Measurements were taken on the longissimus dorsi muscle between the 12 th and 13 th ribs.
The proximate composition analysis was carried out as per the Instituto Adolfo Lutz (2008), where the protein was determined by the micro-Kjeldahl method, the moisture quantified by drying to constant weight in an oven at 105 ºC, the ashes by incineration in a muffle furnace at 550 ºC for 4 hours, and the extracted fat quantified by the Bligh and Dyer method (1959).
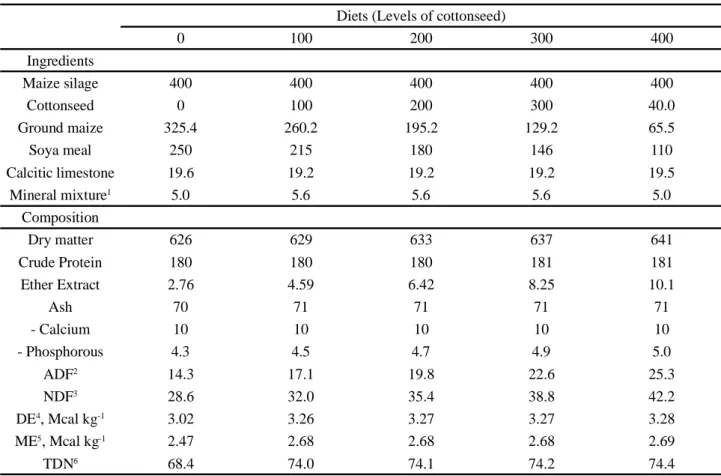
1Composition per kg: 152 g Ca, 85 g P, 135 g Na, 10 g Mg, 18 g S, 80 mg I, 1400 mg Mn, 150 mg Mo, 25 mg Se, 60 mg Co, 4000 mg Zn, 850 mg F. 2ADF- acid detergent fibre;3NDF- neutral detergent fibre;4DE- digestible energy;5ME- metabolisable energy;6TDN- total digestible nutrients
Diets (Levels of cottonseed)
0 100 200 300 400 Ingredients Maize silage 400 400 400 400 400 Cottonseed 0 100 200 300 40.0 Ground maize 325.4 260.2 195.2 129.2 65.5 Soya meal 250 215 180 146 110 Calcitic limestone 19.6 19.2 19.2 19.2 19.5 Mineral mixture1 5.0 5.6 5.6 5.6 5.0 Composition Dry matter 626 629 633 637 641 Crude Protein 180 180 180 181 181 Ether Extract 2.76 4.59 6.42 8.25 10.1 Ash 70 71 71 71 71 - Calcium 10 10 10 10 10 - Phosphorous 4.3 4.5 4.7 4.9 5.0 ADF2 14.3 17.1 19.8 22.6 25.3 NDF3 28.6 32.0 35.4 38.8 42.2 DE4, Mcal kg-1 3.02 3.26 3.27 3.27 3.28 ME5, Mcal kg-1 2.47 2.68 2.68 2.68 2.69 TDN6 68.4 74.0 74.1 74.2 74.4
Table 1 - Proportion of ingredients and chemical composition of the experimental diets, expressed in g kg-1 relative to the dry matter
The water retention capacity (WRC) of the meat was determined following the Weismer-Pedersen technique, a variant of Grau and Hamm (1953), modified
by Sierra (1973), and the water activity (aw), using
the Aqualab CX-2 Water Activity Meter (Decagon, Washington, United States). Weight loss during thawing, and cooking loss were determined by the difference in weight before and after the freezing and cooking operations. Cholesterol and tocopherol were analysed as per Prates et al. (2006).
To determine the texture profile and shear force, the samples were cut into portions, 2.5 cm thick, packed in identified aluminium foil, and placed in a grill, pre-heated to 180 ºC, until reaching a temperature of 70 ºC at their geometric centre, controlled by thermocouple.
The texture profile and shear force were determined in five samples (replications), using Texture Profile Analysis (TPA) and the Shear Force test (SF), with a texturometer (model TA.XT plus, SMS, England) equipped with the Texture Exponent 32 software (Stable Microsystems Ltd., Surrey, England).
For the TPA test, the samples at room temperature
were cut into 6 cubes of 1 cm3, then compressed twice
parallel to the direction of the muscle fibre to 80% of their size, using a P/36R metallic cylindrical probe with a diameter of 36 mm. The time between cycles was 5 seconds. A pre-test speed of 1 mm/second, a test speed of 5 mm/second and a post-test speed of 5 mm/second were used, from which the texture parameters were generated: hardness (N), cohesiveness and chewiness.
For the shear force test (SF), the samples were refrigerated for 24 hours at 4 ºC and cut parallel to the muscle fibre with the aid of a cylindrical probe, 12.1 mm in diameter. The shear force was measured in 6 sub-samples, by placing each cylinder perpendicular to the muscle fibres using a triangular Warner-Bratzler 1.016 mm blade, at a speed of 20 cm/min, coupled to the texturometer. The maximum force in kgf for each cylinder was determined and registered by the software.
For the instrumental colour evaluation, the samples were thawed at a temperature of 4 ºC for 24 hours and then sectioned, allowing the surface
to oxygenate for 30 minutes before starting the measurements.
This was carried out using the Commission Internationale de l’Éclairage (CIE) system, via a Minolta CM-700D colorimeter (Konica Minolta, Japan), using illuminant A, taking the measurements over an area of 3 mm, at an observer angle of 10°, specular component included, and calibrated with a white and black pattern; for each replication, six readings were taken at 10-second intervals at different points on the sample surface. The parameters under evaluation were L*, a* and b* of the CIELab system (where L* represents the luminosity, a* represents the intensity of the red component, and b* the intensity of the yellow component), the hue angle (h° = (arctan g [b*/ a*] )), the saturation index or chroma (C = ([a*2+b*2]½)), and
the ab ratio (ab = a*/b*), as per the American Meat Science Association (2012).
The pH and muscle temperature (longissimus dorsi) data measured from 0 to 24 hours post-mortem while chilling the carcases to 2 ºC, were adjusted by decreasing exponential regression, using the statistical model:
Yij = F + (I - F)e-kt + ε
ij (1)
where: Yij = muscle temperature (°C) or pH (dimensionless) of the j-th repetition at the i-th level of cottonseed at time
t; I initial temperature or pH; F = final temperature or
pH when t → ∞; e = exponential; k = rate of decrease in temperature or pH; t = time post-mortem (0 to 24 hours); εij= experimental error associated with each observation, assuming εij i
~
idN(0,σ2). The model parameters were
estimated by the modified Gauss-Newton algorithm used with the NLIN procedure of the SAS® software.
In order to test the equality of the parameters and the identity of the nonlinear regression equations adjusted for the different finishing systems, the likelihood ratio
test was applied with approximations given by the X2e
F statistics. The coefficient of determination (r2) of the
regression models was expressed in relation to the source treatments (regression + lack of adjustment).
The remaining data were submitted to univariate analysis of variance using the GLM procedure, with the mean values adjusted by the ordinary least squares method using the LSMEANS command, and compared by t-test at a level of 5% significance, in a completely randomised design, with five treatments of nine replications, using the initial weight of the lambs as a covariate. In addition, the trends (linear and quadratic) were tested via contrasts based on the coefficients for interpolation of the orthogonal polynomials. In addition, polynomial regression analysis was carried out to investigate changes in the dependent variables as a function of the levels of cottonseed in the diet.
The statistical analysis was carried out using the
SAS® Statistical Analysis System v9.0 software (SAS
Institute Inc., Cary, NC, USA).
RESULTS AND DISCUSSION
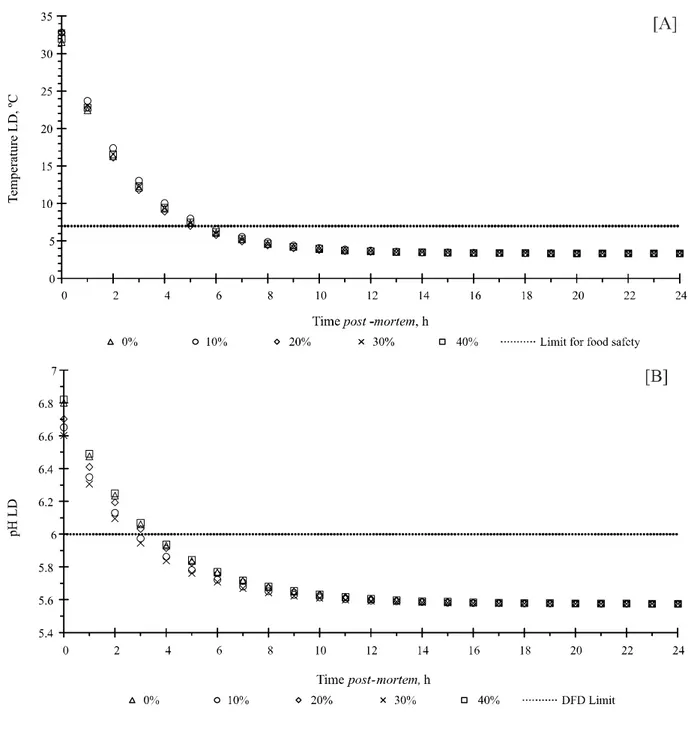
There was no effect (P>0.05) from the levels of cottonseed on the pH or temperature of the longissimus
dorsi muscle while chilling the carcases. The mean values
for initial and final pH are 6.72 and 5.57 (Figure 1B), with the initial pH slightly lower than that considered normal, which would be between 6.9 and 7.2 (PARDI et al., 2006). One possible cause for the lower initial pH values may be stress suffered by the animals before slaughter, causing a rapid conversion of muscle glycogen into lactic acid and reducing the pH (PARDI et al., 2006). Even so, these values are close to normal, as data from the literature indicate that physiologically, muscle pH decreases from 7.0 immediately after slaughter to around 5.5 to 5.8 (PARDI et al., 2006).
Similar behaviour was seen for temperature (Figure 1A), partly due to the cold room having excellent cooling capacity, but mainly because the diets had no influence (P>0.05) on the fattening stage of the carcases (ȳ = 3.04, where 1- excessively thin and 5- excessively fat), since fat directly affects the chilling rate of the carcase, behaving as a thermal insulator (ZUIN et al., 2012).
The lipid and ash content showed a significant difference (P<0.05), but the values could not be adjusted using the linear or quadratic equations (Table 2).
The lipid content showed the treatment with 400 g of added cottonseed as having the highest value (Table 2). This result may be related to the increase in cottonseed levels that raises the amount of fat in the diet (Table 1). Leão et al. (2011) found the same behaviour, and attributed the higher concentration of lipids in the meat to the higher concentration of this nutrient in the diet.
However, the reduction in lipid content in the treatment with 300 g of added cottonseed was not expected (Table 2), and may have occurred due to a fatty degeneration of the liver and hepatocytes caused by the gossypol (EL-SHARAKY et al., 2010) in the cottonseed (3.65 mg g-1 cottonseed in the dry matter),
thereby not allowing the proper use of the nutrients, and consequently causing degradation of the adipose tissue in order to supply some nutritional need. This would lead to an increase in the flow of non-esterified fatty acids in the plasma, with these being sent to the liver to be converted into lipoproteins and then distributed to the tissues for use (CARVALHO et al., 2013).
Figure 1 - Muscle (longissimus dorsi) temperature (A) and pH (B) curves from 0 to 24 hours post-mortem obtained while chilling to
2 ºC the carcases of confined lambs with levels of cottonseed in the diet
There was a reduction in water activity (aw) and water retaining capacity (WRC) with the increased cottonseed in the diet (Table 2). This behaviour of the aw may have occurred due to greater interaction of the water with the protein matrix of the meat, contributing significantly to the reduction in aw (SABADINI et al., 2001).
The reduction in WRC cannot be explained, as the literature and the data are contradictory. The various losses during thawing (LDT) and the cohesiveness
showed increasing linear behaviour for the increases in cottonseed in the diet (Table 2). The increase in LDT was due to a decrease in the water retention capacity (Table 2) caused by the increased levels of cottonseed, resulting in a greater loss of liquid during thawing (CALDARA et al., 2012).
However, despite the behaviour shown by the LDT, the treatment with the added 300 g of cottonseed had a higher percentage loss, due to the lower percentage of intramuscular fat (CLIMACO et al., 2011).
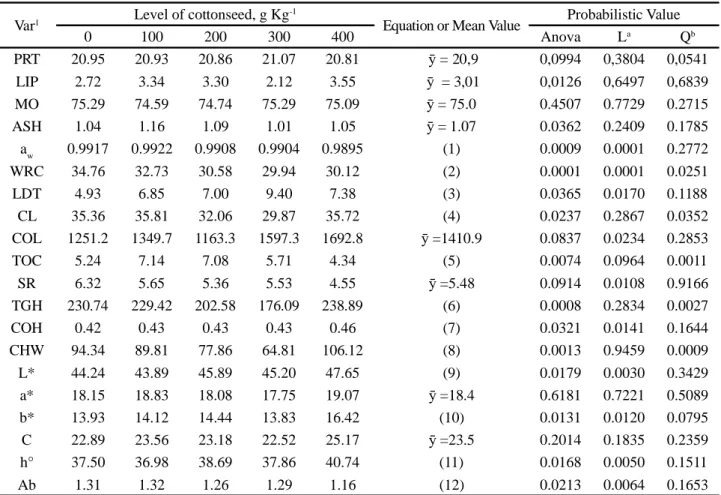
1Varibles: PRT- protein (CV= 3.25%); LIP- Lipids (CV= 30.3%); MO- moisture (CV= 1.33%); ASH- ASH (CV= 9.16%); a
w- Water activity (CV= 0.13%); WRC- Water retention capacity (CV= 6.46%); LDT- Loss during thawing (CV= 39.7%); CL- Cooking loss (CV= 13.2%); COl-cholesterol (CV= 32.2%); TOC- tocopherols (CV= 30.3%); SF- Shear force (CV= 23.6%); TGH- toughness (CV= 14.7%); COH-cohesiveness (CV=5.70%); CHW- chewiness (CV=23%); L*- Luminosity (CV= 5.38%); a*- Red index (CV= 11%); b*- Yellow index (CV= 11.6%); C-Saturation index (CV= 10.5%); ho- Tonal angle (CV= 6%); ab- oxidation state myoglobin (CV= 8.37%);aL = linear trend;bQ = quadratic trend; CV (%) = coefficient of variation (1)ŷ AW = 0.9921 - 0.00006X (r 2 = 0.86); (2)ŷ CRA = 34.03-0.0121X (r 2 = 0.84); (3)ŷ PDC = 5.63 + 0.0074X (r 2 = 0.54); (4)ŷ PC = 36.55 - 0.0401X + 0.00008X 2(r2 = 0.47); (5)ŷ TOC = 5.43 + 0.0192X - 0.00005X 2(r2 = 0.93); (6)ŷ DUR = 241.21 - 0.3979X + 0.0009X 2(r2 = 0.49); 7)ŷ COE = 0.42 + 0.00006X (r 2 = 0.56); 8)ŷ MAS = 99.76 - 0.2565X + 0.0006X 2(r2 = 0.57); (9)ŷ L* = 43.74 + 0.0081X (r 2 = 0.74); (10)ŷ b* = 13.62 + 0.0046X (r 2 = 0.47); (11)ŷ ho = 36.94 + 0.0072X (r 2 = 0.62); (12)ŷ ab = 1.33 - 0.0003X (r 2 = 0.63)
Table 2 - Physical-chemical composition and objective colour indices of the longissimus dorsi muscle in confined lambs with levels
of cottonseed in the diet
Var1 Level of cottonseed, g Kg
-1
Equation or Mean Value Probabilistic Value
0 100 200 300 400 Anova La Qb PRT 20.95 20.93 20.86 21.07 20.81 ȳ = 20,9 0,0994 0,3804 0,0541 LIP 2.72 3.34 3.30 2.12 3.55 ȳ = 3,01 0,0126 0,6497 0,6839 MO 75.29 74.59 74.74 75.29 75.09 ȳ = 75.0 0.4507 0.7729 0.2715 ASH 1.04 1.16 1.09 1.01 1.05 ȳ = 1.07 0.0362 0.2409 0.1785 aw 0.9917 0.9922 0.9908 0.9904 0.9895 (1) 0.0009 0.0001 0.2772 WRC 34.76 32.73 30.58 29.94 30.12 (2) 0.0001 0.0001 0.0251 LDT 4.93 6.85 7.00 9.40 7.38 (3) 0.0365 0.0170 0.1188 CL 35.36 35.81 32.06 29.87 35.72 (4) 0.0237 0.2867 0.0352 COL 1251.2 1349.7 1163.3 1597.3 1692.8 ȳ =1410.9 0.0837 0.0234 0.2853 TOC 5.24 7.14 7.08 5.71 4.34 (5) 0.0074 0.0964 0.0011 SR 6.32 5.65 5.36 5.53 4.55 ȳ =5.48 0.0914 0.0108 0.9166 TGH 230.74 229.42 202.58 176.09 238.89 (6) 0.0008 0.2834 0.0027 COH 0.42 0.43 0.43 0.43 0.46 (7) 0.0321 0.0141 0.1644 CHW 94.34 89.81 77.86 64.81 106.12 (8) 0.0013 0.9459 0.0009 L* 44.24 43.89 45.89 45.20 47.65 (9) 0.0179 0.0030 0.3429 a* 18.15 18.83 18.08 17.75 19.07 ȳ =18.4 0.6181 0.7221 0.5089 b* 13.93 14.12 14.44 13.83 16.42 (10) 0.0131 0.0120 0.0795 C 22.89 23.56 23.18 22.52 25.17 ȳ =23.5 0.2014 0.1835 0.2359 h° 37.50 36.98 38.69 37.86 40.74 (11) 0.0168 0.0050 0.1511 Ab 1.31 1.32 1.26 1.29 1.16 (12) 0.0213 0.0064 0.1653
The increase in cohesiveness is explained by a decrease in the water retention capacity, which affords greater strength to the internal connections and a consequently greater resistance to structural disintegration, leading to an increase in cohesiveness (CARR et al., 2006).
The values for the tocopherols, cooking loss (CL), toughness and chewability were adjusted via quadratic equations (Table 2). The tocopherol content was maximised with the addition of 174.2 g cottonseed, whereas the other variables were at their lowest point
with 233.2, 222.7 and 202.9 g cottonseed added to the diet respectively.
This initial increase in tocopherols is caused by the levels of cottonseed in the diet, as the oil in the seed is rich in tocopherols (OLIVEIRA et al., 2016); increasing the levels of cottonseed also increases the intake of oil and consequently, of tocopherols. On the other hand, the reduction seen starting at 174.2 g occurred due to the high levels of lipids in the diet (over 7%), also caused by the addition of cottonseed, as this provides less fibre digestibility and, consequently, less feed intake (NATIONAL RESEARCH COUNCIL, 2007), in addition to inhibiting ruminal fermentation and reducing any advantages from the feed (KOZLOSKI, 2011). This interferes with the absorption of tocopherols, as they have the same absorption pathway as the lipids, and require a normal biliary tract (KUMAR; ABBAS; ASTER, 2016).
The reduction in CL up to 233.2 g cottonseed in the diet is due to the increase in lipid content at these levels, since cooking losses are lower in meat with a higher lipid content (BATISTA et al., 2010), compensating for the reduction in WRC. The increase starting at 233.2 g cottonseed, on the other hand, can be explained by the decrease in WRC, since the weight lost by cooking is influenced by the water retention capacity of the meat structures (MONTE et al., 2012), and is not offset by the lipid content.
Both hardness and chewability showed quadratic behaviour, with minimum points that were very close (222.7 and 202.9 g cottonseed). This was due to the similar behaviour of the CL, the opposite occurring from 222.7 and 202.9 g cottonseed in the diet.
The variables L*, b* and h° displayed increasing linear behaviour (Table 2), indicating that with the increase in the levels of cottonseed, the longissimus dorsi muscle became lighter in colour, more yellow and with a greater yellow hue.
The increase in L* indicates that the meat became lighter in colour with the increased levels of cottonseed in the diet, which can be explained by the decreasing linear behaviour of the water retaining capacity (Table 2), because when this is reduced, there is a greater release of water on the surface of the meat, consequently making it brighter and lighter in colour (MORAES; RODRIGUES, 2017).
The linear increase in b* (Table 2) is due to the cottonseed being rich in oil and gossypol, a yellowish polyphenolic alkaloid (TILYABAEV et al., 2010) that is deposited and found in meat (KIM; CALHOUN; STIPANOVIC, 1996). On the other hand, the linear
increase in h° was due to the increase in b*, since a* showed no significant difference between treatments, confirming that the meat became lighter in colour and more yellow with the increased levels of cottonseed.
The values of ab show a linear reduction of 0.32 for the increasing levels of cottonseed added to the diet (Table 2), also explained by the rise in b*, giving a reduction in redness, and increasing the discoloration of the longissimus dorsi muscle.
CONCLUSIONS
1. The addition of whole cottonseed to the diet of the Ile de France lambs resulted in an increase in the losses during thawing, the cohesiveness, luminosity, yellow index and hue angle, and a reduction in the water activity, water retention capacity, and ab ratio. Cooking loss, tocopherols, hardness and chewability displayed quadratic behaviour;
2. Therefore, the addition of a maximum of 200 g kg-1
cottonseed to the lamb diet during the finishing phase in confinement is recommended, since from this point, the levels of cottonseed negatively affect the physical and chemical parameters of the meat.
REFERENCES
ABSALAN, M. et al. Feeding of whole cottonseed
on performance, carcass characteristics and intestinal morphology of Zandi lambs. South African Journal of
Animal Science, v. 41, n. 3, p. 309-317, 2011.
AMERICAN MEAT SCIENCE ASFOCIATION. Meat color
measurement guidelines. Champaign, Illinois, USA: AMSA,
2012. 136 p.
BATISTA, A. S. M. et al. Effect of energy concentration in the diets on sensorial and chemical parameters of Morada Nova, Santa Inez and Santa Inez x Dorper lamb meat. Revista Brasileira de Zootecnia, v. 39, n. 9, p. 2017-2013, 2010.
BLIGH, E. G.; DYER, W. J. A rapid method of total lipid extraction and purification. Canadian Journal of Biochemistry
and Physiology, v. 37, n. 8, p. 911-917, 1959.
BRASIL. Ministério da Agricultura, Pecuária e Abastecimento. Regulamento da Inspeção Industrial e Sanitária de Produtos de Origem Animal - RIISPOA. Brasília: MAPA, 1952. 154 p. CALDARA, F. R. et al. Physical and sensory properties of PSE pork. Revista Brasileira de Saúde e Produção Animal, v. 13, n. 3, p. 815-824, 2012.
CALKINS, C. R.; HODGEN, J. M. A fresh look at meat flavor.
CAÑEQUE, V.; SAÑUDO, C. Estandarización de lãs
metodologías para evaluar la calidad del producto (animal vivo, canal, carne y grasa) en los rumiantes. Madri: INIA,
2005. 448 p. (Serie Ganadera, 3).
CARR, L. G. et al. Physical, textural and sensory characteristics of 7-day frozen part-baked French bread. Food Science and
Technology, v. 39, n. 5, p. 540-547, 2006.
CARVALHO, W. L. et al. Mecanismos da intoxicação do fígado de rato causada pelo gossipol. Pesquisa Veterinária Brasileira, v. 33, n. 3, p. 339-344, 2013.
CLIMACO, S. M. et al. Carcass characteristics and meat quality of four genetics groups of beef cattle finished in feedlot.
Revista Brasileira de Zootecnia, v. 40, n. 12, p. 2791-2798,
2011.
EL-SHARAKY, A. S. et al. Spermatotoxicity, biochemical changes and histological alteration induced by gossypol in testicular and hepatic tissues of male rats. Food and Chemical
Toxicology, v. 48, n. 12, p. 3354-3361, 2010.
GADELHA, I. C. N. et al. Gossypol toxicity from cottonseed products. The Scientific World Journal, v. 2014, n. 2014, p. 1-11, 2014a.
INSTITUTO ADOLFO LUTZ. Normas analíticas do Instituto Adolfo Lutz. Métodos físico-químicos para análise de
alimentos. 4. ed. 1. ed digital. São Paulo: Instituto Adolfo Lutz,
2008. 1020 p.
KIM, H. L.; CALHOUN, M. C.; STIPANOVIC, R. D. Accumulation of gossypol enantiomers in ovine tissues.
Comparative Biochemistry and Physiology, v. 113, n. 2,
p. 417-420, 1996.
KOZLOSKI, G. V. Bioquímica dos ruminantes. 3. ed. Santa Maria: Editora da UFSM, 2011, 216 p.
KUMAR, V.; ABBAS, A. K.; ASTER, J. C. Robins e Cotran: patologia: bases patológicas das doenças. 9. ed. Rio de Janeiro: Elsevier, 2016. 1440 p.
LEÃO, A. G. et al. Características nutricionais da carne de cordeiros terminados com dietas contendo cana-de-açúcar ou silagem de milho e dois níveis de concentrado. Revista
Brasileira de Zootecnia, v. 40, n. 5, p. 1072-1079, 2011.
MONTE, A. L. S. et al. Qualidade da carne caprina e ovina: uma revisão. Agropecuária Científica do Semiárido, v. 8, n. 3, p. 11-17, 2012.
MORAES, F.; RODRIGUES, N. S. S. Yield maximization in sous vide cooked beef (Semitendinosus muscle). Brazilian
Journal of Food Tecnology, v. 20, e2016048, 2017.
NATIONAL RESEARCH COUNCIL. Nutrient requirements
of small ruminants: sheep, goats, cervids, and new world
camelids. 1. ed. Washington, D.C.: National Academy Press, 2007. 384 p.
OLIVEIRA, A. S. et al. Biochemical changes in fiber naturally colored cottonseeds during storage. Journal of Seed Science, v. 38, n. 2, p. 101-109, 2016.
PARDI, M. C. et al. Ciência, higiene e tecnologia da carne. Goiana: Editora da Universidade Federal de Goias, 2006. v. 1, 624 p.
PRATES, J. A. M. et al. Simultaneous HPLC quantification of total cholesterol, tocopherols and β-carotene in Barrosã-PDO veal. Food Chemistry, v. 94, p. 469-477, 2006.
RODRIGUES, F. V.; RONDINA, D. Alternativas de uso de subprodutos da cadeia do biodiesel na alimentação de ruminantes: glicerina bruta. Acta Veterinaria Brasilica, v. 7, n. 2, p. 91-99, 2013.
RUFINO JUNIOR, J. et al. Whole cottonseed in diets without roughage for feedlot lambs. Semina: Ciências Agrárias, v. 36, n. 4, p. 2727-2738, 2015.
SABADINI, E. et al. Alterações da atividade de água e da cor da carne no processo de elaboração de carne salgada desidratada. Ciência e Tecnologia dos Alimentos, v. 21, n. 1, p. 14-19, 2001.
SIERRA, I. Producción de cordero joven y pesado en la raza. Raza Aragonesa. Instituto de Economia y Producciones
Ganadeiras del Ebro, 1973. 28 p.
TILYABAEV, K. Z. et al. Synthesis, structures, and acute toxicity of gossypol nonsymmetrical aldehyde derivatives. Russian Journal of Bioorganic Chemistry, v. 36, n. 3, p. 390-395, 2010.
ZUIN, R. G. et al. Genetic analysis on growth and carcass traits in Nelore cattle. Meat Science, v. 91, p. 352-357, 2012.