Assessment of the Bioaccessibility and Bioavailability of the
Phenolic Compounds of
Prunus avium L. by in Vitro Digestion and
Cell Model
Joana Gonçalves,
†Rodrigo Ramos,
†Ângelo Luís,
†Sandra Rocha,
†Tiago Rosado,
†,‡Eugenia Gallardo,
*
,†,‡and Ana Paula Duarte
†,‡†Centro de Investigação em Ciências da Saúde (CICS-UBI), Universidade da Beira Interior, Av. Infante D. Henrique, 6201-556
Covilhã, Portugal
‡Laboratório de Fármaco-Toxicologia, UBIMedical, Universidade da Beira Interior, EM506, 6201-556 Covilhã, Portugal
*
S Supporting InformationABSTRACT: The fruit of Prunus avium L., commonly known as sweet cherry, is an excellent source of phytochemicals, namely, phenolic compounds. This study aims to determine in vitro the bioavailability and the bioactivity of phenolic compounds present in cherries. Caco-2 cells were used, and the permeability and integrity of the monolayer formed were investigated. After incubation, the phenolic compounds that permeabilized the cell monolayer were quantified using a high-performance liquid chromatography−diode array detector, and the antioxidant activity was evaluated by the 1,1-diphenyl-2-picrylhydrazyl method. The results demonstrated that the phenolic compounds of sweet cherries after undergoing a simulated digestion were absorbed by the cellular barrier, becoming bioavailable. Contrary to what was found after incubation with the in vitro digested extract, the integrity of the cell monolayer was altered and its permeability increased upon incubation with the sweet cherry phenolic
extract. Regarding the antioxidant activity, it was verified that this decreased after the absorption by the cellular monolayer. This study suggests that digestion is an indispensable process for absorption because without it the phenolic content of the food matrix does not become bioaccessible.
■
INTRODUCTIONThe fruit of Prunus avium L., known as sweet cherry, belongs to the family Rosaceae, subfamily Prunoideae, and genus Prunus.1,2 Sweet cherry is an important culture, being most prevalent in temperate zones, particularly in Asia, Europe, North Africa, Australia, New Zealand, and the American continent.2,3 This fruit has a high nutritional value because it presents a high content of proteins, carbohydrates and water, low glycaemic index and fat content, presenting only 58 kcal/100 g of fresh fruit.2 In addition, sweet cherry is also a source of bioactive compounds, particularly phenolic compounds, including phenolic acids, flavonoids, and anthocyanins. These com-pounds are responsible for the characteristic red color of sweet cherries and also have beneficial biological effects.2,4,5
Phenolic compounds are the main secondary metabolites of plants, characterized by having at least one aromatic ring with one or more hydroxyl groups, which makes them structurally and functionally very diverse.1 They are essential for various functions in plants and are responsible for the organoleptic and nutritional properties of plant-derived foods.6
The consumption of sweet cherries has been associated with beneficial effects on human health, and therefore, it has been hypothesized that these are because of the bioactive
compounds already mentioned.5 Its antioxidant activity has been extensively studied in different trials. Studies have shown that the consumption of sweet cherries leads to a decrease in lipid peroxidation, inflammation, and oxidative stress.1,7−9 Other assays have shown that consumption of sweet cherries leads to an increase in anthocyanin levels, resulting in anticancer effects by inhibiting mutagenesis and inducing apoptosis.10 Epidemiological studies have also shown a negative correlation between individuals with chronic diseases and individuals with diets rich in fruits and vegetables with high amounts of polyphenols.11 However, for the phenolic compounds of sweet cherries to exert their antioxidant activity in the human body,first they have to become bioaccessible and bioavailable.
Bioavailability and bioaccessibility are often misunderstood concepts; although related, they have different definitions. Whereas bioaccessibility is the amount of a determined compound that is released from a matrix becoming available to be absorbed after undergoing the digestion process,
Received: January 8, 2019
Accepted: April 2, 2019
Published: April 26, 2019
Article http://pubs.acs.org/journal/acsodf
Cite This:ACS Omega 2019, 4, 7605−7613
Downloaded via 188.82.154.55 on April 26, 2019 at 13:56:07 (UTC).
bioavailability consists of the amount of a compound that reaches the systemic circulation and exerts its effect after being metabolized and distributed by tissues.12It is thus necessary to ensure that the components of interest of a food matrix are released and become available for absorption into the blood stream. Equally important is to know the various mechanisms by which these same components cross the epithelium and access the blood stream.12
In vitro digestion has been used to evaluate the quantity of compounds that become bioaccessible. Most of the models that use in vitro digestion simulate the digestive process in the mouth, stomach, small intestine, and in some cases intestinal fermentation, and so bioavailability studies can be performed in a more viable way.13,14 These procedures aim to simulate physiological conditions, considering factors such as digestive enzymes, pH, digestion time, and saline concentrations.14On the other side, the potential of bioaccesibility is mainly evaluated using cell lines, the most commonly used being Caco-2, which is derived from a human colon carcinoma.15 These cells are morphologically similar to the cells constituting the small intestine, because they present a brush border appearance on the apical face, expressing enzymes identical to those of the small intestine and also narrow intercellular junctions.16,17 This experimental model allows the simulta-neous study of the main transport mechanisms in the intestine.16,18
In this paper, we evaluate the impact of the bioavailability and bioaccessibility of the phenolic compounds from sweet cherries, in the antioxidant activity. For this purpose, the conditions under which the release of polyphenols from the food matrix and the absorption of these into the blood stream happen have been verified.
■
RESULTS AND DISCUSSIONPhenolic Profile of the Sample. In order to quantify the phenolic compounds present in the sample, an analytical method using high-performance liquid chromatography (HPLC)−diode array detector (DAD) was used. The analytical method developed was fully validated according to the guiding principles of the Food and Drug Administration.19 The calibration curve was established according to the linearity between 2 and 50 μg/mL. The correlation coefficients (r2) were found to be >0.996. The phenolic profile of the Saco cherry samples and the obtained concentrations are shown in
Table 1.
When analyzing the results, it was noticed that there is a lack of quercetin and cyanidin, which is compatible with the literature, although there is at least one study that identifies trace amounts of cyanidin.20On the other hand,
cyanidin-3-O-glycoside, quercetin-3,4′-di-O-glycoside, and rutin are the most abundant compounds.
In an article published by Serra et al.,20 the compounds epicatechin, chlorogenic acid, rutin, and cyanidin-3-O-glyco-side were studied for the Saco cultivar, among others. The comparison between the results obtained in the present work and the mentioned article is found inTable S1.
When compared to other sweet cherry cultivars, the results are very different. A study was conducted by Martini et al.,21 where the quantification of phenolic compounds in six cultivars of sweet cherries (Della Marca, Celeste, Bigarreau, Durone Nero, Lapins, and Moretta) allows the same comparison. It was possible to verify that the concentration of epicatechin present in the extracts of the cultivar Saco (1.507 mg/100 g fresh fruit) is much lower than in the other cultivars studied in that work (136.61−397.19 mg/100 g fresh fruit). Relative to the concentration of rutin (10.657 mg/100 g fresh fruit), the cultivars Della Marca and Celeste had lower concentrations (5.13 mg/100 g fresh fruit and 7.28 mg/100 g fresh fruit, respectively). On the contrary, the cultivars Bigarreau, Durone Nero, Lapins, and Moretta presented higher concentrations (46.02 mg/100 g fresh fruit, 47.44 mg/100 g fresh fruit, 51.97 mg/100 g fresh fruit, and 41.42 mg/100 g fresh fruit, respectively). Concerning cyanidin-3-O-glycoside (22.034 mg/100 g fresh fruit), there is also a great variation among the different cultivars. In the cultivars Della Marca, Celeste, and Lapins, the concentrations of that compound were lower (0.01 mg/100 g fresh fruit, 1.11 mg/100 g fresh fruit, and 13.24 mg/100 g fresh fruit, respectively). In contrast, the cultivars Bigarreau, Durone Nero, and Moretta presented concentrations much higher than those measured in the cultivar Saco (47.23 mg/100 g fresh fruit, 142.03 mg/100 g fresh fruit, and 37.78 mg/100 g fresh fruit, respectively).
Characterization of Phenolic Compounds after Digestive Process. The simulated digestive process was applied to cherry extracts of the Saco cultivar. Regarding the aliquots collected at the end of each step of the digestion, it was possible to visually distinguish them through color. These color changes can be explained by pH change (especially anthocyanins).
In the same aliquots, the phenolic content was determined using HPLC−DAD, and the results obtained are shown in
Table 1.
It is possible to observe that some of these phenolic compounds’ concentration, in particular, quercetin, gallic, or p-coumaric acids, increased during the procedure. This increase because of the conversion during the digestion to other compounds was previously mentioned. In the case of epicatechin, the amount increased greatly (approximately six Table 1. Concentration of the Sweet Cherry Phenolic Compounds in the Different Digestion Steps
initial concentration salivarya gastrica duodenala
quercetin not detected 1.02± 0.00 0.86± 0.00 1.46± 0.00
gallic acid 0.51± 0.01 0.11± 0.00 0.10± 0.01 0.18± 0.02 p-coumaric acid 2.28± 0.01 0.61± 0.02 0.51± 0.01 1.13± 0.01 rutin 10.66± 0.07 8.17± 0.10 7.55± 0.33 7.25± 0.06 chlorogenic acid 2.95± 0.10 1.18± 0.12 1.15± 0.17 1.25± 0.14 epicatechin 1.51± 0.15 0.36± 0.04 0.33± 0.05 2.12± 0.25 cyanidin-3-O-glycoside 22.03± 0.74 22.36± 0.74 24.12± 3.04 2.81± 0.33 quercetin-3-4′-di-O-glycoside 24.61± 0.42 25.73± 2.73 21.93± 0.39 11.80± 0.70
times) between the first (salivary digestion) and the last (duodenal digestion) digestive process.
Nevertheless, other concentrations of phenolic compounds decrease during the digestive process. Rutin, cyanidin-3-O-glycoside, and quercetin-3-4′-di-O-glycoside, whose binding between the glycoside and the compound is chemically more unstable, degrade during the digestive process. Thus, the conversion of these compounds into cyanidin and quercetin can be considered, although cyanidin concentrations are below the established lower limit of quantification (2 μg/mL), and conclusions cannot be drawn. However, with regard to quercetin, there is an increase in concentration. Regarding epicatechin, a considerable increase occurs during the intestinal phase, probably as a result of the conversion of other compounds to epicatechin, namely, tannins or procyanidins.
The results obtained were considered accurate, taking into consideration the analysis of the standard deviation and its coefficient of variation, always below 15%. As mentioned, the concentration/time evolution during each of the digestive phases is practically depreciable, reason why a quantification can be carried out only at the end of each digestive moment. Compared with existing literature, only one study involving a simulated digestive process was found to predict the bioavailability of the fruit of P. avium L.,22using a modification of the work of Gil-Izquierdo et al.23The authors of the work, through dialyzable membranes, photocolorimetric methods, and HPLC−DAD, evaluated the difference in compounds between the two sides of the membrane. However, the objective of the study was not to quantify the evolution of the concentrations during the digestive process, reason why it was not possible to make comparisons and to draw conclusions.
Cell Culture. Evaluation of the electrical resistance of the transendothelial membrane of Caco-2 cells. Initially, an assay was performed with 3-[4,5-dimethylthiazol-2-yl]-2,5-diphenyltetrazolium bromide (MTT) to evaluate the cytotox-icity of the crude and digested extracts after 6 h of incubation with cells. It was found that none of the extracts was toxic for the cell line Caco-2. These results are in agreement with those presented by Martini et al.,24where it was found that extracts of sweet cherries rich in phenolic compounds did not affect the proliferation of the Caco-2 cell line.
Then, the integrity of the monolayer of Caco-2 cells, before and after incubation with the extracts, was evaluated by the TEER assay (n = 4), and the results presented inTable 2were obtained.
On the basis of the initial measurements (t = 0 h), it was possible to confirm that the cell monolayer was intact before contact with the extracts. The values were above the minimum acceptable threshold (150−200 Ω cm2).24
After 6 h of cell incubation with the sweet cherry phenolic extract and digested extracts, a second TEER measurement was performed.
It was observed that after the cell incubation with the extracts, TEER values decreased, although they remained higher than 150−200 Ω cm2, and therefore, the whole cell monolayer could still be considered whole.25 It was also possible to observe that the phenolic extract, after 6 h of incubation, promoted a significant decrease in TEER values, suggesting that significant changes occurred in the conforma-tion of the membrane. It can further be seen that the digested extract did not significantly affect the same cells in the same time interval.
Studies suggest that the decrease in the TEER value in Caco-2 cells is related to an increase in ionic permeability across the plasma membrane or through the intracellular junctions caused by the target compound.26 There is evidence that some substances alter intracellular junctions, influencing the function of the intestinal barrier, resulting in increased permeability. This increase in permeability is reflected in a TEER decrease.27 Several times, the decrease in TEER values leads to the high concentration of a target compound.26However, in the present study, this does not apply because the concentration was the same for the phenolic and digested extracts, the latter not showing a significant decrease. Another reason commonly suggested for the decrease in this value is the high number of cell passages, because older cells tend to form multilayers.28 However, the cells used were between passages 30 and 34, considered relatively low. Also, the density of seeded cells can influence the TEER measurement as it interferes with proliferation capacity, not allowing minimal cell division.28 However, once again this is not valid for the present study, because the cell density used was the one recommended by the manufacturer.
This suggests that compounds present in the phenolic extract that did not undergo digestion interfere in the intercellular junctions. However, after the digestive process, these compounds are transformed into others that do not affect cell integrity.
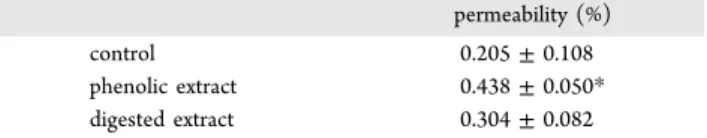
Evaluation of Endothelial Membrane Permeability. The permeability of the Caco-2 cell monolayer after incubation with the extracts was evaluated by the Lucifer Yellow permeability assay (Table 3).
The values obtained for the percentage of permeability of the cellular monolayer are less than 3%. It is possible to infer that the cell monolayer had an efficient and adequate permeability to the passage of the compounds to be analyzed, because these values are considered acceptable.29
It was found that there was a significant increase in the percentage of permeability of the cell monolayer after incubation with phenolic extract when compared to the control. The same was not observed for the digested extract after the same incubation time.
These results are consistent with those obtained previously for the TEER measurement. In fact, several studies describe Table 2. TEER Values Obtained before (t = 0) and after (t =
6) Incubation with the Extractsa
TEER (Ω cm2) at t = 0 h TEER (Ω cm2) at t = 6 h
control 645.56± 20.01 682.67± 197.49 phenolic extract 356.22± 35.72* 266.25± 50.33* digested extract 350.00± 65.94 256.00± 80.88
aThe values are expressed as mean ± SD considering statistically
significant values of p < 0.05 (*).
Table 3. Percentage of Permeability of Caco-2 Cells after 6 h of Incubation with the Cherry Extracts
permeability (%)
control 0.205± 0.108
phenolic extract 0.438± 0.050* digested extract 0.304± 0.082
aThe values are expressed as mean ± SD considering statistically
the significant increase in permeability in Caco-2 cells after incubation with different compounds, accompanied by a decrease in the TEER value.30,31This variation suggests that the function of the cellular barrier, as well as the intracellular spaces, and consequently their permeability, were altered after incubation.30−32
Taking this into consideration, there is the possibility of the phenolic extract inducing damage to the cell monolayer, interfering with its integrity and increasing its permeability. Regarding the digested extract, this does not occur, possibly because after digestion the compounds present herein underwent transformations into other smaller ones, which in turn were less susceptible to damage the integrity of the cellular monolayer.
Quantification of Phenolic Compounds after Digestion in Vitro and after Cell Incubation. The phenolic content of the aliquots collected after the incubation of digested extract with the cell cultures was quantified by HPLC−DAD (Table 4).
On the basis of the obtained results for this assay, it is possible to verify that gallic and chlorogenic acids are the main phenolic compounds, present in the digested extract, crossing through the cellular monolayer. Its concentration gradually increases in the basolateral compartment until 4 h of incubation, remaining constant between 4 and 6 h in contact with the cells.
Regarding quercetin-3,4′-di-O-glycoside, and cyanidin-3-O-glycoside, present in the same extract, it is possible to verify that they accumulate more sharply in the basolateral chamber during the first hour of incubation. After this period, its concentration continues to increase, but gradually. At the end of 6 h incubation, there is a slight decrease in the amount of these two phenolic compounds.
Regarding rutin, during thefirst hour of incubation, it is not detected; however, from that moment and until 4 h, a progressive increase in the concentration is observed in the basolateral compartment, however, remaining until 6 h of incubation.
Epicatechin and p-coumaric acid present in the digested extract seem to cross the cellular monolayer in smaller amounts. Nevertheless, although p-coumaric acid remains constant throughout the incubation process, epicatechin is detected only after 6 h of the same process.
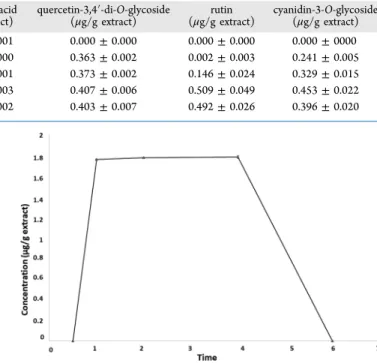
On the contrary, during the incubation with the phenolic extract, only quercetin-3,4′-di-O-glycoside was able to cross the cell monolayer. It was possible to observe a substantial increase in the concentration of the same compound in the basolateral chamber after 1 h of incubation. This concentration remained constant until 4 h of the same process and then decreased to the initial concentration (Figure 1). These results suggest that the digestion is an important step for the absorption of the phenolic compounds, because without digestion, the phenolics do not become bioaccessible from the food matrix.
In addition to the compounds that have been reported, quercetin and cyanidin were also not detected initially by HPLC−DAD. However, after cell incubation of the phenolic extract and the digested extract, the absence of the same was verified. Overall, it is possible to verify that, with the exception of quercetin and cyanidin, the phenolic compounds present in the digested extract were able to cross the cell monolayer, being present in the aliquots collected from the basolateral chamber. The same did not occur in the phenolic extract, because only quercetin-3,4′-di-O-glycoside was detected in these aliquots. The compounds of this extract cannot cross the cell monolayer. These results were compared with those obtained in other studies. However, it is important to note the limited literature with similar evaluations, and no bioavail-ability assay of P. avium L. fruit was evaluated in Caco-2 cell cultures.
It was possible to verify that all the compounds decreased after passing through the cell monolayer, when comparing the results obtained after the digestion and after cell incubation. Moreover, the most abundant compounds differ according to the treatment. After digestion, quercetin-3,4′-di-O-glycoside, cyanidin-3-O-glycoside and rutin prevail, whereas chlorogenic and gallic acids are more abundant following incubation, as previously verified. In both cases, cyanidin was not detected. In a study developed by Rubió et al.33
the effect of in vitro digestion on the bioaccessibility of phenolic compounds present in thyme-flavored olive oil, using Caco-2 and HepG-2 cell models, was evaluated. The results indicated that the bioaccessibility of the compounds increased when the extracts were digested. An increase in the passage offlavonoids by the cell barrier was also observed after digestion. These results are in agreement with those obtained in the present work, because there was also an increase in the passage of the compounds by the cellular monolayer during the digestion of the extract. In Table 4. Concentration of the Phenolic Compounds in the Aliquots Collected after the Different Incubation Times with the Digested Extract (Meanμg/g Extract) ± SD
time (h)
gallic acid
(μg/g extract) (μg/g extract)epicatechin chlorogenic acid(μg/g extract) p-coumaric acid(μg/g extract) quercetin-3,4′-di-O-glycoside(μg/g extract) (μg/g extract)rutin cyanidin-3-O-glycoside(μg/g extract) 0,5 0.067± 0.005 0.000± 0.000 0.258± 0.072 0.116± 0.001 0.000± 0.000 0.000± 0.000 0.000± 0000 1 0.080± 0.003 0.000± 0.000 0.385± 0.080 0.116± 0.000 0.363± 0.002 0.002± 0.003 0.241± 0.005 2 1.454± 0.096 0.000± 0.000 1.312± 0.151 0.122± 0.001 0.373± 0.002 0.146± 0.024 0.329± 0.015 4 1.793± 0.038 0.000± 0.000 3.499± 0.248 0.137± 0.003 0.407± 0.006 0.509± 0.049 0.453± 0.022 6 1.749± 0.021 0.335± 0.025 3.241± 0.414 0.133± 0.002 0.403± 0.007 0.492± 0.026 0.396± 0.020
Figure 1. Concentration of quercetin-3,4′-di-O-glycoside in the aliquots collected after the different incubation times.
contrast, the non-digested compounds (phenolic extract) had a much lower absorption rate.
Another study developed by Toydemir et al.34evaluated the bioavailability of epicatechin and cyanidin-3-O-glycoside in acid cherry (Prunus cerasus L.) and its juice, using cell incubation with Caco-2 cells and subsequent quantification by HPLC−FLD. These authors verified that after the passage by the cell monolayer, of both juice and fruit, the concentration of the target compounds was lower. This corroborates the previous comparison, because the same decrease was verified. Still in another work published by Fazzari et al.,22an in vitro digestion in extracts of different cultivars of cherries was simulated, and a dialysis membrane was used to simulate the intestinal wall. One side of the membrane was given the name “accessible to the serum” and the other “accessible to the colon”. It was found that the percentage of phenolic compounds passing through the membrane and traveling to the “serum accessible” side was much lower than on the opposite side. Again, these results are in agreement with the above, which leads to believe that phenolic compounds can cross the cell monolayer that simulates the intestinal epithelium. However, during this process, some of these substances are lost or cannot cross the aforementioned monolayer, reflecting these compounds in a smaller amount in the compartment that simulates the access to the blood stream.
Evaluation of the Antioxidant Activity of the Extracts after Digestion in Vitro and after Cell Incubation. The analysis of the antioxidant activity of the extracts after each in vitro digestion step and of the aliquots collected after the incubation of the phenolic and digested extracts was performed by 1,1-diphenyl-2-picrylhydrazyl (DPPH) assay (Table 5).
On the basis of the results obtained, it was verified that the antioxidant activity is maximum in the fruit extract of P. avium L. before it undergoes any digestion process, decreasing to approximately half after salivary digestion. In gastric digestion, there is a new increase in the percentage of inhibition of DPPH, and consequently of antioxidant activity, which decreases slightly in duodenal digestion. In contrast, all aliquots collected after incubation of the extracts with the cell culture, regardless of the elapsed time, did not demonstrate antioxidant activity.
The results concerning the antioxidant activity obtained for the aliquots collected during the digestive process can be explained by the variation of the phenolic content during in vitro digestion observed previously. Concerning the evaluated polyphenols, quercetin-3,4′-di-O-glycoside and cyanidin-3-O-glycoside remained constant during salivary and gastric digestion, and decreased only during duodenal digestion. In contrast, p-coumaric acid increased during duodenal digestion. Rutin, gallic, and chlorogenic acids remained constant during all digestion process. The concentration of quercetin increased
in the duodenal digestion because of the cleavage of the O-glycoside moiety.
These results are in agreement with those obtained by Fazzari et al.22and Toydemir et al.34As mentioned previously, the phenolic concentration after passage through the cell monolayer decreases substantially, so the antioxidant activity in these aliquots will also be lower, reflected in a smaller, or in this case nonexistent, percentage of inhibition of the DPPH radical.
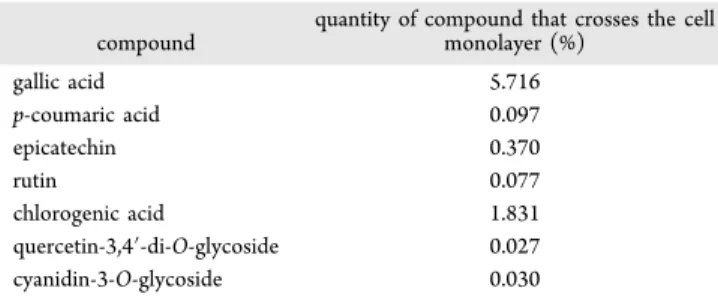
The percentage of each compound passing through the cell monolayer was also determined, based on the relative values of the concentration of each compound in the phenolic extract (Table 6).
It is possible to observe that only a very small percentage of each compound crosses the cell monolayer and becomes bioavailable. As expected, the less-absorbed compounds were the glycosides (rutin, quercetin-3,4′-di-O-glycoside, and cyanidin-3-O-glycoside), possibly because of their size. The gallic and chlorogenic acids were the most transported. Again, these results corroborate those verified in the measurement of the antioxidant activity, justifying the difference of values obtained before and after the incubation of the extracts with the cellular monolayer.
■
CONCLUSIONSOverall, the content of phenolic compounds remains unchanged during the digestive process, with the exception of glycosides, which undergo a significant transformation. After the simulated digestion process, the polyphenols detected and identified in the extracts of cherries were able to be absorbed by the cell barrier, becoming bioavailable. However, these same compounds were present in very small concentrations, not demonstrating any antioxidant activity. The same had not occurred before passage through the cell monolayer.
Conversely, when the same cherry extract not subjected to digestion was placed in contact with the same cell layer, only quercetin-3,4′-di-O-glycoside was able to cross and become bioavailable. Therefore, digestion is an indispensable process for the absorption to take place, and without it, the phenolic content of the food matrix does not become bioaccessible.
The present work also allowed the verification that after cellular incubation with the phenolic extract, the integrity of the cellular monolayer was modified and its permeability increased. The same was not verified after incubation with the extract that underwent the digestive process. This suggests that the compounds that interfere with the intercellular junctions present in the crude extract, after the digestive process, Table 5. Antioxidant Activity of the Extracts after the
Various Digestion Steps (Mean± SD)
sample % inhibition
phenolic extract 83.18± 0.21 salivary digestion extract 41.28± 0.47 gastric digestion extract 72.40± 0.03 duodenal digestion extract 63.23± 0.01
Table 6. Percentage of Each Compound, Present in Digestive Extract, That Crosses the Cell Monolayer Relative to the Initial Composition of the Extract
compound
quantity of compound that crosses the cell monolayer (%) gallic acid 5.716 p-coumaric acid 0.097 epicatechin 0.370 rutin 0.077 chlorogenic acid 1.831 quercetin-3,4′-di-O-glycoside 0.027 cyanidin-3-O-glycoside 0.030
undergo modifications, being transformed into smaller ones, which in turn fail to affect cellular integrity and permeability.
However, the present work is only an in vitro test, and therefore, all conclusions should be considered with caution. Thus, future investigations are required, namely, using cellular cocultures, of this and another cell line, so that a more realistic approximation of the intestinal epithelium is possible and tofill itsflaws and disadvantages. Subsequently, in vivo assays should also be performed in order to confirm the results previously obtained.
■
MATERIALS AND METHODSChemicals and Materials. The analytical standards cyanidin, quercetin-3,4′-di-O-glycoside, and cyanidin-3-O-glycoside were purchased from Extrasynthese (Genay Cedex, France). The remaining standards, namely, quercetin, gallic acid, p-coumaric acid, rutin, epicatechin, and chlorogenic acid, were obtained from Sigma-Aldrich (Sintra, Portugal). DPPH and Lucifer Yellow were also obtained from Sigma-Aldrich (Sintra, Portugal).
The mobile phase and remaining solutions were prepared with acetonitrile and methanol (HPLC grade) from Laborspirit (Lisbon, Portugal) and Fischer Chemical (Loughborough, UK), respectively. Trifluoracetic acid and hydrochloric acid were purchased from Sigma-Aldrich (Sintra, Portugal). Deionized water was obtained from a Milli-Q System (Millipore, Billerica, MA, USA).
Stock and Working Solutions. Individual stock solutions of the analytes (for HPLC analyses) were prepared at 1 mg/ mL in methanol. The phenolic extract was prepared at 0.12 g/ mL in Roswell Park Memorial Institute (RPMI) medium (purchased from Sigma-Aldrich, Sintra, Portugal). Working solutions were prepared with serial dilutions in methanol. All solutions were stored at temperatures recommended by the manufacturer and protected from light.
Cherry Fruit Samples. In the present work, the studied cultivar was Saco, typical from the region of Fundão (Portugal). These cherry samples were kindly offered by Cerfundãopackagers and marketers of cherries from Cova da Beira, Lda. The cherries were processed immediately after harvest.
Preparation of Cherry Samples. 200 g of fresh cherry were weighed and frozen at−80° C for 24 h. A lyophilization process was then carried out for 60 h using a system Savant Novalyphe-NL500 (Holbrook, USA). Starting from the lyophilized fruit, an extraction process was carried out directed to the phenolic compounds. Acidified methanol with 0.1% HCl was used, using a ratio of 1 g of lyophilized fruit to 20 mL of solvent. The sample was placed in a thermostatic bath for 2 h at a temperature of 35° C and shaking at 64 rpm. This extraction process was repeated twice. Subsequently, the extract was centrifuged for 20 min at 4000 rpm. The solvent was further evaporated, under reduced pressure (130 mbar) and temperature of 35° C. The obtained extract was preserved at 4° C and protected from light until its use. The samples of cherry were lyophilized, after which they were diluted with acidified methanol with 0.1% HCl. Different dilution factors were studied in order not to saturate the signal of the studied compounds (1:25; 1:12,5; 1:6.25, and 1:3.125). The most appropriate dilution factor (1:6.25) was also selected for the posterior characterization of the extracts.
In Vitro Simulation of Human Digestion Process. The in vitro digestion assay followed a previously described
methodology; however, some modifications were applied.13,14 Briefly, the salivary fluid had in its constitution potassium chloride, monosodium phosphate, sodium sulfate, sodium chloride, sodium bicarbonate, urea,α-amylase, mucin, and uric acid. The gastric fluid consisted of sodium chloride, monosodium phosphate, potassium chloride, calcium chloride, ammonium chloride, hydrochloric acid, glucose, urea, pepsin, mucin, and bovine serum albumin. The duodenal fluid consisted of a mixture of sodium chloride, sodium bicarbonate, potassium dihydrogen phosphate, potassium chloride, magne-sium chloride, hydrochloric acid, urea, calcium chloride dihydrate, bovine serum albumin, pancreatin, and lipase. Finally, the bilefluid had in its composition sodium chloride, sodium bicarbonate, potassium chloride, hydrochloric acid, urea, calcium chloride dihydrate, bile, and bovine serum albumin. For the assay, 1 g of cherry extract was dissolved in 10 mL deionized water; then, 6 mL simulated salivary fluid (pH 6.8) was added. The solution was incubated at 37°C for 5 min while orbital shaking at 90 rpm. The next step of the assay was performed by adding 12 mL simulated gastric fluid (pH 1.3) followed by an incubation period of 2 h at 37 °C. Subsequently, 12 mL simulated duodenal fluid (pH 8.1), with 6 mL simulated biliaryfluid (pH 8.2) and 2 mL sodium bicarbonate solution (1 M), was added, maintaining the same temperature and shaking for 2 h. Aliquots were collected at the end of each digestive step. In the entire digestive process, the pH was measured, being the physiologic value maintained. Also, a pH gradient was maintained between the apical and basal side (6.5 apical, 7.5 basal) in order to achieve the transport of cyanidins and other phenolics. Prior to the HPLC analysis, these aliquots were sonicated at 4°C in an ice bath for 30 min. Subsequently, they were centrifuged for 10 min at 10 000 rpm to facilitate the separation of the components and purification of the sample. Afterward, the supernatant was collected andfiltered on a 0.22 μm cellulose acetate pore filter and then quantified, with measurement of antioxidant activity and cell incubation.
It is also important to mention that in this work a parallel artificial membrane permeability assay test was performed, which is the most correct and similar way to mimic what happens physiologically.
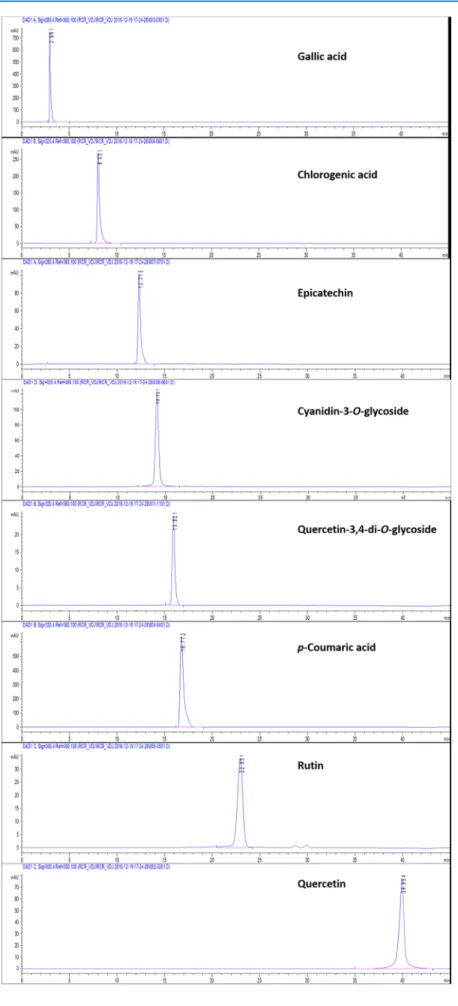
Instrumental and Chromatographic Conditions. The quantification of the phenolic compounds was performed on an HPLC system 1290 with a binary pump coupled to DAD from Agilent technologies (Soqui ́mica, Lisboa, Portugal). The compounds were separated with an Eclipse Plus C18 (3.5μm, 4.6 × 100 mm) analytical column from Agilent Technologies (Soqui ́mica, Lisboa, Portugal). Gallic acid and epicatechin were detected at 280 nm; quercetin-3,4′-di-O-glycoside, p-coumaric, and chlorogenic acids at 320 nm; rutin and quercetin at 360 nm; and cyanidin and cyanidin-3-O-glycoside at 520 nm (Figure 2). The mobile phase was composed of 0.1% trifluoroacetic acid in water (A) and acetonitrile (B). A gradient elution system was applied at a flow rate of 0.5 mL/ min. The gradient elution process included 10% A (0−3 min), 15% A (3−15 min), 15% A (15−20 min), 18% A (20−25 min), andfinally 30% (25−40 min). The injection volume was 20 μL. The column and sampler temperatures were set to 35 and 4°C, respectively.
DPPH-Free Radical Scavenging Assay. The method used to evaluate the antioxidant activity was DPPH assay and followed a methodology previously described.35 In this assay, 100 μL of each sample (digested fractions, aliquot cell
incubation, and phenolic extract) was added to 3.9 mL of a 0.1 mM DPPH methanolic solution. A blank (methanol only) and a control (100 μL methanol +3.9 mL DPPH) were also prepared.
The samples were shaken and kept in the dark at room temperature for 15 min. After this time, the absorbances were measured at 517 nm, using an UV−vis spectrophotometer (Helios Omega, Thermo Scientific, USA). The assays were performed in duplicate, and the percentage of inhibition of DPPH-free radical by the samples (% inhibition) was determined using the following equation:
= − ×
% inhibition absorbance of control absorbance of sample absorbance of control 100
(1) Cell Culture. Caco-2 cell line was cultured in RPMI medium supplemented with 10% FBS and 1% mixture of antibiotics and subsequently incubated at 37 °C in a humidified atmosphere containing 5% CO2. The cells were seeded onto a culture insert at a cell density of 6× 10⁴cells. Cells were used for the experiment with passages between 30 and 34 and after a 21-day period to form the confluent monolayer. The volume of the culture medium was 0.5 mL in the apical chamber and 1.5 mL in the basolateral chamber, and it was changed every 48 h.
After 21 days, 500 μL of phenolic extract and digested extract were placed in contact with the cell monolayer in the apical chamber. After 0.5, 1, 2, 4, and 6 h, aliquots of 250μL were collected in the basolateral chamber. The collected aliquots were used for quantification of the phenolic compounds by HPLC and for evaluation of the antioxidant activity. All assays were done in quadruplicate.
MTT Cell Viability Assay. In order to determine the cytotoxic effects of the extracts in the Caco-2 cell line, the cell viability was assessed by the MTT assay after 6 h of incubation. The procedure is similar to that used by our research group.36 A Bio-Rad xMark microplate reader spectrophotometer was used, and the absorbance was read at 570 nm. Each experiment was performed in quadruplicate, using a control consisting of untreated cells.
TEER Assay. The transepithelial electrical resistance (TEER) was used to monitor the integrity of the cell layer and the alterations of the tight junctions. Before and after the bioavailability studies, TEER was measured in each well, using a transepithelial resistance meter (EVOM2). The electrode was placed in a tube with culture medium for equilibration. Only then the TEER measurement began by placing the electrode into each well. The shortest part remained in the apical chamber, whereas the longest in the basolateral chamber, making an angle of approximately 90°. This procedure was repeated in triplicate throughout the 12-well culture plate, and the TEER was determined using the following equation
=
− ×
TEER value (mean of the resistances of each well
mean resistances of blank) insert area
(2) Lucifer Yellow Permeability Assay. The evaluation of the permeability characteristics of the cells can be performed by measuring passive passage of different molecules through the monolayer. The passage of compounds, such as Lucifer Yellow, through the tight junctions was also used to check the integrity of the barrier and to determine whether a test compound disrupts the integrity of the monolayer by
increasing permeability. In this work, the Lucifer Yellow assay was performed after bioavailability studies. For this, the medium was removed into both chambers bounded by the insert. 500μL of the Lucifer Yellow solution was placed in the apical chamber and 1.5 mL of the HBSS (Hank’ balanced salt solution) buffer in the basolateral chamber. The culture plate was incubated for 1 h, and after that time, 200 μL of each basolateral chamber was pipetted into another 96-well culture plate. A blank (only with HBSS buffer) and a positive (Lucifer Yellow 0.1 mg/mL) control were added to the same plate. Fluorescence was measured at 485 nm (excitation) and 535 nm (emission) using a spectrofluorimeter.
The percentage of permeability was calculated based on the following equation
=
−
− ×
% permeability
mean of fluorescence of each well fluorescence of blank fluorescence of positive control fluorescence of blank 100
(3) Statistical Analysis. The results are expressed as mean values with standard deviations (SD). The values represented were obtained by t-Student test considering statistically significant values of p < 0.05 (*).
■
ASSOCIATED CONTENT*
S Supporting InformationThe Supporting Information is available free of charge on the
ACS Publications website at DOI: 10.1021/acsome-ga.8b03499.
A table (Table S1) presenting a comparison between our method and others published in the literature is provided (PDF)
■
AUTHOR INFORMATION Corresponding Author*E-mail: [email protected]. Phone. +351275329002. Fax +351275329099.
ORCID
Eugenia Gallardo: 0000-0002-1802-8998 Notes
The authors declare no competingfinancial interest.
■
ACKNOWLEDGMENTSThis work was partially supported by FEDER funds through the POCI-COMPETE 2020-Operational Program Compet-itiveness and Internationalization in Axis I-Strengthening research, technological development, and innovation (Project POCI-01-0145- FEDER-007491) and National Funds by FCT-Foundation for Science and Technology (Project UID/ Multi/00709/2013).
■
ABBREVIATIONSDPPH, 1,1-diphenyl-2-picrylhydrazyl; HBSS, Hanks’ balanced salt solution; HPLC, high-performance liquid chromatography; HPLC−DAD, high-performance liquid chromatography with diode array detector; HPLC−FLD, high-performance liquid chromatography with fluorescence detector; RPMI, Roswell Park Memorial Institute 1640 Medium; TEER, transepithelial electrical resistance
■
REFERENCES(1) Ferretti, G.; Bacchetti, T.; Belleggia, A.; Neri, D. Cherry Antioxidants: From Farm to Table. Molecules 2010, 15, 6993−7005. (2) Bastos, C.; et al. Chemical characterisation and bioactive properties of Prunus avium L.: The widely studied fruits and the unexplored stems. Food Chem. 2015, 173, 1045−1053.
(3) Commisso, M.; et al. Multi-approach metabolomics analysis and artificial simplified phytocomplexes reveal cultivar-dependent synergy between polyphenols and ascorbic acid in fruits of the sweet cherry (Prunus avium L.). PLoS One 2017, 12, No. e0180889.
(4) Wang, M.; Jiang, N.; Wang, Y.; Jiang, D.; Feng, X. Characterization of Phenolic Compounds from Early and Late Ripening Sweet Cherries and Their Antioxidant and Antifungal Activities. J. Agric. Food Chem. 2017, 65, 5413−5420.
(5) Mikulic-Petkovsek, M.; Stampar, F.; Veberic, R.; Sircelj, H. Wild Prunus Fruit Species as a Rich Source of Bioactive Compounds. J. Food Sci. 2016, 81, C1928−C1937.
(6) Somoza, V.; Molyneux, R. J.; Chen, Z.-Y.; Tomás-Barberán, F.; Hofmann, T. Guidelines for Research on Bioactive Constituents− A Journal of Agricultural and Food Chemistry Perspective. J. Agric. Food Chem. 2015, 63, 8103−8105.
(7) Kelley, D. S.; Rasooly, R.; Jacob, R. A.; Kader, A. A.; Mackey, B. E. Consumption of Bing Sweet Cherries Lowers Circulating Concentrations of Inflammation Markers in Healthy Men and Women. J. Nutr. 2006, 136, 981−986.
(8) Šarić, A.; et al. Improved Antioxidant and Anti-inflammatory Potential in Mice Consuming Sour Cherry Juice (Prunus Cerasus cv. Maraska). Plant Foods Hum. Nutr. 2009, 64, 231−237.
(9) Mulabagal, V.; Lang, G. A.; DeWitt, D. L.; Dalavoy, S. S.; Nair, M. G. Anthocyanin Content, Lipid Peroxidation and Cyclooxygenase Enzyme Inhibitory Activities of Sweet and Sour Cherries. J. Agric. Food Chem. 2009, 57, 1239−1246.
(10) Wang, L.-S.; Stoner, G. D. Anthocyanins and their role in cancer prevention. Cancer Lett. 2008, 269, 281−290.
(11) Lin, J.-Y.; Tang, C.-Y. Determination of total phenolic and flavonoid contents in selected fruits and vegetables, as well as their stimulatory effects on mouse splenocyte proliferation. Food Chem. 2007, 101, 140−147.
(12) Carbonell-Capella, J. M.; Buniowska, M.; Barba, F. J.; Esteve, M. J.; Frígola, A. Analytical Methods for Determining Bioavailability and Bioaccessibility of Bioactive Compounds from Fruits and Vegetables: A Review. Compr. Rev. Food Sci. Food Saf. 2014, 13, 155−171.
(13) Versantvoort, C. H. M.; Oomen, A. G.; Van de Kamp, E.; Rompelberg, C. J. M.; Sips, A. J. A. M. Applicability of an in vitro digestion model in assessing the bioaccessibility of mycotoxins from food. Food Chem. Toxicol. 2005, 43, 31−40.
(14) Minekus, M.; et al. A standardised static in vitro digestion method suitable for food− an international consensus. Food Funct. 2014, 5, 1113−1124.
(15) Sambuy, Y.; et al. The Caco-2 cell line as a model of the intestinal barrier: influence of cell and culture-related factors on Caco-2 cell functional characteristics. Cell Biol. Toxicol. Caco-2005, Caco-21, 1−Caco-26.
(16) Barthe, L.; Woodley, J.; Houin, G. Gastrointestinal absorption of drugs: methods and studies. Fundam. Clin. Pharmacol. 1999, 13, 154−168.
(17) Kosińska-Cagnazzo, A.; Diering, S.; Prim, D.; Andlauer, W. Identification of bioaccessible and uptaken phenolic compounds from strawberry fruits in in vitro digestion/Caco-2 absorption model. Food Chem. 2015, 170, 288−294.
(18) Devkar, S. T.; et al. Evaluation of the bioavailability of major withanolides of Withania somnifera using an in vitro absorption model system. J. Adv. Pharm. Technol. Res. 2015, 6, 159−164.
(19) Food and Drug Administration, Bioanalytical Method Validation Guidance for Industry, 2018.http://www.fda.gov/Drugs/ GuidanceComplianceRegulatoryInformation/Guidances/default.htm (accessed March 5, 2018).
(20) Serra, A. T.; Duarte, R. O.; Bronze, M. R.; Duarte, C. M. M. Identification of bioactive response in traditional cherries from Portugal. Food Chem 2011, 125, 318−325.
(21) Martini, S.; Conte, A.; Tagliazucchi, D. Phenolic compounds profile and antioxidant properties of six sweet cherry ( Prunus avium ) cultivars. Food Res. Int. 2017, 97, 15−26.
(22) Fazzari, M.; et al. In Vitro Bioavailability of Phenolic Compounds from Five Cultivars of Frozen Sweet Cherries (Prunus aviumL.). J. Agric. Food Chem. 2008, 56, 3561−3568.
(23) Gil-Izquierdo, A.; Zafrilla, P.; Tomás-Barberán, F. A. An in vitro method to simulate phenolic compound release from the food matrix in the gastrointestinal tract. Eur. Food Res. Technol. 2002, 214, 155− 159.
(24) Martini, S.; Conte, A.; Tagliazucchi, D. Bioactivity and cell metabolism of in vitro digested sweet cherry (Prunus avium) phenolic compounds. Int. J. Food Sci. Nutr. 2018, 70, 335.
(25) Hellinger, É.; et al. Comparison of brain capillary endothelial cell-based and epithelial (MDCK-MDR1, Caco-2, and VB-Caco-2) cell-based surrogate blood−brain barrier penetration models. Eur. J. Pharm. Biopharm. 2012, 82, 340−351.
(26) Narai, A.; Arai, S.; Shimizu, M. Rapid decrease in transepithelial electrical resistance of human intestinal Caco-2 cell monolayers by cytotoxic membrane perturbents. Toxicol. In Vitro 1997, 11, 347−354. (27) Lu, Y.; et al. Sijunzi Decoction attenuates 2, 4, 6-trinitrobenzene sulfonic acid (TNBS)-induced colitis in rats and ameliorates TNBS-induced claudin-2 damage via NF-κB pathway in Caco2 cells. BMC Complementary Altern. Med. 2017, 17, 35.
(28) Lea, T. The Impact of Food Bioactives on Health; Springer International Publishing, 2015; Vol. 95−102.
(29) Piazzini, V.; et al. Prediction of Permeation and Cellular Transport of Silybum marianum Extract Formulated in a Nano-emulsion by Using PAMPA and Caco-2 Cell Models. Planta Med. 2017, 83, 1184−1193.
(30) Satsu, H.; Yokoyama, T.; Ogawa, N.; Fujiwara-Hatano, Y.; Shimizu, M. The changes in the neuronal PC12 and the intestinal epithelial Caco-2 cells during the coculture. The functional analysis using an in vitro coculture system. Cytotechnology 2001, 35, 73−79.
(31) Piccolino, M.; Neyton, J.; Gerschenfeld, H. Decrease of gap junction permeability induced by dopamine and cyclic adenosine 3’:5’-monophosphate in horizontal cells of turtle retina. J. Neurosci. 1984, 4, 2477−2488.
(32) Cui, W.; et al. Tumor necrosis factor alpha increases epithelial barrier permeability by disrupting tight junctions in Caco-2 cells. Braz. J. Med. Biol. Res. 2010, 43, 330−337.
(33) Rubió, L.; et al. Effect of the co-occurring olive oil and thyme extracts on the phenolic bioaccesibility and bioavailability assessed by in vitro digestion and cell models. Food Chem. 2014, 149, 277−284. (34) Toydemir, G.; et al. Investigating the Transport Dynamics of Anthocyanins from Unprocessed Fruit and Processed Fruit Juice from Sour Cherry ( Prunus cerasus L.) across Intestinal Epithelial Cells. J. Agric. Food Chem. 2013, 61, 11434−11441.
(35) Luís, Â.; Duarte, A. P.; Pereira, L.; Domingues, F. Interactions between the major bioactive polyphenols of berries: effects on antioxidant properties. Eur. Food Res. Technol. 2018, 244, 175−185.
(36) Martinho, A.; M. Silva, S.; Gallardo, E. Cytotoxic effects of salvinorin A, A major constituent of Salvia divinorum. Med. Chem. 2016, 12, 432.