UNIVERSIDADE DA BEIRA INTERIOR
Ciências
Signaling Pathways Involved in the modulation of
microglial reactivity by the action of GDNF
Paulo Ricardo Medeiros Garcia
Tese para obtenção do Grau de Mestre em
Bioquímica
(2º ciclo de estudos)
Orientador: Prof. Doutora Graça Baltazar
Co-orientador: Prof. Doutora Carla Fonseca
Dedicatória
Dedico esta tese aos meus pais, por todo o apoio, coragem, pela fé que depositaram em mim e por todos os ensinamentos que formaram os alicerces do meu conhecimento. À minha irmã, pelo carinho, paciência e também por toda a confiança, que sempre teve em mim. Espero que este trabalho os faça orgulhosos de mim.
Agradecimentos
Esta tese não estaria completa sem um agradecimento a todas as pessoas que me ajudaram a tornar isto possível. Primeiramente, gostaria de agradecer à minha orientadora, Professora Doutora Graça Baltazar, pelo seu apoio, orientação, espírito crítico demonstrado ao longo de todo o projeto. Agradecendo, também, o seu ânimo e a sua disponibilidade.
O meu muito obrigado à Professora Doutora Carla Fonseca, pelo incentivo transmitido ao longo da investigação e pela a disponibilidade que sempre teve para comigo.
Um agradecimento especial à Sandra Rocha, pela sua orientação, ao longo deste trabalho e, por todos os seus ensinamentos, cruciais. O meu muito obrigado, às minhas colegas de laboratório, Diana Rodrigues e Susana Gama pela companhia e apoio. Também por tornarem aquelas horas mais monótonas, em algo mais divertido. Foi bom poder trabalhar com vocês.
Um muito obrigado (daqueles bem grandes) a todos os meus amigos, que fiz nesta linda cidade, à Andréa Silva, Cleide Rodrigues, Estela Caldeira, Eunice Pombo, Joana Monteiro, Renato Domingos, Sandra Sousa, Sara Pinheiro e Sónia Almeida, a todos eles o meu muito obrigado; pelo apoio, amizade, por se tornarem a minha segunda família. Uma família que faço questão de guardar para a vida. Muito Obrigado por me terem proporcionado seis anos maravilhosos.
Ao meu primo Miguel, pela paciência, por todos os artigos que me arranjou e pela disponibilidade em ler a minha tese. O meu muito obrigado.
Finalmente, gostaria de agradecer à minha família, por todo o seu amor e apoio. Mãe, Pai e Rafaela não teria conseguido sem vocês, por isso a minha gratidão. Um muito obrigado à minha madrinha e primas pelas vossas palavras de incentivo. A todos, o meu muito obrigado.
Resumo
Os processos inflamatórios, que ocorrem no sistema nervoso central (SNC), mediados pela activação das células da glia desempenham um papel importante na morte neuronal e estão associados ao desenvolvimento de doenças neurodegenerativas, como a doença de Parkinson (DP).
As células da microglia são células do sistema imunitário inato residentes no SNC e constituem a primeira linha de defesa quando ocorre um dano ou mesmo uma doença. Uma lesão no SNC promove a rápida activação da microglia. Por sua vez a microglia contribui para o processo neurodegenerativo através da libertação de uma variedade de factores neurotóxicos (citocinas pró-inflamatórias, espécies reactivas de oxigénio e nitrogénio) que promovem a degeneração dos neurónios. Contudo, o processo inflamatório, quando não exacerbado, é benéfico por contribuir para a libertação de factores neurotróficos, que contrariam o dano neuronal.
O factor neurotrófico derivado de células da glia (GDNF) é um potente factor que promove a sobrevivência de diferentes populações neuronais, em diferentes regiões do cérebro e com grande potencial terapêutico para a DP. Apesar do seu efeito na microglia estar pouco estudado, existem alguns resultados que indicam que o GDNF é capaz de regular a actividade destas células.
Trabalhos anteriores do nosso laboratório (Rocha et al. 2011) demonstraram que o GDNF secretado pelos astrócitos tem a capacidade de impedir a activação microglial induzida pelo Zymosan A, um polissacarídeo extraído da parede de leveduras e que actua via receptores Toll-like receptor 2 (TLR2). Com este trabalho pretendemos aprofundar este efeito tentando esclarecer quais as vias de sinalização usadas pelo GDNF para modular a activação microglial e assim regular a neuroinflamação. Para a determinação do efeito do GDNF na actividade da microglia, culturas primárias de microglia foram previamente expostas ao meio condicionado de astrócitos (MCA, no qual está presente GDNF secretado pelos astrócitos), posteriormente, estimuladas com Zymosan A ou com LPS. A actividade da microglia foi quantificada através da produção de espécies reactivas de oxigénio, de óxido nitríco ou por determinação da actividade fagocítica. O objectivo inicial deste trabalho era o de determinar as vias de transdução de sinal usadas pelo GDNF para regular a actividade da microglia. Contudo, as primeiras experiências realizadas mostraram uma inesperada falta de resposta da cultura de microglia aos agentes inflamatórios LPS e Zymosan A, quando a reactividade foi analisada através da produção de ROS por uma técnica fluorimétrica que mede as ROS produzidas por uma população de células. Esta falta de resposta deve-se provavelmente ao facto de os sinais na população total serem baixos e de a técnica usada para detectar essas alterações ser pouco sensível.
Quando a reactividade microglial induzida pelos agentes inflamatórios foi analisada por medição da actividade fagocítica da microglia, através de uma técnica de microscopia de fluorescência, os resultados foram mais robustos, provavelmente por esta ser uma técnica em que se procede a uma análise célula a célula evitando que alguns efeitos sejam camuflados pela população total.
Por outro lado os resultados obtidos mostraram também que a microglia isolada pelo método de tripsinização nunca adquiriu uma morfologia típica de um estado de repouso mesmo após mais de um mês em cultura. Esta aparente maior reactividade basal das células pode ser uma das causas dos fracos sinais detectados quando estas são estimuladas com agentes inflamatórios.
Assim, constatou-se, que os níveis de produção de ROS e NO não foram significativos, quando usado o LPS (1 µg/µL) ou o ZyA (5 µg/mL), como agentes inflamatórios, no entanto estes estímulos foram capazes de aumentar significativamente a actividade fagocítica e quer o MCA quer a adição de GDNE exógeno foram capazes de reverter estes aumentos.
Assim, podemos afirmar que os resultados obtidos neste trabalho demonstraram que o GDNF tem, efectivamente, a capacidade de modular a resposta fagocítica da microglia e que a via de sinalização – p38 – está envolvida no processo de regulação da activação da microglia pelo MCA. No entanto é necessário testar a acção do inibidor da p38 na presença de GDNF exógeno para confirmar que esta via está envolvida no processo de regulação da activação da microglia pelo GDNF.
Palavras-chave
Abstract
Inflammatory processes in the central nervous system (CNS) mediated by activated glial cells play an important role in the pathway leading to neuronal cell death and are also involved in the development of neurodegenerative diseases such as Parkinson’s disease (PD).
Microglia, the resident innate immune cells in the CNS, provides the first line of defense whenever injury or disease occurs. An acute insult to the CNS triggers rapid microglial activation, the principal component of neuroinflammation. Microglia contributes to the neurodegenerative process through the release of a variety of neurotoxic factors (proinflammatory cytokines, reactive oxygen and nitrogen intermediates) that exacerbate the degeneration of neurons. On the other hand, inflammation is also thought to contribute to the induction of neurotrophic factors beneficial to damaged neurons.
Glial cell line-dereved neurotrophic factor (GDNF) is a potent survival factor for several neuronal populations in different brain regions, with therapeutic potential in PD. Although its effect on microglial cells remains is unclear, there are some results indicating that GDNF is able to regulate microglia activity.
Previous studies from our laboratory (Rocha et al. 2011) demonstrated that GDNF secreted by astrocytes has the capability to prevent microglial activation induced by Zymosan A, a polysaccharide extracted from the wall of yeasts and acting through Toll-like receptors: Toll-like receptor 2 (TLR2). With this work we intend to deepen this effect trying to clarify what are the signaling pathways used by GDNF to modulate the microglial activation and that regulate neuroinflammation. For the determination of the effect of GDNF in the activity of the microglia, primary cell cultures of microglia were previously exposed to astrocytes conditioned media (ACM, in which is present the GDNF secreted by astrocytes), then stimulated with Zymosan A or with LPS. The activity of the microglia was quantified through the production of reactive species of oxygen, nitric oxide or determination of phagocytic activity.
The initial aim of this study was to determine the signal transduction pathways used by GDNF to regulate the activity of the microglia. However, the initial experiences showed an unexpected lack of response by the microglia’s cultures to the inflammatory agents LPS and Zymosan A, when the reactivity was analyzed through the production of ROS, by a fluorimetric technique that measures the ROS produced by a population of cells. This lack of response is probably due to the fact that the signals in the overall population are low and the technique used to detect such changes has low sensitivity.
When the microglial reactivity induced by inflammatory agents was assessed by measuring the activity of phagocytic microglia, by means of a technique of fluorescence microscopy, the results were more robust, probably because it is a technique that uses single cell analysis avoiding the camouflage of small signals by the overall population.
On the other hand the results also showed that the microglia isolated by the method of trypsinization never acquired a typical morphology of a state of rest, even after more than a month in culture. The apparent increase of basal reactivity may be one of the causes of the weak signs detected when they are stimulated with inflammatory agents since activated cells are no longer capable of responding to the inflammatory agents.
The results also showed that the amount of NO and ROS produced were not significantly increased by exposure to LPS or ZyA (5 µg/mL). However, these agents significantly increased the phagocytic activity of microglia, an effect that was inhibited when the cells were pre-incubated with ACM or with exogenous GNDF. The results obtained in this work also demonstrate that the ability of ACM to modulate the microglial inflammatory response involves the p38 pathway. These results reinforce the idea of the neuroprotective role of GDNF also involves the inhibition of neuroinflammation occurring in PD.
Keywords
Índice
1. Introduction 1 1.1. Neurodegenerative Diseases 1 1.2. Parkinson’s Disease 1 1.3. Microglia 2 1.4. Neuroinflammation 41.5. Neurotrophic Factors and Neuroprotection 6
2. Materials and Methods 9
2.1. Microglial Cell Cultures 9
2.2. Microglial Cell Cultures – Enzymatic Digestion 9
2.3. Preparation of ACM 10
2.4. Cell viability assays 10
2.4.1. Stimulation of Microglia 10
2.4.2. Determination of Celular ROS levels 10
2.4.3. Measurement of nitric oxide (NO) 10
2.4.4. MTT Assay 11
2.4.5. Phagocytosis assay 11
2.5. Data analysis and statistics 12
3. Results 13
3.1. Effect of Zymosan A and LPS on the production of ROS by primary
microglia culture prepared by two different methods 13
3.2. Effect of LPS and ZyA on cell viability 15
3.3. Time Course for ROS and NO production by ZyA exposure 17
3.4. Is p38 pathway involved on the regulation of ZyA-induced microglia
activation promoted by the ACM? 18
4. Discussion/Conclusion 22
5. Bibliography 26
Lista de Figuras
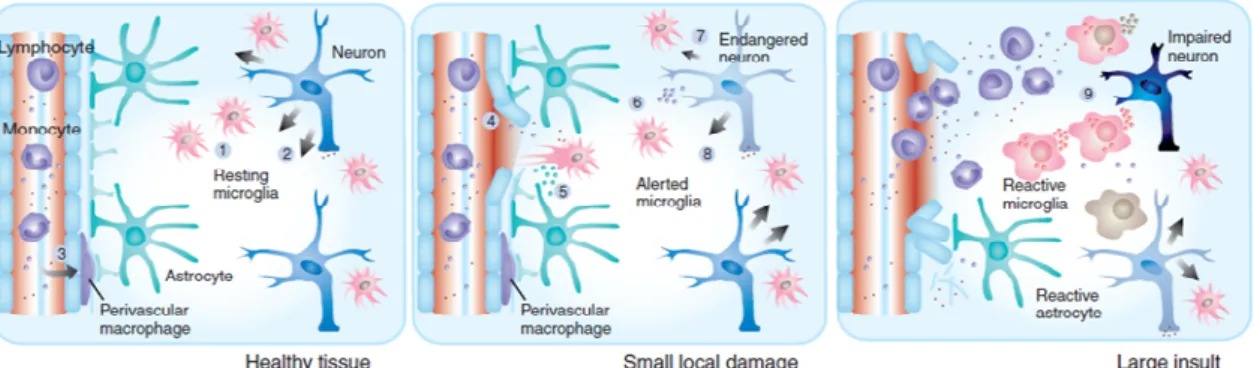
Figure 1: Activity states of microglia. Left, microglial cells in normal tissue constantly screen their environment. Right, stronger insults to the CNS (infectious challenge or significant tissue injury) may trigger more drastic changes in the functional phenotype of microglia (Hanisch &
Kettenmann, 2007). ...1
Figure 2: Inflammation in Parkinson’s Disease (Glass et al. 2010). ...1
Figure 3: Overview of GDNF signaling (Aron 2010)
.
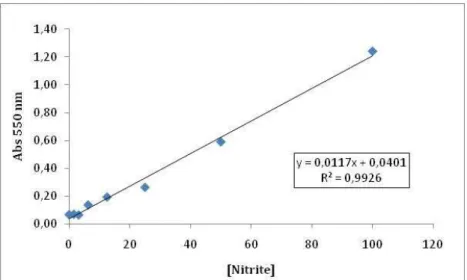
...7Figure 4: Representative Nitrite Standart curve. ...1
Figure 5: Effect of adding GDNF to the culture media in preventing ZyA induced microglial activation. ...1
Figure 6:Evaluation of time culture: (A) after 2 days, (B) after 5 days and (C) after 8 days…15 Figure 7: Morphology of microglial cells.. ...1
Figure 8: MTT evaluation 5 days after trypsinization (LPS)... 16
Figure 9: MTT evaluation 5 days after trypsinization (ZyA).. ... 16
Figure 10: Time course (ROS/NO) to evaluate the best time for the stimulus with ZyA (5mg/mL)... 17
Figure 11: Effect of p38 inhibitor on microglial activation induced by ZyA ... 18
Figure 12: The effect of p38 inhibitor and exogenous GDNF on microgial activation induced by ZyA. ... 19
Figure 13: ACM and GDNF suppress microglia activation promoted by ZyA and p38 inhibitor is involved in microglia activation.) . ... 19
Figure 14: Time course (NO) to evaluate the best time for the stimulus with ZyA (0.5mg/mL). ... 30
Lista de Tabelas
Table 1: Concentrations and Conditions of Cell culture stimulants. ... 10 Table 2: H&B Concentrate... 30
Lista de Acrónimos
ACM Astrocytes Conditioned Medium
AD Alzheimer’s Disease
ARTN Artemin
BBB Blood-Brain Barrier
BSA Bovine Serum Albumin
CNS Central Nervous System
CREB cAMP Response Element Binding Protein
DA Dopamine
DCFDA 2’-7’ dichlorodihydroflurescein diacetate
DMEM Dulbecco’s modified Eagle’s medium
DNA Deoxyribonucleic acid
ERK Extracelular Signal Regulated Kinase
GDNF Glial Cell Line-Derived Neurotrophic Factor
GFL’s GDNF-family Ligand GFR-α GDNF-family receptor α GPI Glycosylphosphatidylinositol HS Heparan Sulfate IFN-γ Interferon γ IL-1 Interleucin 1
JNK c-Jun N-Terminal Kinase
LBs Lewy bodies
LPS Lipopolysaccharide
MAPK Mitogen-activated Protein Kinase
MHC Major Histocompatibility Complex
mRNA Messenger RNA
MTT 3-(4,5-dimethylthiazol-2-yl)-2,5-diphenyltetrazolium bromide
NADPH Nicotinamide Adenine Dinucleotide Phosphate-Oxidase
NCAM Neural Cell Adhesion Molecules
NO Nitric Oxide
NTN Neurturin
PBS Phosphate buffer saline
PD Parkinson’s Disease
PFA Paraformaldehyde
PI3K Phosphatidyinositol 3-Kinase
PKC Protein Kinase C
PKCα Protein Kinase α
PLC Phospholipase C
PLC-γ Phospholipase C - γ
PSP Persephin
RET Receptor Tyrosine Kinase
ROS Reactive oxygen species
SNpc Substantia nigra pars compacta
TNF-α Tumor Necrosis Factor
Chapter 1
Introduction
1.1. Neurodegenerative Diseases
Neurodegenerative diseases are characterized by the progressive deterioration of synaptic contacts or networks that, under physiological conditions, regulate cell-to-cell communication (Fumagalli et al. 2008) (Amor et al. 2010). Neuroinflammation (inflammation in the central nervous system (CNS)), a prominent feature of various neurodegenerative diseases, has been increasingly implicated in these diseases (Gao & J.-shyong Hong 2008) (Glass et al. 2010). Despite different triggering events, a common feature of neurodegenerative diseases is chronic immune activation, in particularly of microglia, the resident macrophages of the central nervous system (Amor et al. 2010).
1.2. Parkinson’s Disease
In his classic 1817 monograph “Essay on the Shaking Palsy,” James Parkinson described the core clinical features of the second most common age-related neurodegenerative disease after Alzheimer’s disease (AD) (Dauer & Przedborski 2003). Parkinson’s disease (PD) is the most common neurodegenerative disorder of motor functioning, affecting nearly six million people worldwide. The disorder is particularly prevalent in the elderly population, with a typical clinical onset after 60−65 years of age (Litteljohn et al. 2010).
In 90-95% of cases, PD occurs in an idiopathic manner, whilst in the remaining 5–10% of cases, a genetic mutation is present (Long-smith et al. 2009). Although PD has been found to be a sporadic disease, there are a growing number of single gene mutations that have been identified (Davie 2008); 11 genes have been mapped by genetic linkage with six genes identified as being associated with the disease: α-synuclein, ubiquitin C-terminal hydrolase like 1, parkin , LRRK 2, PINK 1 and DJ-1 genes (Davie 2008).
Idiopathic PD may represent a long and cumulative process, where the final outcome is results from a complex set of interactions between genetic predisposition, the innate vulnerabilities of the nigro-striatal dopamine (DA) system, and exposure to environmental toxins. Among these environmental toxins, infectious agents, pesticides, and heavy metals have been implicated in the development and progression of PD (Block & J.-S. Hong 2005).
Although neurodegeneration in PD involves multiple areas of the brain such as; the vagus, locus ceruleus and olfactory nuclei, the main neuropathological change that gives rise to the array of motor deficits seen in PD patients is the loss of dopaminergic neurons in the substantia nigra pars compacta (SNpc), resulting in a severe depletion of striatal DA (Lim & Tan 2007). However, other neurotransmitter systems (e.g. cholinergic, adrenergic, serotoninergic) also degenerate and cell loss is seen in other brain stem nuclei and in the
cortex. This non-dopaminergic degeneration is a major cause of the non-motor symptoms of PD (e.g. cognitive decline and autonomic dysfunction) (Schapira 2009).
As the disease progresses, bradykinesia, tremor at rest, gait disturbances, postural instability and rigidity develop. Loss of facial expression and micrographia are also common. The symptoms usually start on one side of the body and later become bilateral (Long-smith et al. 2009). In addition to the motor impairment evident in all PD cases, a substantial number of PD patients also display prominent “non-motor” symptoms (many of which manifest before the onset of motor decline and PD diagnosis), including autonomic and olfactory problems (e.g., sleep disorders, hyposmia), as well as cognitive and psychological disturbances such as anxiety and depression (Litteljohn et al. 2010). When these symptoms appear 50–70% of nigrostriatal dopaminergic neurons have already been lost (Lesage & Brice 2009).
Pathologically, PD is also characterized by neuronal eosinophilic intracytoplasmic inclusions known as Lewy bodies (LBs) which are present in neurons of the central nervous system (specific cortical regions, brain stem, and spinal cord), peripheral autonomic nervous system, enteric nervous system, and cutaneous nerves (Hisahara & Shimohama 2011)(Lim & Tan 2007). There are also aggregates in neurites, commonly referred to as Lewy neurites. A major constituent of Lewy bodies is aggregated α-synuclein protein (Ross & Poirier 2004). α-synuclein is generally considered an intracellular protein, because of the lack of signal sequence and its abundant presence in the cytosol (Y. S. Kim & Joh 2006). Mutations in the α-synuclein gene are responsible for some familial forms of PD in which lewy bodies are also seen (Davie 2008).
Despite intensive research, the cause of neuronal loss in Parkinson’s disease and the role of these protein inclusions are not fully understood. However, several molecular and cellular changes that might be involved in neuronal degeneration have been identified. These include: abnormal protein handling, oxidative stress, mitochondrial dysfunction, excitotoxicity, and apoptotic processes (Hirsch & Hunot 2009). These pathological changes are accompanied by significant glial reactions thought to be important for driving disease progression (Halliday et al. 2011). The etiologies of most common forms of PD remain poorly understood.
The first evidence for a role for inflammation in PD came from a post-mortem study – in 1998, McGeer and colleagues found activated microglia and T-lymphocytes in the SNpc of a PD patient. Since then, there have been numerous studies which support a role for neuroinflammatory processes in PD (Long-smith et al. 2009). The inflammatory process in PD is characterized by activation of resident microglia, with few reactive astrocytes (Polazzi & Monti 2010).
1.3. Microglia
The microglia as a distinct cell type was first recognized by Nissl who named them Staebchenzellen (rod cells) for their rod-shaped nuclei and considered them as reactive neuroglia (S. U. Kim & de Vellis 2005). Microglial cells were first described in 1919 by
Rio-Hortega, while using a silver carbonate staining method. He described them as a cell population distinct from classical glia (astrocytes) and neurons (Hanisch & Kettenmann 2007). Microglial cells are derived from myeloid cells in the periphery and comprise approximately 12% of cells in the brain. Microglia density varies by brain region in the adult human (0.5–16.6%) and in the adult mice. It is predominately localized in the grey matter, with the highest concentrations being found in the hippocampus, olfactory telencephalon, basal ganglia and substantia nigra (Block et al. 2007).
Microglia are believed to act primarily as scavengers in the defense of the brain (Nakajima & Kohsaka 2004). These cells are the unique population of CNS resident immune cells. Their principal function is to quickly respond to the presence of pathogens and to brain damage (Nakajima & Kohsaka 2004). The major role of microglia in the CNS immune response is to promote phagocytosis. Phagocytosis of tissue debris after tissue injury is essential to the wound healing process, and as such, microglia can be considered to be the most important cell type in CNS tissue repair (Streit et al. 2005). Microglial cells were defined originally as a distinct cell type in the CNS based solely on in situ morphology. According to the classic morphologic studies based on silver carbonate staining technique, microglia cells were divided into three types: ameboid, ramified, and intermediate forms (Streit et al. 2005). Amoeboid microglial cells found in the developing brain are phenotypically similar to reactive microglia with a large spherical cell body and short processes (Dheen et al. 2007). In various neurodegenerative diseases and brain injury microglial cells presents signs of activation. The activated microglial cells express various cytokines and growth factors in response to neural injury in pathological conditions (Dheen et al. 2007).
The designation of “resting” microglia may imply a state of functional quiescence. However, microglia in the normal (healthy) mature CNS tissue is not passive or “inactive.”
Resting microglia is a cell in “standby mode” (Van Rossum & Hanisch 2004) constantly patrolling the brain parenquima. Migration of microglial cells is not usually observed in healthy CNS tissue, and the available literature suggests that microglia become motile when considerable damage to CNS tissue occurs thus requiring structural and functional repair (Graeber 2010).
Figure 1: Activity states of microglia. Left, microglial cells in normal tissue constantly screen their
environment. Right, stronger insults to the CNS (infectious challenge or significant tissue injury) may trigger more drastic changes in the functional phenotype of microglia (Hanisch & Kettenmann 2007).
In response to certain cues such as brain injury or immunological stimuli, microglial cells are readily activated (Block et al. 2007). The resident ramified microglia -morphologically transform into cells with retracted processes and enlarged cell bodies, and increase in number at the affected site. Microglial cells with this particular cell form are generally referred to as "activated microglia” or "reactive microglia" (Nakajima & Kohsaka 2004).
Although microglial activation occurs within minutes it can be long-lasting (Graeber 2010). Besides the dramatic transformation from their resting ramified state into an amoeboid morphology activated microglia present an upregulated catalogue of surface molecules, such as CD14, major histocompatibility complex (MHC) molecules, chemokine receptors and several other markers (Hanisch & Kettenmann 2007). In their activated state, they can serve diverse beneficial functions essential to neuron survival, which include cellular maintenance (for example, by clearing toxic cellular debris) and innate immunity (Hanisch & Kettenmann 2007). Moreover, microglia activation can engage neighboring glial cells in a cycle of autocrine and paracrine amplification of neurotoxic immune products (Polazzi & Monti 2010).
In general, activated microglia produce a variety of proinflammatory cytokines, among which, interleukin (IL-1) and tumor necrosis factor (TNF-α) are the most important. Some cytokines such as, IL-1 and, TNF-α induce microglia to produce nitric oxide (NO) and further damage neurons through lipid hyper-peroxidation and DNA injury (Ouchi et al. 2009). In culture, activated microglia have been shown to produce several potentially cytotoxic molecules including; superoxide anions, NO, pro-inflammatory cytokines, excitotoxins and prostanoids (Nakamura 2002). In addition, these cells release free radicals such as superoxide and nitric oxide that are products of enzymes NADPH oxidase and nitric oxide synthase (iNOS) respectively (Dheen et al. 2007). For self protection against oxidative stress, microglial cells are equipped with efficient antioxidative defense mechanisms. Microglial cells contain glutathione, substantial activities of the antioxidative enzymes, superoxide dismutase, catalase, glutathione peroxidase and glutathione reductase as well as NADPH-regenerating enzymes. Their good antioxidative potential protects microglial cells against oxidative damage (Glass et al. 2010).
1.4. Neuroinflammation
Inflammation is a complex cascade of self-defensive response to injurious stimuli. Traditionally, the CNS was considered immunologically privileged because of its limited inflammatory capacity and lack of lymphatic infiltration (Gao & J.-shyong Hong 2008). However, it is becoming increasingly clear that the CNS is immunologically specialized. Microglia, the resident innate immune cells in the CNS, provides the first line of defense whenever injury or disease occurs. They can sense a wide range of stimuli (CNS trauma, ischemia, infection, toxic insult and autoimmunity)that disrupt physiological homeostasis (Gao & J.-shyong Hong 2008).
Neuroinflammation involves two types of immune systems: lymphocytes, monocytes and macrophages of the hematopoietic system, and microglial cells of the CNS. Inflammation induces changes in blood-brain barrier (BBB) permeability and the capillary endothelial cells release substances which influence the astrocytic endfeet, which are a part of the BBB (Hansson 2010) .
Neuroinflammation is the self-defense reaction of the living brain against external injury, bacterial invasion, chemical substance, irradiation and so forth in two ways: rescuing damaged cells (anti-inflammatory) and further destroying them (pro-inflammatory). In the brain neuroinflammation the central roles are not played by macrophages or dendritic cells residing in the Virchow-Robin cavity, pier matter and choroidal plexus, but by glial cells, such as microglia and astrocytes, (Ouchi et al. 2009).
It has been shown that the levels of cytokines such as TNF-α, (IL)-1β, and interferon (IFN-γ) are elevated in the substantia nigra of patients with PD. Since microglia are a principal source of these cytokines, the data support microglial involvement in the pathogenesis of PD (Sawada 2009).
It is now generally accepted that microglia contribute to the neurodegenerative process through the release of a variety of neurotoxic factors that exacerbate the degeneration of neurons (B. I. N. Liu & J.-shyong Hong 2003). In response to inflammatory stimuli, intracellular signaling pathways are activated that carry the signal needed to activate the production of inflammatory mediators. Activation of receptors triggers major intracellular signaling pathways such as the mitogen-activated protein kinase (MAPK) pathway (Kaminska 2005). MAPK are serine-theronine kinases that mediate intracellular signaling associated with a variety of cellular activities including cell proliferation, differentiation, survival, death and transformation (E. K. Kim & E.-J. Choi 2010). MAPK family includes three major members: extracellular signal regulated kinase (ERK), p38, and c-Jun N-terminal kinase (JNK),
representing three different signaling cascades. MAPKs are activated by phosphorylation and transduce a broad range of extracellular stimuli into diverse intracellular responses by both transcriptional and non-transcriptional regulation (Ji & Suter 2007).
Microglial response to extracellular stimuli is mediated by kinase and phosphatase cascades. Several reports have demonstrated that p38 and p44/42 families of MAPK pathways play a significant role in activation of microglial cells which in turn leads to release of neurotoxic molecules and neuroinflammation (Dheen et al. 2007). In addition to p38, protein kinase C (PKC) was associated with the secretion of harmful factors. An association of PKC activity with the induction of NO was reported in lipopolysaccharide (LPS) -, IFN-γ-, and thrombin-stimulated microglia. It has been suggested that PKCα and p38 are interactively linked to a signaling cascade that induces harmful factors in LPS stimulated microglia (Nakajima & Kohsaka 2004).
1.5. Neurotrophic Factors and Neuroprotection
The potential of microglia to produce both neurotrophic and neurotoxic molecules in vitro allows us to consider the presence of different states of microglia. The neurotrophic activities of microglia have been shown both in in vitro systems and in in vivo studies (Nakajima & Kohsaka 2004). It has been suggested that glial cell line-derived neurotrophic factor (GDNF) is produced by microglia and astrocytes. In fact, GDNF mRNA has been detected in the microglia of the injured striatum. These results indicate that microglia, like astrocytes, are a GDNF supplier in the CNS (Nakajima & Kohsaka 2004).The GDNF family is distantly related to the transforming growth factor - β (TGF-β) superfamily and includes GDNF and three structurally related members called neurturin (NTN), persephin (PSP), and artemin (ARTN) (Levy et al. 2005). GDNF was purified and characterized in 1993 as a growth factor promoting the survival of the embryonic dopaminergic neurons of the midbrain, (i.e. those neurons that degenerate in PD) (Sariola & Saarma 2003). In addition, GDNF promote the survival and regulate the differentiation of many peripheral neurons, such as sympathetic, parasympathetic, sensory and enteric neurons (Sariola & Saarma 2003).
In the last years a large number of studies demonstrated that GDNF provides potent neuroprotection in animal models of PD, motor neuron degeneration, cerebral ischemia, and limbic seizure. More importantly, the clinical use of GDNF for the treatment of the PD in humans is currently under evaluation (Boscia et al. 2009).
GDNF is a glycosylated, disulfide-bonded homodimer, with a molecular weight of 33–45 kDa. Sequence data suggest that GDNF is synthesized as an inactive 211 amino acids-long pre-proGDNF, and then processed to the mature protein with 134 amino acids (Saavedra et al. 2008). It contains a cysteine “knot”, and the monomer of the three dimensional structure is characterized by two long fingers formed by pairs of antiparallel β-strands connected by a loop and a helical portion in the opposite site. The monomers are associated in a head-to-tail orientation to form the dimer (J. Yang 2006).
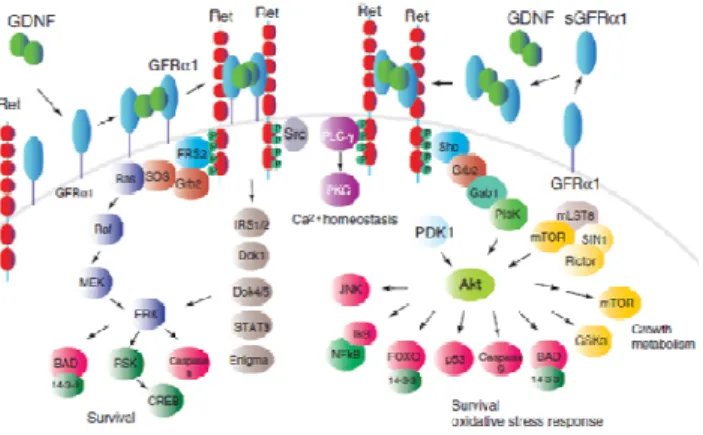
In normal conditions, the GFLs (GDNF-family ligand) signal through a multicomponent receptor complex comprising of the transmembrane Ret tyrosine kinase, which was first discovered as a proto-oncogene (Sariola & Saarma 2003). It is activated only if the GFL is first bound to a novel class of proteins, known as GDNF family receptor-α (GFRα) receptors, which are linked to the plasma membrane by a glycosyl phosphatidylinositol (GPI) anchor (Saavedra et al. 2008). The ligand-binding specificity of GFLs is determined by GFRα proteins that have unique binding affinities for each GFL (Sariola & Saarma 2003). GDNF binds to GFRα1, then forms a complex with RET (Airaksinen & Saarma 2002) (Figure 3).
RET is a single-pass transmembrane protein that contains four cadherin-like repeats in the extracellular domain and a typical intracellular tyrosine kinase domain (Airaksinen & Saarma 2002). According to the original model, a GDNF dimer first binds to either monomeric or dimeric GFRα1, and the GDNF–GFRα1 complex then interacts with two RET molecules, thereby inducing their homodimerization and tyrosine autophosphorylation (Airaksinen & Saarma 2002). The GDNF family ligands and the GFR-α complex bring two molecules of RET together, triggering the transphosphorylation of specific tyrosine residues in their Trk domains as well as intracellular signaling transduction. RET activates several intracellular pathways to regulate survival, neurite outgrowth, and synaptic plasticity. GDNF also stimulates the PI-3K/Akt and MAPK/ERK pathways to exert its biological actions, (Cui 2006) and PLC pathways (Ibáñez 2010) (Figure 3).
RET can activate various signaling pathways including RAS/ERK, PI3K/Akt, p38 MAPK and JNK pathways (Takahashi 2001). This results in an increase in phosphorylation of tyrosine hydroxylase at Ser31 by ERK1 or ERK2 (Levy et al. 2005) (Figure 3).
Since GFRα1 lacks an intracellular domain, the fact that this receptor appeared expressed in many brain areas in the absence of RET was taken as an indication that additional signaling receptors might exist (Ibáñez 2010). A Ret-independent signalling pathway, using GFRα1-associated Src kinase activation was demonstrated, and GFRα has also been shown to use also neural cell adhesion molecules (NCAM) as signalling receptors for GDNF family ligands. In RET-deficient cell lines and primary neurons, GDNF triggers Src-family
kinase activation and phosphorylation of ERK/MAPK, PLC-γ and the transcription factor cAMP response-element binding protein (CREB), and induction of the transcription factor Fos (Levy et al. 2005).
Along with to the known receptors GFRα1 and Ret, GDNF signaling requires heparan sulphate glycosaminoglycans. However recent findings suggest that the contribution of heparin and heparan sulphate (HS) does not occur during the GDNF–GFRα1 engagement (Saavedra et al. 2008)
Bespalov et al., (2011), showed that all immobilized matrix-bound GFL’s, except PSP, use a fundamentally different receptor. They interact with syndecan-3, a transmembrane HS proteoglycan, by binding to its HS chains with high affinity (Bespalov et al. 2011). Syndecan-3 acts as a functional receptor for immobilized GDNF, triggering cell spreading and neurite outgrowth via SFK activation. It was also demonstrate that syndecan-3 mediates GDNF induced migration and differentiation of cortical neurons and, specifically, of the GABAergic population (Bespalov et al. 2011).
During inflammation, microglia undergo several steps to promote regeneration of neural tissue. It is known that microglia release GDNF, and this GDNF can contribute to maintain microglia in a resting state. However, neurological diseases are characterized by heightened inflammation, which may indicate that the in this conditions capability of GDNF to maintain microglial cells in a resting state is lost. This hypothesis might be a new approach for better understanding the relationship between microglia, GDNF and neuroinflammation.
In this present study we examined the significance of GDNF on microglial activation, while attempting to understand which are the pathways through which GDNF can effectively regulate microglial activation.
Chapter 2
Materials and Methods
2.1. Microglial Cell Cultures
All experiments related to animals were conducted in compliance with protocols approved by the national ethical requirements for animal research, and with the European Convention for the Protection of Vertebrate Animals Used for Experimental and Other Scientific Purposes. Briefly, the ventral midbrain of postnatal day 3-5 Wistar rat pups was dissected, carefully stripped of the meninges, and put in iced phosphate buffer saline (PBS: NaCl 140 mM, KCl 2,7 mM, KH2PO4 1,5 mM and Na2HPO4 8,1 mM, pH 7,4), followed by
sequential passes with the techtips. The tissue was then mechanically dissociated with a 5 ml pipette, followed by further 5-10 sequential passes with techtips. Finally, the cells were passed through a 70 µm mesh, pelleted by centrifugation, and suspended in DMEM (Dulbecco’s modified Eagle’s medium with 10% Fetal Bovine Serum and 100 units/ml penicillin plus 100
µg/ml streptomycin) and plated into 175 cm2 poly-D-lysine (Sigma)-coated culture flasks (BD
Falcon) at a density of 2 x 10⁶ cells/cm2. The cultures were kept at 37 ºC in a 5% CO2, 95% air
atmosphere. The medium was changed every 4 days. On day 12, culture plates were shacked at 25 g during 2 hours to detach microglial cells to the supernatant, leaving astrocytes in the adherent monolayer. The supernatant was collected and centrifuged (3K18C Bioblock Scientific; Sigma Laboratory Centrifuges) for 10 min at 184 g. The pellet was then re-suspended and microglial cells plated into 1.1cm2 or 0.9 cm2 poly-D-lysine-coated coverslips and kept at 37 ºC in a 5% CO2, 95% air atmosphere for 13 day. Culture medium was replaced every 4 days.
2.2. Microglial Cell Cultures – Enzymatic Digestion
The ventral midbrain of postnatal day 2 or 3 Wistar rat pups was dissected, carefully stripped of the meninges, and put in iced PBS. The tissue was then dissociated by enzymatic digestion with a papain solution (cysteine water (CaCl2 1M, cysteine 1.3 mM in miliQ H2O.
Final Conc. 1mM) (7.87mL), papain (0.04250), H&B solution1 (2mL) and phenol red (final concentration 0.001%). The solution was and effused with carbogen, at least for 20 min before the dissection, and maintained at 37ºC.
The average time for digestion was 4 min. After the digestion, the tissue was removed to a sterile tube and washed 3 times with 5 ml of warmed DMEM. The tissue was then mechanically dissociated with a pipete, followed by a sequential passes with the techtips.
Finally, the tissue was pelleted by centrifugation (3K18C Bioblock Scientific; Sigma Laboratory
Centrifuges) for 3 min at 230 g, suspended in DMEM and plated into 12 or 48 well plates at a density of 0,023x106 cells/cm2. The cultures were kept at 37ºC under a 5% CO2, 95% air
atmosphere. The medium was changed every 7 days. After 20-21 days in vitro, the microglia were obtained by trypsinization of astrocytes with a trypsin solution diluted 1:3 in DMEM for 45-60 min.
2.3. Preparation of ACM
Astrocytes were grown to confluence. On reaching confluence culture medium was changed to DMEM and after 24h the ACM was collected and stored at -80ºC until use.
2.4. Cell viability assays
2.4.1. Stimulation of Microglia
On culture day 5, microglial cells were exposed to DMEM or ACM. ZyA or LPS were added to the culture medium, according to the following table.
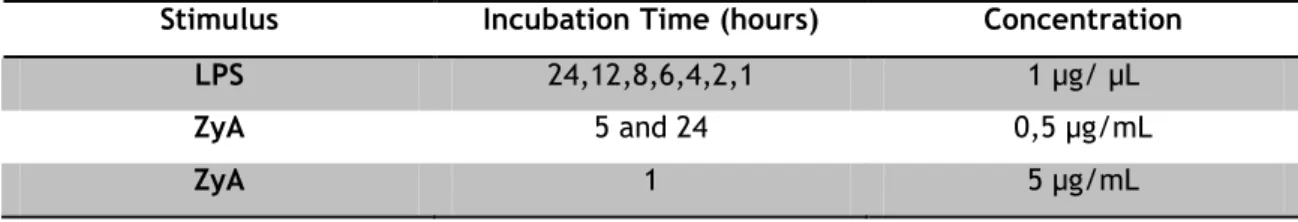
Table 1: Concentrations and Conditions of Cell culture stimulants.
Stimulus Incubation Time (hours) Concentration
LPS 24,12,8,6,4,2,1 1 µg/ µL
ZyA 5 and 24 0,5 µg/mL
ZyA 1 5 µg/mL
2.4.2. Determination of cellular ROS levels
Formation of ROS in cells was determined with the fluorescent probe 2',7'-dichlorodihydrofluorescein diacetate (DCFDA). DCFDA enters cells passively and is deacetylated by esterases to the nonfluorescent molecule DCFH. DCFH reacts with ROS to form DCF, the fluorescent product. Cells exposed for 1 hour to ZyA (5 µg/mL), or 1h to LPS (1 µg/µL), were incubated with DCFDA in culture medium, for 1 hour, at 37 °C. Finally, fluorescence intensity was measured in a spectrofluorometer (FluroMax®-4; Horiba), using the wavelengths 485 nm for excitation and 530 nm for emission.
2.4.3. Measurement of nitric oxide (NO)
Nitric oxide concentrations were determined by measuring the total amount of nitrite
(NaNO2, including nitrate that is converted to nitrite by the Griess reagent), one end product
of NO oxidation that is released to the culture medium. This assay relies on a diazotization reaction that was originally described by Griess in 1879, and is based on the chemical reaction which uses sulfanilamide and NED (N-1-napthylethylenediamine dihydrochloride) under acidic conditions. The amount of NO formed was determined from the accumulation of the stable NO metabolite (nitrite) in the supernatant after 5 h of ZyA stimulation (0,5
µg/mL). Supernatants (50 µl) were collected, transferred to a 96 well plate, and mixed with an equal volume of Griess reagent. The mixture was incubated in the dark for 10 min at room temperature, and the absorbance was read at 540 nm. To ensure accuracy of the nitrite
quantification, a reference curve was prepared using as a matrix DMEM. The concentration of
nitrite in the samples was determined from a sodium nitrite (NaNO2) standard curve (Figure
4).
2.4.4. MTT Assay
3-(4,5-dimethylthiazol-2-yl)-2,5-diphenyltetrazolium bromide (MTT) is a tetrazolium salt dye with a pale yellow color that is cleaved by intracellular dehydrogenases to form purple formazan crystals. The amount of formazan produced is proportional to the number of metabolically active, and thus viable, cells. After removing the culture medium 200 µL of MTT dissolved in Krebs medium (0,5mg/mL), were added to each well. The cells were incubated with this solution for 1.5 h at 37ºC. After this incubation period the medium was removed and 0,04M HCl in isopropanol was added to dissolve the crystals of formazan. To further help dissolving the formazan crystals the plate was agitated on an orbital shaker for 10 to 15 min.
Colourimetic determination of MTT reduction was measured at A570 with a reference filter of
620nm, using a microplate reader (Anthos 2020).
2.4.5. Phagocytosis assay
Control cultures and cultures exposed to ZyA for 24h were incubated for 30 min with fluorescent 1 µm polystyrene microspheres (0.01%) and then washed with DMEM to remove non-engulfed microspheres. Finally, cells were fixed in 4% paraformaldehyde (PFA) for 10 minutes. For quantification of phagocytic cells, more than 30 different fields per slide were analyzed on a Zeiss inverted microscope (Axiobserver Z1 - Zeiss) under a 63x magnification.
2.5. Data analysis and statistics
Data in figures and tables are presented as mean ± S.E.M, of the number of experiments indicated in figure legends. Statistical analysis was performed using one-way ANOVA followed by Bonferroni's Multiple Comparison Test. Values of P< 0.05 were considered significant.
Chapter 3
Results
3.1. Effect of Zymosan A and LPS on the production of ROS by
primary microglia cultures prepared by two different methods
The initial main goal of this project was, as mentioned before, to understand the signaling pathways involved in the modulation of microglial reactivity by GNDF. However, due to unpredicted lack of response of our cell cultures to the inflammatory agents used to induce microglial activation, a great effort and long time was spend in adjusting the experimental conditions in order to obtain significant responses. The first part of this chapter focuses in this attempt to find the adequate experimental conditions.
Previous studies from our laboratory (Rocha et al. 2011) demonstrated that GDNF secreted by astrocytes has the capability to prevent microglial activation induced by ZyA. With this work we intend to deepen this effect trying to clarify which are the signaling pathways used by GDNF to modulate the microglial activation and thus, to regulate neuroinflammation. This previous work was developed on microglial cultures prepared according to the method described by Cristovão et al., 2010.
We started by assessing the microglial reactivity by measuring the production of ROS, since these species are soluble mediators released by reactive microglia. In this work the amount of ROS produced was analyzed through a fluorimetric technique that measures the ROS produced by a population of cells.
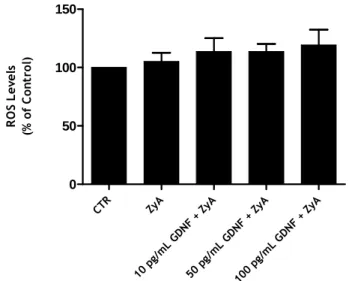
CTR ZyA 10 p g/m L GD NF + ZyA 50 p g/m L GD NF + ZyA 100 pg/m L GD NF + ZyA 0 50 100 150 R O S L e v e ls (% o f C o n tr o l)
Figure 5: Effect of adding GDNF to the culture media in preventing ZyA induced microglial activation. Cells were stimulated with ZyA (5 µg/mL) for 6 hours, before the evaluation of ROS
levels. The experiment was done for three times, performed in triplicate. These results were not statistically significant.
To confirm the results previously obtained by Rocha et al. (2011), microglial cells were stimulated with the pro-inflammatory agent ZyA (5 µg/mL) for 24 hours and the production of ROS was determined. In parallel, we determined the effect of pre-incubating the cells with GDNF, which was previously demonstrated by Rocha et al. (2011) to prevent the increase in ROS levels induced by ZyA stimulation. Before measurement of the levels of ROS, the cells
werescraped and homogenized, to ensure a more uniform reading in the supernatant.
Previous results (Rocha et al. 2011) indicated that the addition of exogenous GDNF to cell culture can modulate the microglial activation; however our results do not corroborate those findings.
The results presented in figure 5 show that in our microglial cultures ZyA was unable to stimulate ROS production and thus it was impossible to determine any effect of GDNF on microglial reactivity. A possible explanation for this lack of effect may be the low cell density in this cell cultures and the consequent low fluorescence signal. In an attempt to achieve stronger signals we decided to implement a different culture method based on the procedure described by Saura and coworkers (Saura et al. 2003). The cultures obtained with this new method presented a much higher cell density and almost no contaminant astrocytes. We also decide to test the effect of a different pro-inflammatory agent, LPS, since this molecule is more widely used to induce microglia activation and its effects are better characterized in the literature.
Once the process of trypsinization is characterized by being aggressive to the cells, this can change the reactivity of the microglia, meaning that it can also affect the results obtained. In this way, in order to determinate the action of trypsin in the cultures we assessed the behavior of cells over the course of several days after exposure to trypsin, in order to determinate the time point with higher responses to the inflammatory agent.
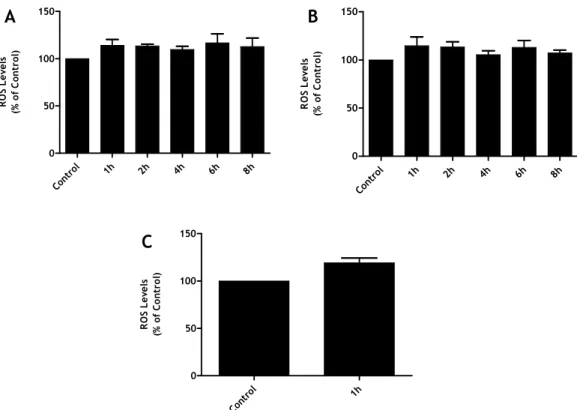
Two, five and eight days after trypsinization primary microglia cultures were exposed to a stimulus of LPS (1µg/µL) for 1, 2, 4, 6 and 8 hours, and the ROS production was evaluated (Figure 6). The results obtained lead us to choose the fifth day to perform the following experiments. Although no major differences were obtained in the cell responses to ZyA, we decided for the intermediate time in culture (5 days) since the majority of the cells in the culture presented small ramifications, whereas until day 5 the cultures presented mainly microglia with round/ameboid morphology. After the fifth day, subsequent to the trypsinization, the culture did not exhibit further significant changes in cell morphology, even after one month in culture.
Although we did not obtain significant changes in ROS production after exposure to LPS for any of the time points analyzed a tendency to an increase was observed after one hour of stimulation. This tendency did not augment with longer exposure times. This behavior was observed both after 2 and 5 days after trypsinization.
Figure 6: Evaluation of time culture: (A) after 2 days, (B) after 5 days and (C) after 8 days. The cells
were stimulated with LPS (1µg/µL), during 1, 2, 4, 6 and 8 hours. The data represente the mean ± SEM of triplicates from a single experiment.
As such, all the following experiments were done on the fifth day. It is important to note that with these new cultures, microglia never showed a typical morphology of a “resting” state as observed with the enzymatic digestion (Figure 7 (B)); as compared to the others cultures (Figure 7 (A)).
3.2. Effect of LPS and ZyA on Cell Viability
Since we did not observe significant increases in ROS production after stimulation with LPS we decided to determine if this could be related to a reduction of cell viability under the
Cont rol 1h 2h 4h 6h 8h 0 50 100 150 R O S L e v e ls (% o f C o n tr o l) Cont rol 1h 2h 4h 6h 8h 0 50 100 150 R O S L e v e ls (% o f C o n tr o l) Cont rol 1h 0 50 100 150 R O S L e v e ls (% o f C o n tr o l)
A
B
C
A
B
Figure 7: Morphology of microglial cells. (A) Typical “resting” morphology of microglia (B)
Effect of LPS-induced activation on the morphology of microglia cells, on the fifth day. Cells prepared according the trypsinization method.
experimental conditions used. To determine the possible effect of LPS on cell viability, a MTT reduction assay was used.
The results indicate that the conditions and concentration of LPS used did not induce apoptosis of microglia cells, and thus did not lead to a reduction in the number of viable cells in culture. With this, we can say that LPS, at a concentration of 1µg/µL, did not induce cytotoxicity to migroglia cells and thus, the lack of effects observed previously were not due to cell death.
Again, as an attempt to obtain stronger signals we decided to study the effect of ZyA, at a concentration of 5 µg/mL. At the time this experiments were performed ZyA was being used in a different project develop in our laboratory, also with the same cell cultures, and with good results.
The results obtained showed that ZyA, at a concentration of 5 µg/mL, did not lead to a reduction in the number of viable cells, as expected.
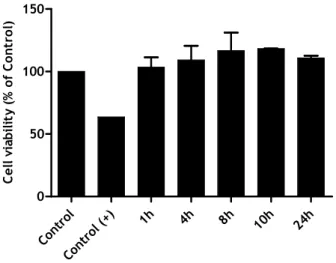
Cont rol Cont rol ( +) 1h 4h 8h 10h 24h 0 50 100 150 C e ll v ia b il it y ( % o f C o n tr o l)
Figure 8: MTT evaluation 5 days after trypsinization (LPS). The cells were treated with 1µg/µL
LPS, for 1, 4, 8, 10 and 12 hours. The data represente the mean ± SEM of four replicates from a single experiment. CTR CTR + 1h 3h 5h 7h 23h 0 50 100 150 C e ll v ia b il it y ( % o f C o n tr o l)
Figure 9: MTT evaluation 5 days after trypsinization (ZyA). The cells were treated with
5µg/mL ZyA, for 1, 3, 5, 7 and 23 hours. The data represente the mean ± SEM of four replicates from a single experiment.
3.3. Time Course for ROS and NO production induced by ZyA exposure
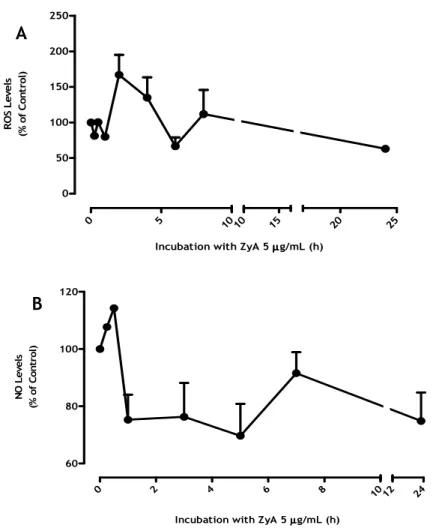
The release ROS and NO occurs almost simultaneously with the morphological alteration of microglia, that is, when there is activation of microglia also occurs, in a progressive way, the release of ROS and NO. This release occurs immediately after the exposure of microglia to inflammatory agent, in this case the ZyA, until 2-3 hours after the stimulus. This experiment aimed at determining the time after the exposure to ZyA, when the production of ROS and NO was maximalTo evaluate the response of microglia cultures to stimulus at early and late time points, microglia cells were exposed to ZyA (5 µg/mL) and ROS and NO production were determined (Figure 10).As shown in figure 10, ZyA promoted a significant increase in the level of ROS and NO during the first 2h of stimulation. As a result, all the experiments to evaluate the amount of ROS production by microglia cells were made at 2 hours after the stimulus with ZyA. NO was not measured, because later experiments revealed no significant values. With this, the assessment of microglial activity was done by measuring the levels of ROS.
A
B
0 2 4 6 8 10 60 80 100 120 12 24Incubation with ZyA 5µµµµg/mL (h)
N O L e v e ls (% o f C o n tr o l) 0 5 10 0 50 100 150 200 250 10 15 20 25
Incubation with ZyA 5µµµµg/mL (h)
R O S L e v e ls (% o f C o n tr o l)
Figure 10: Time course (ROS/NO) to evaluate the best time for the stimulus with ZyA (5mg/mL). The cells
were stimulated (A) for 15 min, 30 min, 1, 2, 4, 6, 8, 24 hours for ROS and (B) 15 min, 30 min, 1, 3, 5, 7, 23 hours for NO. The data represente the Mean ± SEM of three independent experiments performed in triplicate
3.4 Is the p38 pathway involved on the regulation of ZyA-induced microglia
activation promoted by the ACM?
Several studies have shown that the p38 pathway play a significant role in the activation of microglia cells. In order to understand if the modulation of microglia reactivity by the ACM involves this pathway we have used, as a tool, the p38 inhibitor SB239063.
The microglia cultures were pre-incubated with ACM or DMEM (control) plus the p38 inhibitor SB239063 (20 µM) for 24 hours before the stimulation with ZyA. Two hours after adding ZyA to the culture medium the amount of ROS produced was measured (Figure 11).
If the p38 pathway was involved in the regulation of microglial activity by the ACM, the use of the antagonist should have blocked the action of the ACM itself, thus impeding the decrease in ROS production. According to the results, it was not possible to determine whether there was a decrease in production of ROS, when the p38 inhibitor was used, since there was no significant response with ZyA. In conjunction with these experiments the group performed other experiments with the same stimulus, at different concentrations. The concentration of ZyA used was 0.5 µg/mL. We found this concentration provided better results, which led us to ask whether the concentration of 5 µg/mL was not too high, for this new culture. The results for the changes in NO levels induced by ZyA 0.5 µg/mL were also stronger (Appendix 1, Figure 14). As such, we decided to use a lower concentration of ZyA.
To evaluate the microglial activation, the amount of NO produced by the cells when stimulated with 0.5 µg/mL of ZyA was measured (Figure 12). Once again the effect of p38 inhibitor was evaluated and confirmed some past results obtained by our group, where ACM was able to modulate microglial activation, reducing the amount of ROS produced.
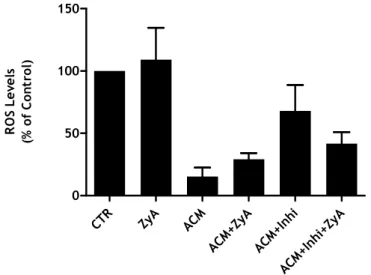
CTR ZyA ACM ACM +ZyA ACM +Inh i ACM +Inh i+Zy A 0 50 100 150 R O S L e v e ls (% o f C o n tr o l)
Figure 11: Effect of p38 inhibitor on microglial activation induced by ZyA. Microglia cells were
stimulated with ZyA (5 µg/mL) 24 after the addition of p38 inhibitor. The data represente the mean ± SEM of three replicates from two independent experiments.
As shown in figure 12, incubation with ACM totally inhibited the increase of NO production induced by ZyA exposure. However, the presence of the p38 inhibitor SB239063 reverted the effect of the ACM. Taken together this results suggest that the effect of GDNF in controlling the production of NO, and thus the reactivity of microglia, involves the participation of the P38 pathway.
Since previous studies from our group showed that GDNF was able to control both the production of ROS and the phagocytic activity induced by ZyA exposure we decided to
Figure 12: The effect of p38 inhibitor and exogenous GDNF on microgial activation induced by ZyA.
The cells were treated with 0.5µg/mL ZyA, 24 hours after the addition of GDNF and p38 inhibitor. Five hours after adding ZyA the amount of NO was measured. The data presented represente the mean ± SEM
of three replicates from five independent experiments. Statistical analysis was performed usingone-way
ANOVA followed by Bonferroni’s Multiple Comparison Test (*p<0.05, ** p<0.001)
Figure 13: ACM and GDNF suppress microglia activation promoted by ZyA and p38 inhibitor is involved in microglia activation. The cells were treated with 0.5µg/mL ZyA, 24 hours after the addition of GDNF, p38
inhibitor and ACM. 24 hours after the stimulus with ZyA the cells were incubated with fluorescent polystyrene microspheres. The data presented represente the mean ± SEM of XXXXX replicates from three independent experiments. Statistical analysis was performed using one-way ANOVA followed by Bonferroni’s Multiple Comparison Test (*<0.05, *** p<0.0001). Contr ol ZyA ACM ACM +ZyA ACM +Inh i ACM +Inh i+Zy A GDNF GDNF +ZyA 0 20 40 60 80 100
***
***
*
P h a g o c y ti c C e ll s (% o f C o n tro l) Cont rol ZyA ACM ACM +ZyA ACM +Inh i ACM +Inh i+Zy A GDNF GDNF +ZyA 0 50 100 150***
*
N O L e v e ls (% o f C o n tr o l)determine if GDNF was controlling the phagocytic activity of microglia also through the p38 pathway. The results presented in figure 13 showed that in presence of the p38 inhibitor the ACM was unable to impede the increase in the phagocytic activity induced by ZyA. Nevertheless, the effect of the inhibitor in the presence of exogenous GDNF is crucial to conclude about the involvement of p38 in the regulation of microglia phagocytic activity by GDNF.
Chapter 4
Discussion/Conclusion
It is well known that one of the main factors of PD is neuroinflammation. This results from an overactivation or a dysregulation of microglial cells (Block et al. 2007), which becomes activated during an external injury (Ouchi et al. 2009). Although microglial cells can be responsible for the development of neurodegenerative diseases; microglia is also capable of mediating protective effects by releasing trophic factors (Teismann & Schulz 2004). Moreover, GDNF has been reported to promote neuronal survival and rescue injured dopamine neurons in several animal models of PD (Gao & J.-shyong Hong 2008). The elevated release of GDNF is one of the major mechanisms by which activated astrocytes exert their neuroprotective effects (Gao & J.-shyong Hong 2008).
This study examined the significance of GDNF on microglial activation, while attempting to understand what are the pathways through which GDNF can effectively regulate microglial activation and therefore regulate the process of neuroinflammation.
This study is based upon a previous work conducted by our group, which found that neurotrophic factors, namely GDNF, present in media conditioned by astrocytes; was capable of regulating microglia activation induced by exposure to ZyA by decreasing the amount of ROS produced and the phagocytic activity of these cells. In order to better understand the role of GDNF in the process of neuroinflammation this study aimed at deepen on the signaling pathways by which GDNF promotes the regulation of microglia cells. Once our group had previously tested the effect of GDNF on microglial activation in a cell culture also characterized and described by the group (Cristóvão et al. 2010) we started by using this cell culture methodthat is based on the procedure described by Giulian & J. Baker (1986), with some modifications. This technique is based in the knowledge that when mixed glial cultures are shaken they easily detach from the culture plate, whereas astrocytes remain attached (Giulian & J. Baker 1986). However the results were different from those observed previously and lead us to suspect that the low cell density observed in the cultures could compromise the results.
In order to increase the cell density the protocol was changed; the mixed cultures were prepared by enzymatic digestion with papain and astrocytes were removed from the mixed culture by trypsinization while the microglial cells remain attached to the culture plates (Gordo et al. 2006). The initial findings showed that with the trypsinization protocol, the cell density obtained was higher and the percentage of contaminant astrocytes was much lower than the one obtained with the shaking method. These observations are in accordance with the study of Gordo and coworkers (2006). It is important to note that a critical factor in this protocol was the duration of the trypsinization since longer trypsinization periods easily
induce the detachment of microglial cells. A second adjustment to the initial protocol was the inflammatory agent used (i.e. ZyA was replaced by LPS).
ZyA is a selective inflammatory agent, to the extent that it only interacts with the microglia and does not affect neurons or the astrocytes (Sweitzer et al. 1999). ZyA is commonly used to stimulate ROS production in immune cells, including microglia, and this effect is mediated via activation of NADPH oxidases (Harrigan et al. 2008). This change was due to the low percentage of cells activated in comparison with the control, although previous results have demonstrated that at a concentration of 5 µg/ml the percentage of cells activated was high and ZyA increased the number of activated microglia in a concentration-dependent manner (Cristóvão et al. 2010).
In order to obtain better results, it was decided that LPS as inflammatory agent was to be used, instead of using ZyA, since it is well described in the literature as a powerful activator of microglia. LPS, an endotoxin, is a principal component of the outer membrane of Gram-negative bacteria and a potent activator of innate host immune responses. LPS has no direct effect on neurons and its neurotoxicity is entirely dependent on the activation of microglia (Gao & J.-shyong Hong 2008). LPS has been shown to activate microglial cells through the TLR-4, leading to the production of pro-inflammatory mediators such as cytokines, reactive oxygen species, NO, and eicosanoids (Qian et al. 2006).
To determine the action of the GDNF in these new cell cultures, it was necessary to characterize how this culture responds to the stimuli used. Since the trypsinization is an aggressive procedure that possibly stimulates microglia reactivity we decided to determine the response of microglial cultures to the inflammatory agent 2, 5 and 8 days after the trypsinization. Although no significant differences were obtained in the ROS production induced by LPS after 2, 5 or 8 days the morphology of the cells showed some differences. During the first two days after trypsinization a great number of cells exhibited around amoeboid morphology, characteristic of a reactive status, whereas at the fifth day after trypsinization the majority of the cells exhibited an intermediate morphology. The cultures did not acquired the typical morphology of a “resting state”, even after a month in culture.
We therefore may say that the cells were taking an intermediate state. Although they did not
present a typical morphology, the percentage of amoeboid microglia was minimal or non-existent. However, despite of having been chosen for the fifth day, it was found that the response of the cells to the LPS was weak.
These results caused us to think that the concentration of LPS used could have been too high, promoting cell death. However, the test of MTT has demonstrated that the concentration of LPS used was not enough to promote cell death. Previous results showed by our group (Rocha et al. 2011) demonstrate that ACM can effectively reduce the amount of ROS produced by microglia cells. Astrocytes can modulate microglial inflammatory responses by decreasing microglial ROS level (Min et al. 2006). ACM might exert this effect by increasing the expression of microglial antioxidant enzymes (Shih et al. 2006).