UNIVERSIDADE DA BEIRA INTERIOR
Engenharia
Unpressurized Light Aviation Aircrafts
Flight and Physiological Data Acquisition System
André Emanuel Castro Marques
Dissertação para Obtenção do Grau de Mestre em
Engenharia Aeronáutica
(2
ociclo de estudos)
Orientador: Prof. Doutor Jorge Miguel dos Reis Silva
v
Dedicatory
I dedicate this work to my family, friends and all the people that help me along this journey to fulfill a dream.
vii Look at the sky. We are not alone. The whole universe is friendly to us and conspires only to give the best to those who dream and work.
ix
Acknowledgements
I would like to express my regards to my parent’s that in all these years of study have financed my education and always supported me, and friends for all the support and good moments we have experienced in these 5 years, and my master’s thesis adviser Professor Jorge Miguel dos Reis Silva for all the support, assistance and commitment to this work. Special thanks to FCT (Fundação para a Ciência e Tecnologia) for the MSc Grant under AIRDEV (Business Models for Airport Development and Management) Project in partnership with MIT – Portugal Program (Reference: MIT- PT-TSAAs/0046/2008).
Special thanks to Nonin Medical Inc. for supporting this work with the cerebral oximetry equipment.
Special thanks to the OMNI Aviation Training Center for the assistance and availability for flight tests.
Special thanks to the Portuguese Air Force for the authorization to conduct Hypobaric Chamber tests in the Aeronautical Medical Center.
Special thanks to the Department of Sport Sciences of the University of Beira Interior for the Garmin Forerunner 305.
Special thanks to the Department of Informatics of the University of Beira Interior and to the Informatics Engineering Department of the Superior School of Technology of the Polytechnics Institute of Tomar for the assembly of the Atmospheric Sensors Board and the creation of specific software.
Finally my special thanks to all other persons that in some way helped me in the development of this work.
xiii
Abstract
The majority of light aviation aircrafts have non pressurized cabins that may pose risks for the safety of both pilots and passengers. As altitude increases partial oxygen pressure decreases and this situation may lead to early stages of hypoxia affecting pilot’s capabilities to perform simple tasks. In addition temperature also changes as altitude increases. All these factors combined in several ways may affect significantly the capability of a pilot to conduct a safe flight.
Some work has been developed in this area and results show that even small changes in altitude can decrease pilot’s oxygen level significantly. Thus, as pilot’s behavior and flying capabilities can be affected, flight safety may be compromise too.
This work is generally focused on the acquisition and study of flight operational and physiological data, to perform such objectives data acquired from the aircraft contains several items as geographic coordinates, attitude, altitude, speed, g-load, heading, absolute pressure and temperature inside the cabin; also data acquired from the pilot contains cerebral oximetry, and electroencephalogram (EEG) and electrocardiogram (ECG) parameters.
During the flight pilot’s own safety and comfort are important issues so that we developed a portable system that may be installed and operated in a safe and ergonomic way inside a light (small) aircraft cabin. This equipment is also flexible enough so that it may be used inside a hypobaric chamber or in a flight simulator to test prior a real flight some specific pilot’s reactions to different flight scenarios.
The specific objective of this work is to report the acquisition, processing and monitoring of flight data collected directly and in real time from the aircraft and the pilot, so it may be analyzed to determine pilot’s major physiological changes and the consequents alterations of his flying capabilities.
Taking in account either the results of this work or the flight safety boundaries we also sustain the basis for a revision of the actual European legislation for pilot licensing.
Keywords
Light Aviation, Flight Safety, Unpressurized Cabins, In-flight Data Acquisition, Monitoring System
xvii
Resumo
A maioria das aeronaves que pertencem à aviação ligeira não possuem cabina pressurizada o que pode ser perigoso para a segurança de pilotos e passageiros. Com o aumento da altitude a pressão parcial do oxigénio diminui e esta ocorrência pode levar a sintomas iniciais de hipóxia que podem afetar a capacidade do piloto de realizar tarefas simples. Em adição à diminuição da pressão a temperatura também diminui com o aumento da altitude e todos estes fatores podem combinar-se de várias formas e afetar significativamente a capacidade do piloto de efetuar o voo em segurança.
Tem vindo a ser desenvolvido algum trabalho nesta área e os resultados indicam que pequenas variações de altitude podem diminuir o nível de oxigenação do piloto de forma significativa. Desta forma como o comportamento do piloto e as suas capacidades de pilotar a aeronave podem ser afetadas a segurança do voo também pode ser comprometida.
O objetivo geral deste trabalho consiste na aquisição e análise de dados de voo da aeronave assim como de dados fisiológicos do piloto; para realizar os objetivos propostos os dados adquiridos da aeronave contêm vários parâmetros como coordenadas geográficas, atitude, altitude, velocidade, cargas g, direção, pressão absoluta e temperatura do interior da cabina; assim como os dados fisiológicos do piloto contêm oximetria cerebral, eletroencefalograma (EEG) e eletrocardiograma (ECG).
Durante os voos a segurança e conforto do piloto são fatores importantes pelo que foi desenvolvido um sistema portátil que pode ser instalado e operado de uma forma segura e ergonómica dentro de uma cabina de uma aeronave da aviação ligeira. Este equipamento também foi pensado para poder ser usado numa câmara hipobárica ou num simulador de voo para efetuar testes precedentes a voos reais para testar a reação do piloto a diferentes cenários de voo.
O objetivo específico deste trabalho é a descrição da aquisição, processamento e monitorização de dados recolhidos diretamente e em tempo real da aeronave e do piloto, para que sejam analisados e seja determinado as alterações na fisiologia do piloto e as consequentes alterações das suas capacidades de pilotar a aeronave.
Tomando em considerações quer os resultados deste trabalho quer os padrões da segurança do voo este trabalho também sustem informação relevante para uma revisão da atual legislação Europeia para licenças de pilotos.
xviii
Palavras-chave
Aviação Ligeira, Segurança de Voo, Cabinas despressurizadas, Aquisição de Dados Voo, Sistema de Monitorização
xxi
Table of Contents
Dedicatory ... v Acknowledgements ... ix Abstract ... xiii Resumo ... xviiTable of Contents ... xxi
List of Figures ...xxv
List of Graphics ... xxix
List of Acronyms ... xxxiii
1. Introduction ... 1
1.1 Motivation ... 1
1.2 Object and Objectives ... 1
1.3 Dissertation Structure ... 2 2. State of Art ... 3 2.1 Introduction ... 3 2.2 Earth’s Atmosphere ... 3 2.3 Hypoxia ... 4 2.3.1 Hypoxia Types ... 4 2.3.2 Hypoxia Symptoms ... 4 2.3.3 Hyperventilation ... 5
2.3.4 Impact of Hypoxia on General Aviation Pilots ... 5
2.4 Human Physiological Data and Flight Parameters ... 6
2.4.1 Human Physiological Data ... 6
2.4.1.1 Arterial Blood Oximetry ... 6
2.4.1.2 Electroencephalography ... 8
2.4.1.3 Electrocardiography ... 9
2.4.2 Flight Parameters ... 10
2.4.2.1 Flight Data Recorder (FDR)... 10
2.5 Physiological Monitoring of Pilot Performance ... 12
2.6 Legislation ... 13
2.6.1 International Legislation ... 13
2.6.2 United States of America Legislation ... 13
2.6.3 European Legislation ... 14 2.6.4 Portuguese Legislation... 14 2.7 Conclusion ... 14 3. Case Study ... 17 3.1 Introduction ... 17 3.2 Equipment details ... 17
xxii
3.2.1 Cerebral Oximetry System ... 17 3.2.2 Electroencephalography and Electrocardiography Device ... 18 3.2.3 Flight Data Recorder ... 19 3.3 Conclusion ... 19
4. Results ... 21
4.1 Introduction ... 21 4.2 Equipment Integration and Tests ... 21 4.2.1 EEG-SMT ... 21 4.2.2 Garmin Heart Rate Monitor ... 22 4.2.3 APM 2.0 Purple ... 23 4.2.4 Nonin Model 7600 Regional Oximeter ... 27 4.3 Hypobaric Chamber Tests ... 28 4.4 Flight Tests ... 32 4.4.1 Trial Flights ... 32 4.4.2 OMNI Aviation Training Center ... 45 4.5 Data Processing ... 54 4.6 Conclusion ... 55
5. Conclusion ... 57
5.1 Dissertation Synthesis ... 57 5.2 Final Considerations ... 58 5.3 Prospects for Future Work ... 58
References ... 59 Annex 1 – EEG-SMT Schematics ... 63 Annex 2 – APM 2.0 Purple ... 67 Annex 3 – Hypobaric Camber High Resolution Graphics ... 71 Annex 4 – MatLab Code ... 77
xxv
List of Figures
Figure 1: Atmospheric Properties (Harding, 2002). ... 3 Figure 2: Atmospheric Composition of Dry Air (Harding, 2002)... 3 Figure 3: Cerebral Oximetry Sensor Function (Nonin Medical Inc., 2012a). ... 7 Figure 4: Nonin Onyx 9500 Fingertip Pulse Oximeter (Nonin Medical Inc., 2012b). ... 7 Figure 5: EEG head sensors (ESTSP, 2012). ... 8 Figure 6: Altitude Increments (Ozaki et al., 1994). ... 8 Figure 7: ECG sensors placement (Wikipedia, 2012). ... 9 Figure 8: Philips TC50 Cardiograph (Davis Medical Inc., 2012a). ... 10 Figure 9: Philips DigiTrak XT Holter (Davis Medical Inc., 2012b). ... 10 Figure 10: Flight Data Recorder (Grossi, 2003). ... 11 Figure 11: Flight Data Recorder Parameters (Grossi, 2003). ... 11 Figure 12: Garmin aera® 500 Portable GPS (Garmin, 2012a). ... 11 Figure 13: MBU 23 oronasal (GENTEX, 2012). ... 12 Figure 14: Test Subjects (Rood et al., 2011). ... 13 Figure 15: Oronasal Mask with sensors (Rood et al., 2011). ... 13 Figure 16: Nonin Model 7600 Regional Oximetry System (Nonin Medical Inc., 2012c). ... 17 Figure 17: Olimex EEG-SMT (Olimex, 2012a)... 18 Figure 18: EEG-SMT Active and Passive Sensors (Olimex, 2012b). ... 18 Figure 19: APM 2.0 Purple (DIY DRONES, 2012a). ... 19 Figure 20: EEG-SMT Preliminary Tests. ... 21 Figure 21: Garmin Forerunner 305 and Heart Rate Monitor Strap (Garmin, 2012b). ... 22 Figure 22: APM with Power Connections. ... 23 Figure 23: APM Planner Software. ... 24 Figure 24: APM Planner Terminal Command Line Interpreter (CLI). ... 24 Figure 25: APM Jumper 1 (DIY DRONES, 2012a). ... 25 Figure 26: APM 2.0 Power Supply. ... 26 Figure 27: APM 2.0 with Power Supply Ready to Use. ... 26 Figure 28: APM GPS Test Number One (GPS Visualizer, 2012). ... 27 Figure 29: APM GPS Test Number Two (GPS Visualizer, 2012). ... 27 Figure 30: Hypobaric Chamber. ... 28 Figure 31: Sensors Shield. ... 28 Figure 32: Equipment for Atmospheric Data Acquisition in the Hypobaric Chamber. ... 29 Figure 33: Viseu Airfield Location (Great Circle Mapper, 2012). ... 32 Figure 34: CZAW ICAO Code Cruz. ... 32 Figure 35: Equipment Installation for Trial Flights. ... 33 Figure 36: LPCS Airfield location (Great Circle Mapper, 2012). ... 46 Figure 37: Cessna FR172F Reims Rocket. ... 46
xxvi
Figure 38: Equipment Installation for the OMNI Instruction Flight... 46 Figure 39: APM Logging Data File. ... 54 Figure 40: APM Logging Data after Processing. ... 54 Figure 41: Active Electrode Circuit Diagram (Olimex, 2012b). ... 64 Figure 42: EEG-SMT Circuit Diagram (Olimex, 2012a). ... 65 Figure 43: APM 2.0 Schematic (DIY DRONES, 2012a). ... 68 Figure 44: APM 2.0 Final Assembly (DIY DRONES, 2012a). ... 69 Figure 45: APM 2.0 Main Board Front Side (DIY DRONES, 2012a). ... 69 Figure 46: APM 2.0 LED Location (DIY DRONES, 2012a). ... 70
xxix
List of Graphics
Graphic 1: Cerebral Oximetry and Pressure Data. ... 29 Graphic 2: Cerebral Oximetry and Pressure Altitude. ... 30 Graphic 3: Cerebral Altitude and Temperature. ... 30 Graphic 4: Cerebral Oximetry and Humidity Data. ... 31 Graphic 5: Flight Path from Second Trial Flight. ... 34 Graphic 6: Second Trial Flight Altitude and Gyroscope Data. ... 34 Graphic 7: Second Trial Flight Altitude and Acceleration Data. ... 35 Graphic 8: Second Trial Flight Altitude and Pilot Cerebral Oximetry Data. ... 35 Graphic 9: Flight Path from Flight One. ... 37 Graphic 10: Flight One Altitude and Speed Data. ... 37 Graphic 11: Flight One Acceleration Data. ... 38 Graphic 12: Flight One Roll Data. ... 38 Graphic 13: Flight One Pitch Data. ... 39 Graphic 14: Flight One Yaw Data. ... 39 Graphic 15: Flight One Heading Data. ... 40 Graphic 16: Flight One Altitude and Pilot Cerebral Oximetry Data. ... 40 Graphic 17: Flight Path from Flight Two. ... 41 Graphic 18: Flight Two Altitude and Speed Data. ... 42 Graphic 19: Flight Two Acceleration Data... 42 Graphic 20: Flight Two Roll Data. ... 43 Graphic 21: Flight Two Pitch Data. ... 43 Graphic 22: Flight Two Yaw Data. ... 44 Graphic 23: Flight Two Heading Data. ... 44 Graphic 24: Flight Two Pilot Cerebral Oximetry Data. ... 45 Graphic 25: APM last 37minutes Flight Path from OMNI Instruction Flight. ... 47 Graphic 26: OMNI Instruction Flight last 37 minutes Altitude and Speed Data. ... 48 Graphic 27: OMNI Instruction Flight last 37 minutes Acceleration Data. ... 48 Graphic 28: OMNI Instruction Flight last 37 minutes Roll Data. ... 49 Graphic 29: OMNI Instruction Flight last 37 minutes Pitch Data. ... 49 Graphic 30: OMNI Instruction Flight last 37 minutes Yaw Data. ... 50 Graphic 31: OMNI Instruction Flight last 37 minutes Heading Data. ... 50 Graphic 32: OMNI Instruction Flight last 37 minutes Pilot Cerebral Oximetry Data. ... 51 Graphic 33: Garmin 305 and APM combine Flight Path from OMNI Instruction Flight. ... 51 Graphic 34: OMNI Instruction Flight GPS Altitude Combined. ... 52 Graphic 35: Pilot Heart Rate from OMNI Instruction Flight. ... 52 Graphic 36: Pilot Cerebral Oximetry from OMNI Instruction Flight. ... 53 Graphic 37: High Resolution Cerebral Oximetry and Pressure Data. ... 72
xxx
Graphic 38: High Resolution Cerebral Oximetry and Pressure Altitude. ... 73 Graphic 39: High Resolution Cerebral Altitude and Temperature. ... 74 Graphic 40: High Resolution Cerebral Oximetry and Humidity Data. ... 75
xxxiii
List of Acronyms
APM – Ardupilot Mega ATT – Attitude
BEC – Battery Eliminator Circuit
BGARS – Basic General Aviation Research Simulator CLI – Command Line Interpreter
CO2 – Carbon Dioxide
CSV – Comma-Separated Values CZAW – Czech Aircrafts Works DR – Diário da República ECG – Electrocardiogram EEG – Electroencephalogram EOG – Electrooculography
FAA – Federal Aviation Administration FAR – Federal Aviation Regulations FDR – Flight Data Recorder
GPS – Global Positioning System hPa – Hectopascal
HR – Heart Rate
ICAO – International Civil Aviation Organization ISA – International Standard Atmosphere
xxxiv
JAR-OPS – Joint Aviation Requirements Operation Performance Standard KML – Keyhole Markup Language
KMZ – Keyhole Markup Language Zipped LED – Light Emitting Diode
LPCS – Tires Airfield (Cascais, Portugal)
LPVZ – Gonçalves Lobato Airfield (Viseu, Portugal) MAVLink – Micro Air Vehicle Communication Protocol MBU – Mask Breathing Unity
MSL – Mean Sea Level
NIRS – Near Infrared Spectroscopy O2 – Oxygen
PPAS – Pilot Physiologic Assessment System RAW – Read And Write
rSO2 – Regional Oxygen Saturation of Hemoglobin SD – Secure Digital
SPO2 – Saturation of Peripheral Oxygen
SST/PIT – Superior School of Technology of the Polytechnics Institute of Tomar TMA – Terminal Maneuvering Area
TXT – Text File
UAV – Unmanned Aerial Vehicle VDC – Volts Direct Current
1
1. Introduction
1.1 Motivation
The majority of light aviation pilots fly their aircrafts with unpressurized cabins and this factor may become a severe risk for their safety. Hypoxia becomes a serious danger when flying in these conditions and several accidents have occurred with fatalities involved due to the altitude increase and consequent decrease in oxygen partial pressure. Hypoxia is one of the most dangerous but temperature and humidity inside the aircraft cabin also can change and affect pilot performance.
Recent works have been developed at the University of Beira Interior regarding Flight Safety and the next step in this study passes through an extended acquisition of flight and physiological data from the aircraft and pilot. After this acquisition a parallel work performed by a colleague will also be developed for the interpretation and comparison of all the collected data. With a complete review of the work area we have chosen to focus this work in the development of a flight and physiological data acquisition system that could help to improve the overall flight safety.
1.2 Object and Objectives
The object of this work is the report of all processes regarding acquisition of pilot physiology and aircraft flight data.
On one hand, a first objective of this work is the development of an in-flight system that can be used in the cabin of an unpressurized light aircraft to record data from pilot physiology and the aircraft flight. This system records information about the flight of the aircraft by acquiring several data like geographic coordinates, ground speed, attitude, altitude, g load, pressure and temperature inside the cabin. This system also acquires information from the pilot physiology, that is, data from electroencephalography (EEG), electrocardiography (ECG) and brain oximetry.
All this information is recorded and provides the flight path, the main characteristics of the flight and the physiological response of the pilot to different flight scenarios.
On the other hand, a second objective of this work is the capability for this system to be used in a hypobaric chamber or a flight simulator to test the physiological response of a pilot prior a real flight scenario.
2
1.3 Dissertation Structure
This work is divided in five main chapters.
Chapter one is the Introduction that reports the motivation to conduct this work, the main object and objectives proposed and the dissertation structure.
Chapter two is the State of Art review that reports a background check of several studies and definitions that are the basis of this work. By performing an extensive research in the scientific area this chapter concerns about all the variables that affect the safety of a flight in an unpressurized aircraft.
Chapter three reports the Case Study developed under this work based on the integration of both inputs and outputs of a portable oximetry system, an EEG and an ECG holter, and an on-board flight data acquisition system. All the equipment specifications and installation procedures are explained in this chapter.
Chapter four reports all the main Results achieved during the development of the work reported in the previous chapter (three). The integration of all systems required several preliminary tests to ensure the correct function of all the equipments and some problems in software and hardware appeared which consequently led to some delays.
Finally chapter five reports the final Conclusion of this work where a dissertation synthesis, final considerations and perspectives for future work are indicated.
3
2. State of Art
2.1 Introduction
This chapter contains a background check of several studies and definitions that are the basis of this work. By performing an extensive research in the scientific area this chapter concerns about all the variables that can affect the safety of a flight in an unpressurized aircraft.
2.2 Earth’s Atmosphere
The atmosphere provides to the human being a protective shield against radiation from space, oxygen and a moderated temperature for the survival of species. As altitude increases barometric pressure decreases exponentially producing a proportional decrease in the partial pressure of oxygen and other constituent gases (Harding, 1988; 2002), as shown in Figure 1.
Figure 1: Atmospheric Properties (Harding, 2002).
The atmosphere composition is made up of a constant mixture of nitrogen and oxygen with traces of other gases (Figure 2).
4
2.3 Hypoxia
The human body is very vulnerable and sensible to the lack of oxygen and long deprivation leads to fast deterioration of most body functions. Due to this hypoxia is one of the most serious physiological hazards that can occur when flying at altitude in an unpressurized aircraft.
Hypoxia stands for “reduced oxygen” or “not enough oxygen”. Although any tissue will die if deprived of oxygen for a long time, the main concern is with getting oxygen to the brain since any reduction in mental functions while flying can result in life-threatening errors (Harding, 2002; FAA, 2008).
2.3.1 Hypoxia Types
There are four types of hypoxia (Harding, 2002):
• Hypoxic hypoxia, or hypoxemia, that results from reduction of oxygen in arterial blood (i.e.: altitude flying due to low atmospheric pressure, heavily smoking);
• Anemic hypoxia, that occurs when blood cannot carry enough oxygen (i.e.: anemia, carbon monoxide poisoning and hemorrhage);
• Ischemic hypoxia, when oxygen cannot leave blood carriers into tissues (i.e.: low cardiac output, high G-forces);
• Histotoxic hypoxia, which takes place when tissue is not able to use oxygen taken from blood (i.e.: alcohol ingestion).
2.3.2 Hypoxia Symptoms
Hypoxia symptoms vary depending the individual but common symptoms include (Harding, 2002; FAA, 2008):
• Cyanosis (blue fingernails and lips); • Headache;
• Decrease reaction time; • Impaired judgment; • Euphoria;
• Visual impairment; • Drowsiness;
• Lightheaded or dizzy sensation; • Tingling in fingers and toes;
5 • Numbness.
2.3.3 Hyperventilation
Hyperventilation can be caused by hypoxia (Harding, 2002) and consists in the excessive rate and depth of respiration leading to abnormal loss of carbon dioxide from the blood. This condition occurs more often among pilots than its recognized and it can cause disturbing symptoms that can alarm the uninformed pilot (FAA, 1997). Hyperventilation can lead to unconsciousness due to the respiratory system’s overriding mechanism to regain control of breathing. Many symptoms of hyperventilation are similar to those of hypoxia and pilots when flying at high altitudes may came across an unexpected stressful situation and have a tendency to breathe more rapidly than normal which usually leads to hyperventilation (FAA, 2008). Common symptoms of hyperventilation include:
• Visual impairment; • Unconsciousness;
• Lightheaded or dizzy sensation; • Tingling sensations;
• Hot and cold sensations; • Muscle spasms.
2.3.4 Impact of Hypoxia on General Aviation Pilots
In August of 1967 a study was undertaken to provide some insight into the physiological responses to different flight conditions (FAA, 1967). This study main objective was to analyze the performance of a student pilot by performing tests before, during and after the flight. Preflight questionnaire consisted in a brief story of the past 24 hours of each individual regarding sleep, enthusiasm, medication, alcohol ingestion. During the flight each student pilot were fitted with different sensors for detection of different data. The post-flight questionnaire asked each individual to describe their opinions about procedures, maneuvers and overall feelings about the flight. The main results of this study show that the performance of student pilots can be affected due to the combination of altitude and stress. Although this study has several years it shows that this subject is being researched for several times and provides important information about in flight physiological monitoring.
Twenty pilots were subjected to a Hypoxia study carried out by the FAA in 1997. Ten subjects were randomly assigned to the hypoxia group, that breathed altitude equivalent oxygen mixtures, and the other ten subjects were assigned to the control group that breathed compressed air throughout the experiment. Measurements of the flight performance from the
6
Basic General Aviation Research Simulator (BGARS) and of flight-following procedures were gathered during three days. Results from this study show that significantly more procedural errors were committed by the hypoxia group during cruise flights at 10,000 feet and during the descent and approach phases of the flight from 10,000 feet. This study, although did not provide unequivocal evidence of detrimental flight performance due to mild hypoxia found during the cruise segments at 8,000, 10,000 and 12,500 feet simulated altitudes also states that hypoxia is a condition that can develop itself at altitudes under 12,500 feet depending on the pilot individual tolerance to hypoxia. Observed performance during the descent and approach phases of flight was considered to be generally unsafe with potential dangerous outcomes (FAA, 1997).
(Rocha, 2011) performed a study about the impact of hypoxia in sport aviation by measuring the cerebral oximetry of different pilots when flying in unpressurized gliders. Six flights were performed during the summer season when hot air and updrafts provides good conditions for glider flights. The maximum altitude of 3,600 feet was reached in the 5º and 6º flights and different pilots were equipped with a cerebral oximetry monitor system during the duration of the flights. All data were collected and analyzed and although the maximum altitude was just 3,600 feet, results show a significant change in cerebral oximetry saturation levels.
2.4 Human Physiological Data and Flight Parameters
The human body has different physiological reactions to different environment scenarios. When flying in an unpressurized aircraft the changes in the cabin environment can be significant and the acquisition of human physiological parameters becomes very important. Information regarding the flight dynamics of the aircraft it is important to understand the impact of possible physiological changes in the behavior and flight capabilities of the pilot.
2.4.1 Human Physiological Data
2.4.1.1 Arterial Blood Oximetry
The arterial blood oximetry consists in measuring the amount of oxygen that is carried by hemoglobin. This procedure consists in a LED light source that emits light with different wavelengths that passes through arterial blood until reaching the light receptor as displayed in Figure 3. The difference between the wavelengths that were emitted and received is measured and through that difference it’s possible to determine the amount of oxygen in the hemoglobin cells. The measurement of arterial blood oximetry can be done in several parts of the human body but the most common in the case of an adult is a fingertip sensor that
7 measures pulse oximetry, or sensors that are placed on the forehead to measure cerebral oximetry.
Figure 3: Cerebral Oximetry Sensor Function (Nonin Medical Inc., 2012a).
Pulse oximetry as shown in Figure 4 measures the peripheral oximetry of arterial blood that flows through the extremities away from any vital organ. This type of measurement was used in a study in 2009 where glider pilots were fitted with pulse Oximeter in a finger during flights (Fonseca, 2009). During flights the placement of the equipment in the finger was complicated due to the humidity on board that cause problems in the fix of the device to the finger. Also the position of the device in a finger lead pilots to bump several times the device against surfaces and equipments in the cabin.
Figure 4: Nonin Onyx 9500 Fingertip Pulse Oximeter (Nonin Medical Inc., 2012b).
The monitoring of cerebral oximetry by sensors that are placed in the forehead provides a more central measure of blood hemoglobin oxygen. A study performed in 2010 to United States Navy pilots show that a forehead sensor is more sensitive to altitude induced changes in cerebral oximetry (Simmons et al., 2010). This study also states that although the forehead oximetry has good sensitive and accuracy there are significant modifications required to eliminate dropped measurements due to motion before it can be fully applied in military
8
aviation applications. It’s important to refer that this study was performed taking in account a military and not a civil use. Operational requirements for use in a military environment are much higher than operational requirements for use in a civil environment.
2.4.1.2 Electroencephalography
Electroencephalography consists in the recording of electrical activity of the brain over a certain time (Figure 5) and the recording of this electrical activity is named electroencephalogram (EEG). Brain electrical activity is very sensitive to its oxygen supply and when there is a lack of oxygen to the brain this may produce several types of changes in the EEG. These changes are regarded as a useful method of evaluating the functional state of the brain under hypoxic conditions (Meyer and Gastaut, 1961).
Figure 5: EEG head sensors (ESTSP, 2012).
Multichannel human EEG signals were studied topographically simultaneous with electrocardiography and vertical eye movement in fifteen students ranging in age from 19 to 25 years old. These students were exposed to an atmosphere of reduced air pressure in an experimental high altitude chamber (Ozaki et al., 1995).
Figure 6: Altitude Increments (Ozaki et al., 1994).
The rate of change in altitude was constant at 150 meters per minute and each altitude condition was maintained for 25 minutes as displayed in Figure 6. At each altitude levels the subjects were asked to write their names and to complete a 50 item questionnaire regarding their subjective state. Results from this work show that even under the condition of 3,000
9 meters the subject’s brain activity may start to become affected and suggest that the first stage of hypobaric hypoxia is characterized by selective suppression of alpha EEG activity. Current EEG machines are very advanced and are capable of simultaneously acquire and record the electric activity of several areas of the human brain. There are two types of EEG equipment; Professional machines with a higher number of recordings channels and therefore a higher quality and precision are heavy and voluminous pieces of equipment. Portable machines named “Holters” are simpler devices with fewer recording channels, compact size and battery powered that allow a more practical and less uncomfortable use to the individual submitted to the test. In this work the search for equipment that can perform an EEG to a pilot while flying the aircraft lead to the immediately choice of an EEG Holter machine.
2.4.1.3 Electrocardiography
Electrocardiography consists in the recording of electrical activity of the heart during a certain period of time (Figure 7) and the recording of this electrical activity is named electrocardiogram (ECG). Heart electrical activity is used to measure the rate and regularity of heartbeat as well as the presence of any damage to the heart. This exam can also measure the level of stress of an individual by analyzing heartbeat and breathing frequency.
Figure 7: ECG sensors placement (Wikipedia, 2012).
A study performed within a group of 10 subjects performing a fast cable car ascent from 990 meters to 2,700 meters revealed that the heart rate (HR) increased and that cardiovascular and central nervous systems are already affected by the reduced amount of oxygen at an altitude of 2,700 meters (Guger et al., 2005).
Current ECG machines can record several derivations of the human’s hearth electrical activity with elevated precision (Figure 8). Due to engineering and technological development
10
nowadays it’s possible to perform a complete ECG using a portable ECG Holter. This machine is powered by a small battery and all the components are storage inside a small case which provides to the individual that is submitted to the test a great mobility with very few restrictions (Figure 9). Due to these capabilities the ECG Holter machine is the selected device to use in this study.
Figure 8: Philips TC50 Cardiograph (Davis Medical Inc., 2012a).
Figure 9: Philips DigiTrak XT Holter (Davis Medical Inc., 2012b).
2.4.2 Flight Parameters
2.4.2.1 Flight Data Recorder (FDR)
A Flight Data Recorder is displayed in Figure 10 and is a device that records several flight parameters of an aircraft.
11
Figure 10: Flight Data Recorder (Grossi, 2003).
With the evolution of air transport and flight recording technology today’s FDR are capable of digital recording several information from multiple equipment in an aircraft (Grossi, 2003).
Figure 11: Flight Data Recorder Parameters (Grossi, 2003).
There are several types of FDR from the most complete that are used in commercial aviation and can collect information from many different variables (Figure 11) to those find in a form of a GPS device (Figure 12) that can assist a pilot during flight and at the same time save some flight parameters. The vast majority of light aviation aircrafts are old machines and don’t have any type of FDR on board. Due to this the implementation of a FDR specific to light aviation aircrafts that records important flight parameters, such as geographical coordinates, ground speed, G loads and aircraft attitude, is an important step to increase flight safety.
12
2.5 Physiological Monitoring of Pilot Performance
The monitoring of pilot performance in an unpressurized aircraft, when flying at general altitudes, can be obtained by analyzing different physiological parameters during the flight. In August of 1967 a study was performed by the FAA were students pilots where equipped with different sensors to acquire different physiological data (FAA, 1967). Each subject was fitted with stainless steel plate electrodes in the chest for detection of ECG data and adhesive type electrodes were placed in the outer corner of the eye to perform an electrooculography (EOG). The EOG consist in a technique for measuring the resting potential of the retina and consequent eye movement. Microphones where also fitted in the cockpit to record all the conversation between student pilot and instructor in order to compare several instructions given to the student pilot to his physiological response.
Based on Rood et al. (2011) a Pilot Physiologic Assessment System (PPAS) is being developed to collect physiological measurements in an aircraft and predict, detect and alert the user of hypoxic state in real time. This system will be capable of measuring exhaled oxygen (O2) and carbon dioxide (CO2), ventilation, oxygen saturation (SPO2), cardiovascular data and environmental temperature and pressure by the use of several sensors in an MBU 23 oronasal oxygen mask (Figure 13, 14 and 15).
13
Figure 14: Test Subjects (Rood et al., 2011).
Figure 15: Oronasal Mask with sensors (Rood et al., 2011).
2.6 Legislation
A review of the legislation that affects unpressurized aircrafts was performed with the objective to understand the requirements regarding supplementary oxygen systems. The results of this review are the following.
2.6.1 International Legislation
International Civil Aviation Organization Annex (Adapted from ICAO, July 2001: ATT 2.A-1) states that:
“A flight to be operated at flight altitudes above 10,000 feet shall not be commenced unless sufficient stores breathing oxygen is carried to supply all crew members and 10 per cent of the passengers for any period in excess of 30 minutes that altitude will be between 10,000 and 13,000 feet or all the crew and passengers for any period that the altitude is above 13,000 feet”.
2.6.2 United States of America Legislation
United States law follows Federal Aviation Regulations Part 91.211 (FAR, April 2012) which states:
“No person may operate a civil aircraft of U.S. registry above 12,500 feet (MSL) up to and including 14,000 feet (MSL) unless required minimum flight crew is provided with and uses supplemental oxygen for that part of the flight at those altitudes that is of more than 30
14
minutes duration; at cabin pressure altitudes above 14,000 feet (MSL) unless the required minimum flight crew is provided with and uses supplemental oxygen during the entire flight time at those altitudes and at cabin pressure altitudes above 15,000 feet (MSL) unless each occupant of the aircraft is provided with supplemental oxygen”.
2.6.3 European Legislation
European law is based in the Joint Aviation Requirements Operational Performance Standard 1.775 (JAR-OPS, May 2007: 1-K-13) that states:
“An operator shall not operate an unpressurized airplane at altitudes above 10,000 feet unless supplemental oxygen equipment, capable of storing and dispensing the oxygen supplies required, is provided. An airplane intended to be operated at pressure altitudes above 10,000 feet shall be provided with equipment capable of storing and dispensing the oxygen supplies required”.
2.6.4 Portuguese Legislation
Portuguese law follows the European law based on the JAR-OPS 1.775 by the Decreto-lei 289/2003 de 14 Novembro (Adapted from DR, 2003: 7687) which states:
“The captain of the flight has the responsibility to ensure that all crew members use supplemental oxygen when flying at an altitude above 10,000 feet for a period of time longer than 30 minutes or when flying at an altitude above 13,000 feet”.
2.7 Conclusion
Taking in account all the information presented, flying in an unpressurized aircraft can become a danger activity when altitude increases. Hypoxia is the main danger to the pilot but the diminishment of partial oxygen pressure when altitude increases can also affects other physiological parameters like EEG and ECG.
Legislation analyzed determines that until 10,000 feet there isn’t necessary the use of any supplemental oxygen although there are some studies that show that hypoxia can begin at altitudes below 10,000 feet.
Despite human physiological monitoring is a well studied area with several work developed the physiological monitoring of pilot performance in unpressurized aircrafts is a research area with few specific studies.
15 Information regarding cabin environment properties and flight parameters of the aircraft combined with cerebral oximetry, electroencephalogram (EEG) and electrocardiogram (ECG) data from a pilot when submitted to different flight scenarios should provide an excellent complement to the development of an in-flight monitoring system and should improve flight safety of general aviation with unpressurized aircrafts.
17
3. Case Study
3.1 Introduction
With the main objective of this work being the development of a system that acquires both physiological data from the pilot and flight data from the aircraft the equipments used to achieve such goal were based in a portable oximetry device, an EEG and ECG holter and an on-board flight data acquisition.
3.2 Equipment details
3.2.1 Cerebral Oximetry System
Figure 16: Nonin Model 7600 Regional Oximetry System (Nonin Medical Inc., 2012c).
The Nonin Model 7600 Regional Oximetry (Figure 16) is a device with American and European Medical certification. It is simple, versatile and intuitive to the user and has one of the most advanced technologies in Near-Infrared Spectroscopy (NIRS) that eliminates surface effects isolating measurements of the cerebral cortex and provides both trend and numerical rSo2 values. Nonin Model 7600 system offers the latest Bluetooth wireless technology connectivity and two sensors with great precision regardless of skin type, features or blemishes. This equipment has a battery life of approximately 3 hours that can be storage in temperatures from -40 to 70º C (-40 to +158º F) and it can be operated in temperatures between 0 to 40º C (+32 to +104º F) with humidity varying from 10 to 90% non-condensing and up to 3,700 meters (12,000 feet), (Nonin Medical Inc., 2012).
18
3.2.2 Electroencephalography and Electrocardiography Device
Figure 17: Olimex EEG-SMT (Olimex, 2012a).
The Olimex EEG-SMT shown in Figure 17 is a module unit that performs the recording of electrical activity along the scalp providing an electroencephalogram (EEG) and also has the technical capabilities to perform an electrocardiogram (ECG).
Figure 18: EEG-SMT Active and Passive Sensors (Olimex, 2012b).
With two channels each one with two sensors (Figure 18) the EEG-SMT (Olimex, 2012a) has a very low price when compared with professional EEG devices and is based in the OpenEEG project (OpenEEG, 2012). This device requires a connection to a computer to provide power supply and appropriate software for signal acquisition.
19
3.2.3 Flight Data Recorder
Figure 19: APM 2.0 Purple (DIY DRONES, 2012a).
The APM 2.0 Purple is an autopilot used in UAV aircrafts with compact size and different sensors integrated (Figure 19). This board has 3 axis gyroscopes and accelerometer, 10 Hz GPS, Magnetometer, 16 MB micro SD card, pressure and temperature sensors that allow the acquisition of several aircraft flight data (DIY DRONES, 2012a). This device can be powered by a direct connection to a computer for power supply and data storage or by using a battery and saving information in the Micro SD Card.
Enhanced images from the APM 2.0 Purple can be consulted in Annex 2.
3.3 Conclusion
The combination of these equipments can provide several data from the aircraft flight dynamics that can be analyzed together with physiological data from the pilot. After a flight test all the data from the different equipments will be downloaded to a computer and processed to match the same timeline. The most complex equipment is the EEG-SMT which can lead to more complex connections and operation to achieve the desired results, on the other hand regarding the Nonin Model 7600 and the APM 2.0 these devices can operate with their own power supply and memory which make them more versatile to work with.
21
4. Results
4.1 Introduction
The integration of all the previous mentioned systems required many preliminary tests to ensure the correct function of all the equipments. Several tests were made and some problems in software and hardware appeared which consequently led to some delays due to the repair time necessary.
4.2 Equipment Integration and Tests
4.2.1 EEG-SMT
Initial tests with the EEG-SMT device led to good results in the capture of brain activity. A test was performed using 1 x Olimex EEG-SMT, 4 x EEG-AE Active electrodes, 1 x EEG-PE Passive electrode and BrainBay an open source software for biosignal project. (Figure 20) shows precisely the test subject fitted whit four active electrodes in the forehead and one passive electrode in the earlobe; during the test the subject was asked to close his eyes and relax and then when indicated he would open his eyes.
Figure 20: EEG-SMT Preliminary Tests.
This exercise was repeated several times and the results of these actions were captured by the software but due to hardware malfunction in one of the latest tests data coming from the device started to be strange with heavy interference and very poor detail. After some investigation a problem in the sensors and internal components of the device was found and
22
this lead to the withdrawal of the device from future work. With this malfunction being a major setback to the development of the work replacement equipment was needed and a search for alternative equipment was started. After analyzing all possibilities a request for EEG and ECG Holter was made to local medical entities but no one of the devices was available for a long period of time needed to performed several flight tests in different locations. The solution found to solve this problem was the use of a Garmin Forerunner 305 for Heart Rate Monitor and the withdrawal of the possibility to record brain activity.
4.2.2 Garmin Heart Rate Monitor
Forerunner Model 305 is a compact device in a form of a watch that allows heart rate monitoring and is vastly used by athletes (Figure 21). This device records heart rate using a strap placed in the chest that is powered by a small battery and sends all the information to the watch using wireless ANT protocol (Garmin, 2012b).
Figure 21: Garmin Forerunner 305 and Heart Rate Monitor Strap (Garmin, 2012b).
Model 305 main features:
• GPS: High-Sensitivity SiRFstarIII™ architecture;
• Wireless: Communication between system devices via ANT protocol; • Weight: 77 grams;
• Display (WxH): 33mm x 20.3mm;
• Physical size (WxHxD): 53.3mm x 17.8mm x 68.6mm; • Battery Life: 10 hours (typical use).
Heart Rate Monitor Strap Features:
• Physical size (WxHxD): 348mm x 35.6mm x 12.7mm; • Transmission range: approximately 3m;
• Battery: 3 years (1 hour per day)/CR2032 (3 volts); • Weight: 21 grams.
23 This device is used by many athletes and has good reliability and precision. Some tests to learn the correct placement of the Heart Rate Strap and how to download all the data collected were made and good results from heart beat frequency and GPS position accuracy were achieved. When analyzing all the information collected it was noticed that the frequency in which all the data is storage it’s not fixed at any time interval and depends directly of a change in the heart rate. If the heart rate stays stabilized in a certain value the equipment record the correspondent GPS information only for the initial value and will only record new data when a heart rate change occur.
4.2.3 APM 2.0 Purple
The APM 2.0 Purple (Figure 22) required some soldering to connect the shield, with GPS receiver, magnetometer and Micro-SD card to the main board. After this procedure and following manufactures instructions the startup and initial test of the board began with the upload of the current ArduPlane firmware.
Figure 22: APM with Power Connections.
The firmware Arduplane is based in MAVLink, Micro Air Vehicle Communication Protocol, (QGroundControl, 2012) and is used for UAV Auto Pilot control. This firmware upload was performed by using the APM Planner control and management software. After the firmware upload the next step was to test all the APM 2.0 sensors by using its USB connection and APM Planner software (DIY DRONES, 2012b). These tests consisted in movements of the board to test the gyroscope and accelerometer and outside journeys to GPS signal acquisition.
24
Figure 23: APM Planner Software.
Figure 24: APM Planner Terminal Command Line Interpreter (CLI).
During the tests positive results with good values from the attitude sensors as well as good geographical coordinates from the GPS could be viewed live in the APM Planner software (Figure 23) but the logging function of the memory card had some malfunction. After some research and contact with the manufacturer a reset to factory default settings was made to the APM 2.0 board and the logging function started working properly along with all the other sensors. In order to activate the logging function and determine which parameters to record it was necessary to connect the APM 2.0 to a computer with APM Planner software and then access the Command Line Interpreter (Figure 24). The ArduPlane firmware allows the recording of several information and the chosen were GPS data saved at 10Hz, raw accelerometer and gyroscope data saved at 50Hz and basic attitude data saved at 10Hz. GPS data contains:
• Time of the Day (UTC); • GPS Fix Status;
• Number of Locked Satellites; • GPS Latitude;
• GPS Longitude;
• Filtered GPS and Barometric Altitude at Mean Sea Level, MSL; • GPS Altitude, using World Geodetic System 84;
25 • GPS course.
Accelerometer Data contains: • Measured Acceleration, ax; • Measured Acceleration, ay; • Measured Acceleration, az. Gyroscope Data contains:
• Measured angular rate, ϕ; • Measured angular rate, θ; • Measured angular rate, ψ.
Although the APM 2.0 has a pressure and temperature sensor the ArduPlane firmware doesn’t allow the recording in the logging function of any raw data coming from these sensors. The firmware only allows the monitoring of temperature and pressure through a direct connection to the APM Planner software.
With all the systems working the next step was the connection of a battery power supply to the APM 2.0 board that can be powered by the input side with jumper 1 OFF or by the output side with jumper 1 ON. Following initial manufacturing advice the power supply was connected to the output side with jumper 1 ON (Figure 25).
Figure 25: APM Jumper 1 (DIY DRONES, 2012a).
The APM board has a current consumption of approximately 200 milliamps with an input voltage between 5 VDC and 6 VDC. Power to the APM is obtain by a Zippy 1000 milliamps battery and a Turnigy BEC voltage regulator providing an input voltage around 5.24 VDC (Figure 26).
26
Figure 26: APM 2.0 Power Supply.
With power supply being provided to the APM board more trial tests were performed to all the systems by placing the equipment in a car (Figure 27) and driving around Covilhã city. In these tests the equipment was placed in the roof of the car until a GPS signal lock was made and then it was moved into the trunk of the car when a reset to sensors calibration were made and the trip began.
Figure 27: APM 2.0 with Power Supply Ready to Use.
After the car trip, the data was downloaded from the APM 2.0 Micro SD Card using APM Planner that automatically creates a TXT file with all the data as well as KML and KMZ files for geographical path visualization in Google Maps or similar software (Figures 28 and 29).
27
Figure 28: APM GPS Test Number One (GPS Visualizer, 2012).
Figure 29: APM GPS Test Number Two (GPS Visualizer, 2012).
The analysis of all data recorded during test trips gave very good results from all the sensors and the vast amount of data collected led to the development of specific procedures to optimize the processing of future collected data.
4.2.4 Nonin Model 7600 Regional Oximeter
The Nonin Cerebral Oximeter is a medical device with American and European certification that is used in several national hospitals. The tests performed to this device were based in the downloading of data collected and the understanding of all the hardware and software specifications with particularly attention to the memory capacity and battery condition of the device used. This device records a new value at each 4 seconds and uses specific software that allows the download of a CSV file with all the data recorded that is exported using a RS232 cable or a Bluetooth connection.
28
4.3 Hypobaric Chamber Tests
The Portuguese Air Force conducts flight physiology training to pilots and flight crew members in the Aeronautic Medicine Center located in Lisbon, Portugal. During this training program a simulated flight was made using a hypobaric chamber (Figure 30) that reaches a simulated pressure equivalent to an altitude of 35,000 feet. In the initial part of the simulated flight there was an initial climb to 8,000 feet followed by a descent back to sea level pressure to ensure that all individuals that are going to perform the test are capable to equalize pressure in their ears and are safe to continue. This safety feature is required due to rapid ascent and descent rate that can reach 5,000 feet per second in which all individuals are required to equalize ear pressure to avoid any injuries.
Figure 30: Hypobaric Chamber.
Authorization from the Portuguese Air Force to conduct tests in the hypobaric chamber during the initial flight phase to 8,000 feet lead to the need to collect data from atmospheric environment inside the chamber and new equipment was required. The combined use of pressure, temperature and humidity sensors built in a Shield (Figure 31) and connected to an Arduino Board together with software program that record in a computer (Figure 32) all the data was assembled and built by a team from the SST/PIT a partnership within this work.
29
Figure 32: Equipment for Atmospheric Data Acquisition in the Hypobaric Chamber.
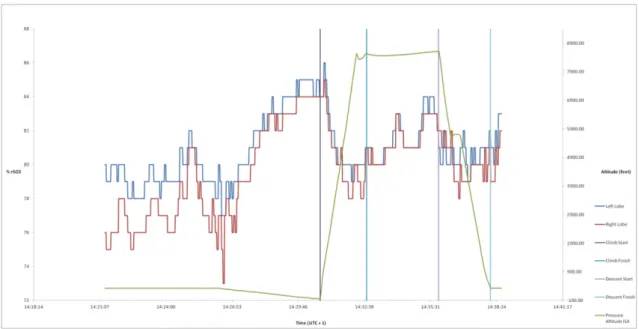
Two flight tests were made in the hypobaric chamber with different individuals. During the tests all the equipment worked properly and all information collected was recorded and processed. Information regarding the first flight is display in the Graphics 1 to 4 below.
30
Graphic 2: Cerebral Oximetry and Pressure Altitude.
31
Graphic 4: Cerebral Oximetry and Humidity Data.
All the equipment performed flawlessly during the test and all the information recorded was well processed. Data analysis shows a slight increase in pressure before the beginning of the ascent that is explained due to safety checks with chamber doors closed. Although the chamber altitude system record a climb to 8,000 feet data collected inside the hypobaric chamber show a minimum pressure of 748.37 hPa (Graphic 1) that corresponde to an ISA pressure altitude of 8,627 feet (Graphic 2). The climb phase lasted 2 minutes with a climb rate of approximately 4,250 feet per minute. After reaching the target altitude several systems checks were performed and after 3 minutes and 8 seconds the descent phase was initiated. During the descent one of the persons conducting the test failed to equalize ear pressure and the descent was stopped for a few moments, this stop can be notice in Graphic 1 and 2 due to the change in Pressure and ISA Pressure Altitude respectively. The descent to ground level pressure lasted 2 minutes and 16 seconds with an overall descent rate of approximately 3,660 feet per minute. Graphic 3 and 4 show Temperature and Humidity variation inside the hypobaric chamber and related data shows that during the test a minimum Temperature of 20.6oC and 48.8% of Humidity was notice a few moments prior to the ascent start and on the other hand the maximum Temperature of 26.2oC and 85% of Humidity was notice at the end of the descent. All the data recorded by the different sensors is reliable and correspond to data from the Hypobaric Chamber system as well as information provided by different individuals who carried out the test. These individuals said that after the chamber doors were closed Temperature started to decrease and reached a much lower value than those felt outside prior entering in the chamber. When the climb began temperature started to increase again and all individuals reported that the maximum temperature felt in the chamber was close to the end of the test. The analysis of these results determines that the equipment used is reliable and provide good results, the humidity
32
sensor appears to work properly but some inconsistent values recorded may indicate that a review of the sensor calibration and/or installation requires future attention.
Graphics 1, 2, 3 and 4 can be consulted in Annex 3 with enhanced resolution.
4.4 Flight Tests
4.4.1 Trial Flights
First flight tests were done at LPVZ airfield in Viseu, Portugal (Figure 33) with an ultra light aircraft CZAW Sport Cruiser, ICAO Code Cruz (Figure 34). This aircraft has a capacity for two persons with a storage compartment behind the seats.
Figure 33: Viseu Airfield Location (Great Circle Mapper, 2012).
Figure 34: CZAW ICAO Code Cruz.
In these test flights due to the EEG-SMT malfunction only the APM 2.0 and the Nonin Model 7600 were taken on board. At the airfield during pre-flight tests to the APM 2.0 an error message stating that the memory card was not inserted and consequently logging function
33 was deactivated was noticed. This time resetting the board to default settings didn’t solve the problem and as a backup solution a portable computer had to be taken on board to provide power and collect data from the APM 2.0. Due to this problem the installation of the hardware inside the aircraft cabin suffered some modification mostly due to the length of the USB cable that connects the computer to the APM 2.0. The Nonin Regional Oximeter and the portable computer were placed in a storage compartment behind the seats while the APM board was placed inside an armrest between the two seats (Figure 35).
Figure 35: Equipment Installation for Trial Flights.
The first trial flight was short with approximately 10 minutes duration in which the main objective was to verify that all systems were working properly. After downloading and analyzing all the data we observed that the GPS signal failed during some parts of the flight while all the other sensors were working properly. After changing the placement of the APM 2.0 further away from the aircraft engine and radio the board was placed into the storage compartment and a second trial flight was made with the results from Graphics 5 to 8.
34
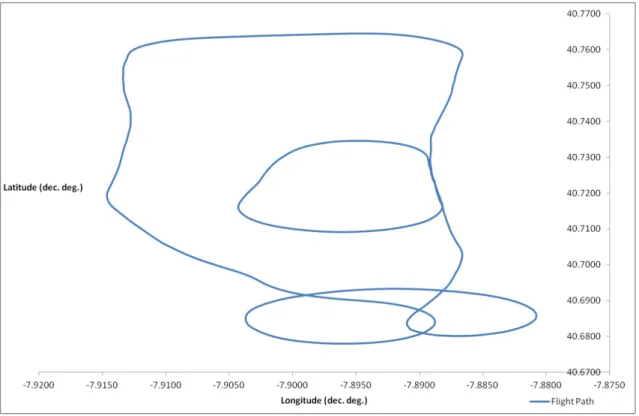
Graphic 5: Flight Path from Second Trial Flight.
35
Graphic 7: Second Trial Flight Altitude and Acceleration Data.
36
The analysis of data (Graphics 5 to 8) from this flight revealed better signal from the GPS together with good information from all the other sensors and the Nonin Model 7600. This flight lasted 14 minutes and 22 seconds and consisted in takeoff followed by a climb to a maximum altitude of 1,520 meters after which a descent was initiated followed by a low pass to the runway and final maneuvers for landing (see also Marques et al., 2012).
After downloading all data from the APM 2.0 a system check was performed and the memory card error continued to appear but despite the error and the warning that the logging function was deactivated the memory card had some data storage from the flight. The analysis of the data recorded in the Micro SD Card revealed that during the initial phase of the flight the logging function was working properly but suddenly all the recording operation stopped and the logging function was automatically deactivated.
In order to solve the memory card error a new contact with the manufacturer was made along with an online research about the subject. This problem was identified as a software bug that was fixed by using an USB 3.0 port for connection of APM to the computer, upgrading ArduPlane firmware for a newer version and then resetting the board to factory default settings. During this repair new information regarding power supply to the APM 2.0 was released by the manufacturer and consisted in remove jumper 1 and power the board by the input to improve GPS accuracy. After changing the power supply and with the logging function of the memory card working properly some tests were made and all the systems gave good results and were working fine.
With problems from the first tests solved a second series of flights were made in the same location with the same aircraft and pilot. The APM 2.0 was placed far away as possible from the aircraft engine and radio to avoid interference and during these flights all the equipment worked flawless and good results were achieved. A total of two flights were made and APM 2.0 sensors and Nonin Model 7600 complete data is displayed in the following Graphics 9 to 16 for the first flight, and 17 to 24 for the second flight.
The first flight lasted 28 minutes, reached a maximum altitude of 1,466 meters and crosswinds in the area caused some turbulence. Information recorded in this flight is displayed in the following Graphics 9 to 16.
37
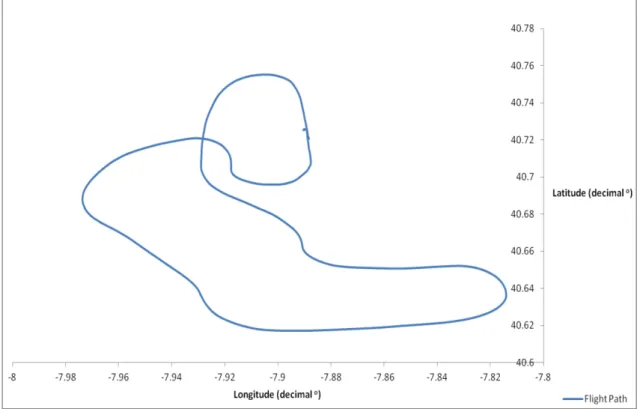
Graphic 9: Flight Path from Flight One.
38
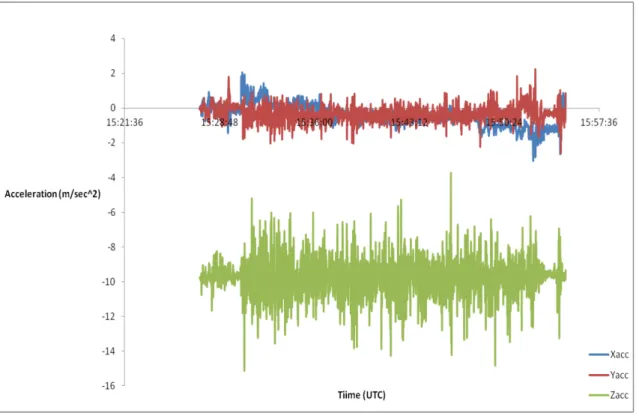
Graphic 11: Flight One Acceleration Data.
39
Graphic 13: Flight One Pitch Data.
40
Graphic 15: Flight One Heading Data.
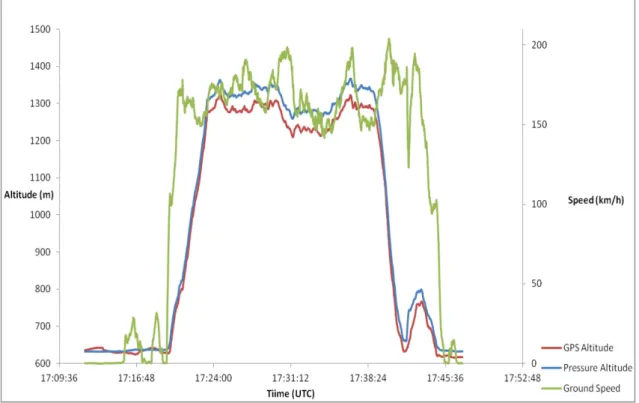
41 The analysis of all collected data combined with pilot report of the flight show reliable results with good precision. Flight path, general altitude and speed were confirmed by the pilot and due to crosswinds in the area pilot reported some turbulence that was recorded by sensors and can be seen in Graphics 11, 12, 13 and 14 that display General Accelerations, Roll, Pitch and Yaw Data respectively. Nonin Model 7600 performed flawlessly during the flight and all the data was storage in the internal memory and the battery provided energy without problems (Graphic 16). The overall performance of the APM 2.0 was perfect, no errors or problems appeared, all data collected is very precise and the compact size and battery power supply is an excellent combination to acquired data in an ultra light aircraft.
After very good results from the first flight the APM 2.0 recorded data was cleared from the Micro SD Card and another flight was performed with the same aircraft and pilot. The second flight reached a maximum altitude of 1,328 meters and lasted 35 minutes. Information regarding all the data collected in this flight is displayed in the following Graphics 17 to 24.
42
Graphic 18: Flight Two Altitude and Speed Data.
43
Graphic 20: Flight Two Roll Data.
44
Graphic 22: Flight Two Yaw Data.
45
Graphic 24: Flight Two Pilot Cerebral Oximetry Data.
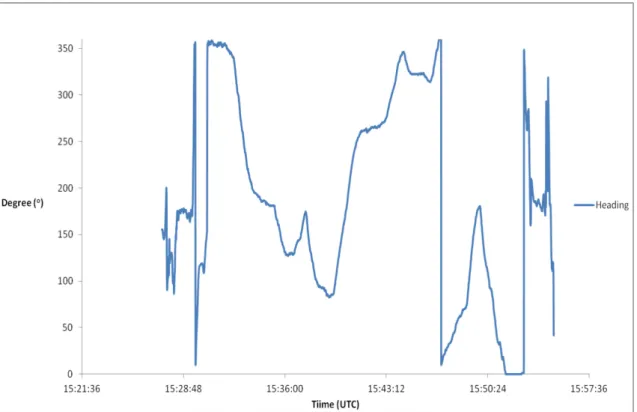
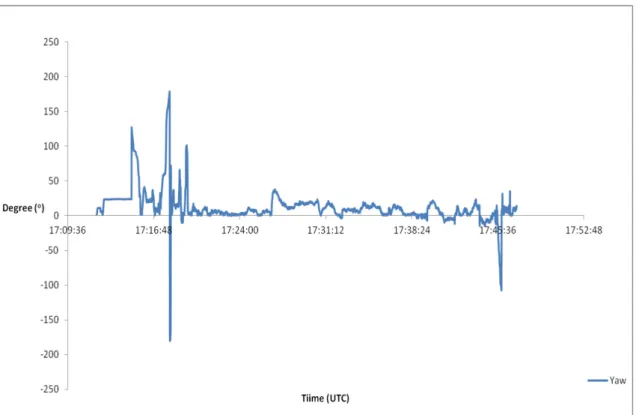
This flight ended with a low pass to the runway followed by a left turn for final approach maneuvers and landing. Data analysis showed again very good results with good precision and reliability through the pilot confirmation of the overall flight path, moderate turbulence, general altitude and speed. Note that in Graphic 22 Yaw data show high values that correspond to taxi maneuvers of the aircraft before takeoff and after landing.
Just after these two flights while processing data it was noticed that the memory card capacity of the APM 2.0 was not capable of recording data from flights with more than 40 minutes approximately. Several contacts were made with the manufacturer with the objective to obtain safe information about the replacement of the memory card but unfortunately the replacement was not possible because of ArduPlane firmware compatibilities that don’t allow regular memory card formation settings and the nonexistence of a compatible card with a higher capacity. Regular updates to the Arduplane firmware were performed but until this moment the replacement of the memory card was not possible without a deep and complex change in the firmware code.
4.4.2 OMNI Aviation Training Center
Located in LPCS airfield in Cascais, Portugal (Figure 36) the OMNI Aviation Training Center was a partner in this work and authorized some test flights using a Cessna FR172F Reims Rocket (Figure 37).
46
Figure 36: LPCS Airfield location (Great Circle Mapper, 2012).
Figure 37: Cessna FR172F Reims Rocket.
Flights performed by OMNI Aviation Training Center had a minimum duration of approximately 1 hour and 30 minutes and a maximum duration of approximately 4 hours. Nonin Model 7600 battery according to the manufacturer has a maximum duration of approximately 3 hours and the APM 2.0 Micro SD Card with 16 MB of memory is able to record only during approximately 40 minutes until the Micro SD Card is full and starts to overwrite data. The equipment was installed in board as shown in Figure 38.
47 Graphics 25 to 36 displayed just below show the information recorded by the APM 2.0, Nonin Model 7600 and Garmin Forerunner 305 during an instruction flight for VOR approaches in Terminal Maneuvering Area (TMA) of Lisbon International Airport. The flight lasted 1 hour and 34 minutes with all devices working well with exception to the APM 2.0 that only recorded data from the last 37 minutes of the flight. In this period of time information collected just reports the last maneuvers in the training area and the flight path back to the airfield.
48
Graphic 26: OMNI Instruction Flight last 37 minutes Altitude and Speed Data.
49
Graphic 28: OMNI Instruction Flight last 37 minutes Roll Data.
50
Graphic 30: OMNI Instruction Flight last 37 minutes Yaw Data.
51
Graphic 32: OMNI Instruction Flight last 37 minutes Pilot Cerebral Oximetry Data.
Using GPS information from the Garmin Forerunner 305 the complete flight path could be reproduced but with less precision if compare with the APM 2.0 GPS frequency (Graphic 33).
52
Graphic 34: OMNI Instruction Flight GPS Altitude Combined.
53
Graphic 36: Pilot Cerebral Oximetry from OMNI Instruction Flight.
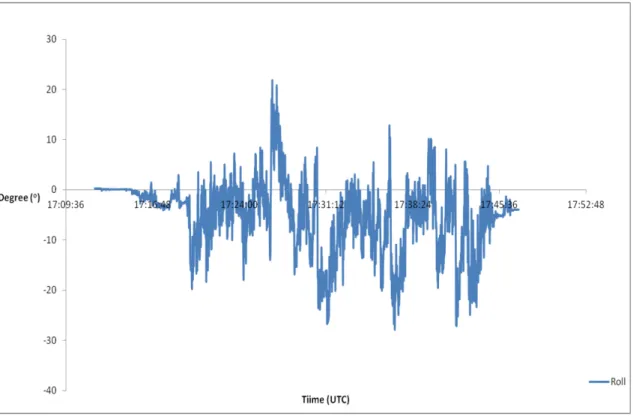
The review of all data recorded by the APM 2.0 from the last 37 minutes of the instruction flight provided results with reliability and precision levels expected from previous flight tests. Pilot report of the flight corroborate results shown in Graphics 25, 26, 27, 28, 29 and 30 that display the flight path, altitude and speed, accelerations, roll, pitch and yaw. The Garmin Forerunner 305 recorded good information regarding pilot heart rate (Graphic 35) but due to its update speed GPS data was not recorded in a specific time and therefore a flight path cannot be reproduced with the precision of the APM 2.0 Purple (Graphic 33 and 34). Nonin Model 7600 recorded the entire data from the flight without any problems (Graphic 36). During this test the only problem in performance was the memory capacity from the APM 2.0. All the sensors worked very well and provided results with good performance but due to the lack of memory, unfortunately, data from the entire flight couldn’t be saved.