Arq. Bras. Med. Vet. Zootec., v.69, n.2, p.445-456, 2017
Reference values for biochemical analytes in Mexican dairy farms: interactions and adjustments between production groups
[Valores de referência para analitos bioquímicos em rebanhos leiteiros mexicanos: interações e ajustes entre grupos de produção]
C.A.C. García1, F.M.G. Prado2, L.L. Galicia2, T.F. Borderas2
1Universidad Autónoma Metropolitana Doctorado en Ciencias Agropecuarias Coyoacán
04960 México, Ciudad de México
2 Universidad Autónoma Metropolitana Departamento de Producción Agrícola y Animal Coyoacán
04960 México, Ciudad de México
ABSTRACT
Blood samples of 189 healthy Holstein cows classified as high-producers, low-producers, or dry cows, were collected with the purpose of establishing reference values for several biochemical analytes in Mexican dairy farms. Mean values were calculated for: 1) Energy profile: glucose, cholesterol, triglycerides, β-hydroxybutyrate, and non-esterified fatty acids, 2) Protein profile: urea, albumin, globulin, and total protein, 3) Mineral profile: calcium, phosphorus, sodium, potassium, magnesium, chlorine, carbon dioxide, bicarbonate, and anion gap, and 4) Hepatic enzyme: γ-glutamyl transpeptidase. The resulting data set was analyzed using Gaussian distribution and descriptive statistics. Confidence intervals of 95% were established. The linear relationships between the biochemical analytes were quantified, and an analysis of variance was performed to compare the mean values between the three production groups. The overall concentrations of the described analytes are consistent with values reported by international literature. However, lower values were found for urea, calcium, and sodium; higher values were found for cholesterol, and γ-glutamyl transpeptidase. Negative correlations were found between β-hydroxybutyrate and glucose or urea, γ-glutamyl transpeptidase and urea, and bicarbonate and urea or phosphorus or anion gap. Positive correlations were found between β-hydroxybutyrate and cholesterol or anion gap, non-esterified fatty acids and anion gap, cholesterol and globulin, different analytes of mineral profile and anion gap or urea or glucose, and between sodium and calcium. Differences among the three production groups were observed for β-hydroxybutyrate and cholesterol concentrations. The γ-glutamyl transpeptidase concentration was similar in high and low-producing cows but was higher in comparison to serum levels of dry cows. Calcium showed differences between high-producing cows and the other two groups, and sodium showed the highest concentration in dry cows. The outcomes of this work improve the accuracy of the metabolic profiles as a tool for assessing the nutritional and health status of dairy cows.
Keywords: dairy cow, blood chemistry, metabolic profile
RESUMO
As amostras de sangue de 189 vacas da raça Holandesa clinicamente saudáveis, classificadas em alta produção, baixa produção ou vacas secas, foram coletadas com a finalidade de se estabelecerem valores de referência para vários analitos bioquímicos em rebanhos leiteiros mexicanos. Os valores médios foram
calculados para: 1) perfil energético: glicose, colesterol, triglicerídeos, β-hidroxibutirato, e ácidos graxos não
esterificados, 2) perfil proteico: ureia, albumina, globulina e proteínas totais, 3) perfil mineral: cálcio, fósforo,
sódio, potássio, magnésio, cloro, dióxido de carbono, bicarbonato e hiato aniônico, e 4) enzima hepática: γ
-glutamil transpeptidase. O conjunto de dados resultante foi analisado utilizando-se distribuição gaussiana e estatística descritiva. Intervalos de confiança de 95% foram estabelecidos. As relações lineares entre os analitos bioquímicos foram quantificadas, e uma análise de variância foi realizada para se compararem os valores médios entre os três grupos de produção. As concentrações totais dos analitos descritos são
consistentes com os valores relatados na literatura internacional. No entanto, os valores mais baixos foram
Recebido em 22 de abril de 2016 Aceito em 8 de julho de 2016
García et al.
446
Arq. Bras. Med. Vet. Zootec., v.69, n.2, p.445-456, 2017encontrados para a ureia, o cálcio e o sódio; os valores mais elevados foram encontrados para o colesterol e o
γ-glutamil transpeptidase. Correlações negativas foram encontradas entre β-hidroxibutirato e glicose ou ureia,
γ-glutamil transpeptidase e ureia, e entre bicarbonato e ureia ou fósforo ou hiato aniônico. Foram
encontradas correlações positivas entre β-hidroxibutirato e colesterol ou hiato aniônico, ácidos graxos não
esterificados e hiato aniônico, colesterol e globulina, diferentes analitos de perfil mineral e hiato aniônico ou ureia ou glicose, e entre sódio e cálcio. As diferenças entre os três grupos de produção foram observadas para
as concentrações de β-hidroxibutirato e de colesterol. A concentração γ-glutamil transpeptidase foi semelhante
em vacas de alta e baixa produção, mas foi maior em comparação com os níveis séricos de vacas secas. O cálcio mostrou diferenças entre vacas de alta produção e os outros dois grupos, e o sódio apresentou a maior concentração em vacas secas. Os resultados deste trabalho podem melhorar a precisão dos perfis metabólicos como uma ferramenta para avaliar o estado nutricional e de saúde das vacas leiteiras.
Palavras-chave: vaca leiteira, bioquímica sanguínea, perfil metabólico
INTRODUCTION
The metabolic profile is a set of analytical tests of blood chemistry. It grants knowledge about the functional state of the metabolic pathways of an individual animal or a group of them. The use of metabolic profiles in dairy cattle was introduced at the beginning of the seventies (Payne, 1972). The original objectives of this methodology were: 1) To provide paraclinical clues to aid the veterinarian in reaching a diagnosis of metabolic diseases and production problems, and 2) To identify superior cows in term of their metabolic response to high milk production. The focus of this methodology has since been adapted and modified (Bjerre-Harpoth et al., 2012), helping to clarify many topics related to the transition period of dairy cows (Van Saun, 2010), especially to assess the risks of metabolic diseases and achieve their early detection. The complexity of energy metabolism often makes difficult the selection of reliable indicators of the energetic status of the cow (Nafikov and Beitz, 2007). The main blood analytes used to assess the energy profile are: glucose (GLU), which should be interpreted carefully to avoid errors related to food intake (Šamanc et al., 2011); Cholesterol (COL-T), be used to jointly evaluate the performance of nutrition programs (Kaneko, 2008); triglycerides (TAG), lipids that circulate in the blood, used by a cell to produce adenosine triphosphate (ATP) (Kaneko, 2008); β-hydroxybutyrate (β-HBA), which is the most important and abundant ketone body in dairy cows (Duffield et al., 2009); and non-esterified fatty acids (NEFA), which are related to lipomobilization and to the degree of negative energy balance (NEB) (Ospina et al., 2010). The essential blood analytes for assessing the protein profile are: blood urea nitrogen
(BUN), as a good indicator of the energy intake of the cow, in particular it is used as an indication of the synchronization between fermentable carbohydrates and rumen degradable protein (RDP) (Van Saun, 2010); albumin (ALB), that can reflect hepatic insufficiency by decreasing its concentration (Whitaker, 2000); globulin (GLOB), that is increased in response to an inflammatory process (Kaneko, 2008); and total protein (PROT-T), gives information about kidney damage, liver damage, and nutritional health (Stojević et al., 2005). Considering the use of body tissues in response to NEB, the produced ketone bodies (by its acidic nature) decrease the natural buffering capacity of bicarbonate (HCO3 -), increasing the anion gap in the blood, and causing changes in pH by movements of electrolytes, water, and carbon dioxide (CO2) (Herdt et al., 2000). The essential blood analytes of the mineral profile are: sodium (Na), which is the main extracellular fluid cation and an important determinant of body water homeostasis (Kume et al., 2011); chlorine (Cl), the most abundant anion in extracellular fluid (Soetan et al., 2010); potassium (K), the principal intracellular cation in mammals (Van Saun et al., 2006); and calcium (Ca), phosphorus (P), and magnesium (Mg) due to their importance in the rapidity of metabolic reactions and their role in the transmembrane transport systems (Houillier, 2014); and the enzyme γ-glutamyl transpeptidase (γ-GT), is an essential indicator of hepatic lesions and function (Stojević et al., 2005).
very different producing conditions. There are no published reference values specific to Mexico for these analytes. Therefore, the aim of this study was to establish reference values for different biochemical analytes, in high-producing, low-producing, and dry Holstein cows in intensive farming systems in the Mexican temperate zone.
MATERIALS AND METHODS All animals in this study were kept following the guidelines of the Canadian Council on Animal Care (Farm…, 1993). The study was carried out with blood serums obtained from sampling of the coccygeal vein of 189 Holstein cows belonging to nine different intensive housed dairy farms. All farms were located in the Mexican temperate zone, at an altitude of 2 260 m above sea level, with sub-humid climate (Köppen Cfb) (Peel et al., 2007). The average temperature is 15°C, and pluvial precipitation is 620 mm/year. In multiparous cows, the period of peak milk production in early lactation is usually between 30 to 60 d after calving, when the uterus is involuting and the ovary is returning to estrous cyclicity (Herdt et al., 2000; Oetzel, 2004; Quiroz-Rocha et al., 2009). The peak milk production generally begins to descend until 12 to 14 wk postpartum (Nutrient…, 2001). Therefore, sampling was done according to the methodology proposed and described by Payne (1972) the Compton metabolic profile. Twenty one healthy Holstein cows from 2nd or 3rd calving were selected from each farm. Seven cows were selected from each of the three following production groups: 1) High-producing cows [DIM: 42 ± 15 d postpartum; Milk Production (Mean ± SD): 34.96 ± 1.69], 2) Low-producing cows [DIM: 91 ± 17 d postpartum; Milk Production (Mean ± SD): 16.14 ± 1.12], and 3) Dry cows (21 ± 5 d prepartum; end of pregnancy and not producing milk). Milk producing cows were milked twice daily. The feeding of the high-producing cows diet included: 7.14kg bale of alfalfa, 1.32kg of alfalfa silage, 1kg of oat straw, 14.06kg of corn silage, and 3.38kg of triticale silage; low-producing cows diet included: 4kg bale of alfalfa, 14.3kg of chopped alfalfa, 1.5kg of oat straw, 2.5kg of ground corn; and dry cows diet included: 8kg bale of alfalfa, 4.9kg of oat straw, 9.5kg of triticale silage, 2kg of canola meal, and 1kg of ground corn. All the groups additionally received
0.3kg of HCO3-, mineral supplements, and free access to fresh water. Commercial concentrate with 18% PC, was supplied only to milk producing cows at a rate of 13.25kg/d for high-producing cows, and 7kg/d for low-high-producing cows. One of the farms under study provided by-pass fat at a rate of 400 g/d for high-producing cows, and 200 g/d for low-producing cows.
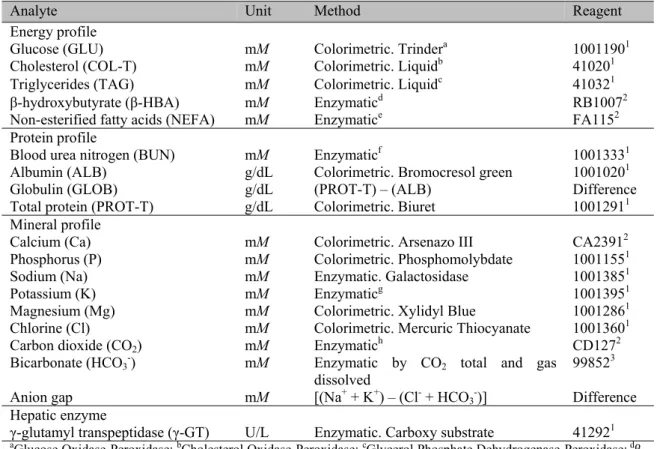
Blood samples were collected after the first morning milking and before feeding, by puncture of the coccygeal vein using 8.5 mL vacuum tubes with clot activator and serum separator gel (BD Vacutainer 367988; Becton-Dickinson Co., Franklin Lakes, United States). To obtain serum, the blood samples were centrifuged directly at the farms at 1 500 x g for 10 min as described by Van Saun (2010) using a portable centrifuge (Porta-Spin C828; UNICO., Dayton, United States). Subsequently, the serum samples were separated using 1.5 mL tubes with lid (Tubes Safe-Lock 3810X; Eppendorf., Madrid, Spain) and transported at 4°C in a portable cooler (Thermoelectric Cooler Car/Home M5644-710; Coleman Company., Kansas, United States) to the clinical laboratory of the Universidad Autónoma Metropolitana campus Xochimilco where they were frozen at -20°C until analysis. The concentration of each analyte was determined with an UV-Vis double beam spectrophotometer (Biochemistry Analyzer ES-218; KONTROLab., Guidonia, Italy). The biochemical analytes, the analytical method for each parameter, the units in which the results were expressed, and the corresponding commercial reagents, are described in Table 1.
García et al.
448
Arq. Bras. Med. Vet. Zootec., v.69, n.2, p.445-456, 2017Table 1. Biochemical analytes, units, analytical methods, and corresponding commercial reagents
Analyte Unit Method Reagent
Energy profile
Glucose (GLU) mM Colorimetric. Trindera 10011901
Cholesterol (COL-T) mM Colorimetric. Liquidb 410201
Triglycerides (TAG) mM Colorimetric. Liquidc 410321
β-hydroxybutyrate (β-HBA) mM Enzymaticd RB10072
Non-esterified fatty acids (NEFA) mM Enzymatice FA1152
Protein profile
Blood urea nitrogen (BUN) mM Enzymaticf 10013331
Albumin (ALB) g/dL Colorimetric. Bromocresol green 10010201
Globulin (GLOB) g/dL (PROT-T) – (ALB) Difference
Total protein (PROT-T) g/dL Colorimetric. Biuret 10012911
Mineral profile
Calcium (Ca) mM Colorimetric. Arsenazo III CA23912
Phosphorus (P) mM Colorimetric. Phosphomolybdate 10011551
Sodium (Na) mM Enzymatic. Galactosidase 10013851
Potassium (K) mM Enzymaticg 10013951
Magnesium (Mg) mM Colorimetric. Xylidyl Blue 10012861
Chlorine (Cl) mM Colorimetric. Mercuric Thiocyanate 10013601
Carbon dioxide (CO2) mM Enzymatich CD1272
Bicarbonate (HCO3-) mM Enzymatic by CO2 total and gas
dissolved 99852
3
Anion gap mM [(Na+ + K+) – (Cl- + HCO
3-)] Difference
Hepatic enzyme
γ-glutamyl transpeptidase (γ-GT) U/L Enzymatic. Carboxy substrate 412921 aGlucose Oxidase-Peroxidase; bCholesterol Oxidase-Peroxidase; cGlycerol Phosphate Dehydrogenase-Peroxidase;d
β-hydroxybutyrate Dehydrogenase; eSynthetase-Oxidase-Peroxidase; fUrease-Glutamate Dehydrogenase; gPhosphoenolpyruvate-Lactate Dehydrogenase; hPhosphoenolpyruvate Carboxylase- Malate Dehydrogenase; 1Spinreact., Girona, Spain; 2Randox Laboratories., Northern Ireland, United Kingdom; 3Biolabo Laboratory.,
Grandcamp-Maisy, France
The statistical procedure used to calculate 95% confidence intervals for the different biochemical analytes followed the recommendation of the International Federation of Clinical Chemistry (Solberg, 1987). Data were first evaluated for the presence of outlier data for each analyte. All values out of a mean ± 3 SD interval were discarded. To assess the distribution of the sample, the resulting data set was analyzed using Gaussian distribution, and percentiles: P10-P90, P25-P75 were determined by SPSS Univariate Procedure (SPSS…, 2013). The linear relationships between the biochemical analytes were identified from a Pearson Correlation Coefficient matrix, and the comparison between groups (high-producing cows, low-producing cows, and dry cows) was assessed by Analysis of Variance. A multiple comparison test of Tukey was performed when the effect of group was found to be significant (P<0.05).
RESULTS
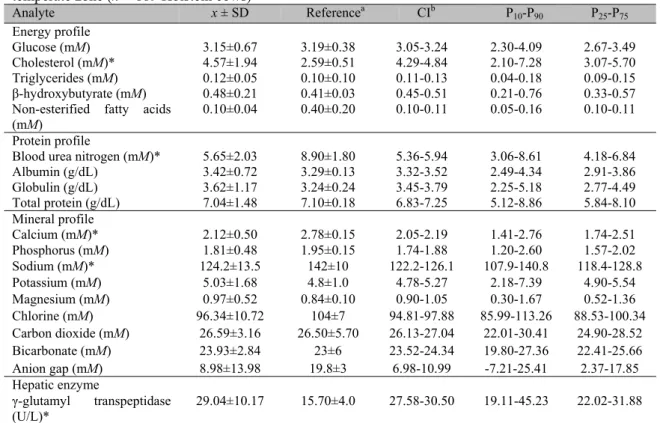
The descriptive statistics for: GLU, TAG, PROT-T, BUN, ALB, GLOB, β-HBA, NEFA, COL-PROT-T, γ-GT, Ca, P, Na, K, Mg, Cl, CO2, HCO3-, and the anion gap, determined from 189 metabolic profiles in Holstein cows, and its respective international reference values are shown in Table 2.
In general, the values found for almost all biochemical analytes are consistent with the reference values reported internationally. However, in the protein profile: BUN concentration was slightly lower than the reference value. In the energy profile: COL-T
and hepatic enzyme: γ-GT showed
Table 2. Mean (x), standard deviation (SD), reference value, confidence interval (CI), and percentiles: P10-P90 and P25-P75 for different biochemical analytes in intensive housed dairy farms of the Mexican temperate zone (n = 189 Holstein cows)
Analyte x ± SD Referencea CIb P10-P90 P25-P75
Energy profile
Glucose (mM) 3.15±0.67 3.19±0.38 3.05-3.24 2.30-4.09 2.67-3.49
Cholesterol (mM)* 4.57±1.94 2.59±0.51 4.29-4.84 2.10-7.28 3.07-5.70
Triglycerides (mM) 0.12±0.05 0.10±0.10 0.11-0.13 0.04-0.18 0.09-0.15
β-hydroxybutyrate (mM) 0.48±0.21 0.41±0.03 0.45-0.51 0.21-0.76 0.33-0.57
Non-esterified fatty acids (mM)
0.10±0.04 0.40±0.20 0.10-0.11 0.05-0.16 0.10-0.11
Protein profile
Blood urea nitrogen (mM)* 5.65±2.03 8.90±1.80 5.36-5.94 3.06-8.61 4.18-6.84
Albumin (g/dL) 3.42±0.72 3.29±0.13 3.32-3.52 2.49-4.34 2.91-3.86
Globulin (g/dL) 3.62±1.17 3.24±0.24 3.45-3.79 2.25-5.18 2.77-4.49
Total protein (g/dL) 7.04±1.48 7.10±0.18 6.83-7.25 5.12-8.86 5.84-8.10
Mineral profile
Calcium (mM)* 2.12±0.50 2.78±0.15 2.05-2.19 1.41-2.76 1.74-2.51
Phosphorus (mM) 1.81±0.48 1.95±0.15 1.74-1.88 1.20-2.60 1.57-2.02
Sodium (mM)* 124.2±13.5 142±10 122.2-126.1 107.9-140.8 118.4-128.8
Potassium (mM) 5.03±1.68 4.8±1.0 4.78-5.27 2.18-7.39 4.90-5.54
Magnesium (mM) 0.97±0.52 0.84±0.10 0.90-1.05 0.30-1.67 0.52-1.36
Chlorine (mM) 96.34±10.72 104±7 94.81-97.88 85.99-113.26 88.53-100.34
Carbon dioxide (mM) 26.59±3.16 26.50±5.70 26.13-27.04 22.01-30.41 24.90-28.52
Bicarbonate (mM) 23.93±2.84 23±6 23.52-24.34 19.80-27.36 22.41-25.66
Anion gap (mM) 8.98±13.98 19.8±3 6.98-10.99 -7.21-25.41 2.37-17.85
Hepatic enzyme
γ-glutamyl transpeptidase
(U/L)* 29.04±10.17 15.70±4.0 27.58-30.50 19.11-45.23 22.02-31.88
a (Kaneko et al 2008); b confidence interval of 95%; * differences with the reference
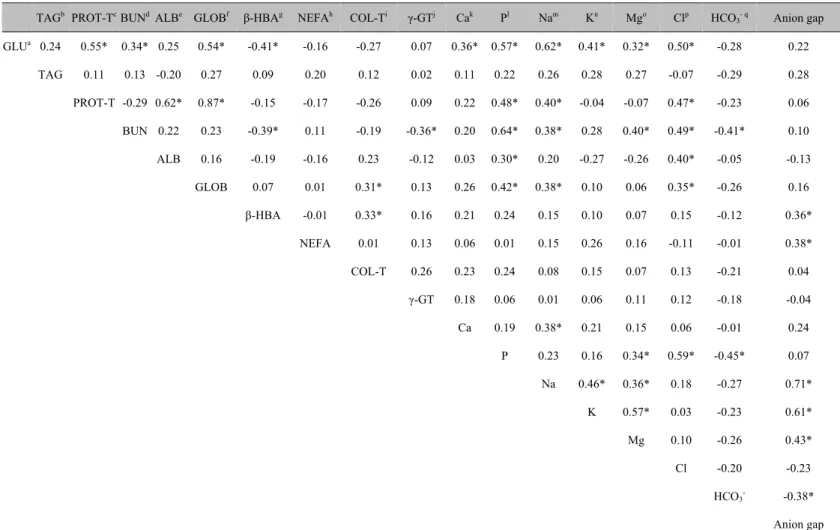
As shown in Table 3, negative correlation coefficients (P<0.05) were found between β-HBA with GLU and BUN, between γ-GT with BUN, and between HCO3- with BUN, P and anion gap. Positive correlations (P<0.05) were found between GLU with PROT-T, BUN, GLOB, Ca, P, Na, K, Mg and Cl, between PROT-T with ALB, GLOB, P, Na and Cl, between BUN with P, Na, Mg and Cl, between ALB with P and Cl, between GLOB with COL-T, P, Na and Cl, between β-HBA with COL-T and anion gap, between NEFA with anion gap, between P with Mg and Cl, between Na with Ca, K, Mg and anion gap, between K with Mg, and between anion gap with K and Mg.
García et al.
450
Arq. Bras. Med. Vet.
Zootec. , v .69, n.2 , p.445-4 56, 2017
Table 3. Pearson correlation coefficients for different biochemical analytes in intensive housed dairy farms of the Mexican temperate zone (n = 189 Holstein cows)
Anion gap 0.22 0.28 0.06 0.10 -0.13 0.16 0.36* 0.38* 0.04 -0.04 0.24 0.07 0.71* 0.61* 0.43* -0.23 -0.38* Anion gap
a Glucose; b Triglycerides; c Total protein; d Blood urea nitrogen; e Albumin; f Globulin; g β-hydroxybutyrate; h Non-esterified fatty acids; i Cholesterol; j γ-glutamyl
transpeptidase; k Calcium; l Phosphorus; m Sodium; n Potassium; o Magnesium; p Chlorine; q Bicarbonate; * P<0.05
HCO3- q
-0.28 -0.29 -0.23 -0.41* -0.05 -0.26 -0.12 -0.01 -0.21 -0.18 -0.01 -0.45* -0.27 -0.23 -0.26 -0.20
HCO3
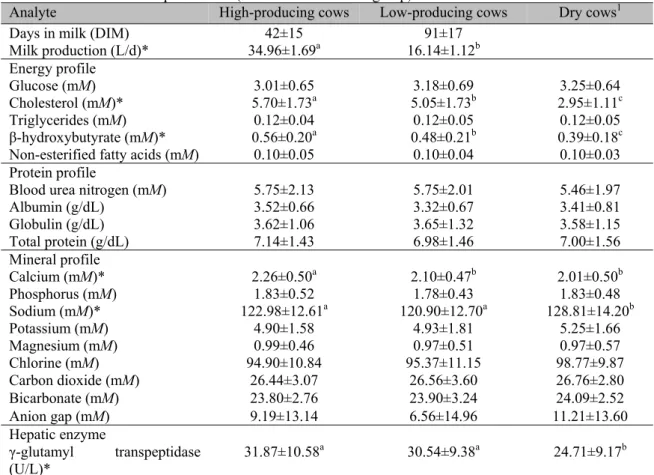
Table 4. Comparison of different biochemical analytes by production group in intensive housed dairy farms of the Mexican temperate zone (n = 63 Holstein cows/group)
Analyte High-producing cows Low-producing cows Dry cows1
Days in milk (DIM) 42±15 91±17
Milk production (L/d)* 34.96±1.69a 16.14±1.12b
Energy profile
Glucose (mM) 3.01±0.65 3.18±0.69 3.25±0.64
Cholesterol (mM)* 5.70±1.73a 5.05±1.73b 2.95±1.11c
Triglycerides (mM) 0.12±0.04 0.12±0.05 0.12±0.05
β-hydroxybutyrate (mM)* 0.56±0.20a 0.48±0.21b 0.39±0.18c
Non-esterified fatty acids (mM) 0.10±0.05 0.10±0.04 0.10±0.03
Protein profile
Blood urea nitrogen (mM) 5.75±2.13 5.75±2.01 5.46±1.97
Albumin (g/dL) 3.52±0.66 3.32±0.67 3.41±0.81
Globulin (g/dL) 3.62±1.06 3.65±1.32 3.58±1.15
Total protein (g/dL) 7.14±1.43 6.98±1.46 7.00±1.56
Mineral profile
Calcium (mM)* 2.26±0.50a 2.10±0.47b 2.01±0.50b
Phosphorus (mM) 1.83±0.52 1.78±0.43 1.83±0.48
Sodium (mM)* 122.98±12.61a 120.90±12.70a 128.81±14.20b
Potassium (mM) 4.90±1.58 4.93±1.81 5.25±1.66
Magnesium (mM) 0.99±0.46 0.97±0.51 0.97±0.57
Chlorine (mM) 94.90±10.84 95.37±11.15 98.77±9.87
Carbon dioxide (mM) 26.44±3.07 26.56±3.60 26.76±2.80
Bicarbonate (mM) 23.80±2.76 23.90±3.24 24.09±2.52
Anion gap (mM) 9.19±13.14 6.56±14.96 11.21±13.60
Hepatic enzyme
γ-glutamyl transpeptidase
(U/L)* 31.87±10.58
a 30.54±9.38a 24.71±9.17b
121±5d prepartum; end of pregnancy and not producing milk; * significant differences were obtained between groups
indicated with different letters (P<0.05); all data are presented means ± SD
DISCUSSION
During the period of positive energy balance, dairy cows of high genetic merit have a low lipid mobilization, and NEFA concentration values are around 0.25 mM (Fonseca et al., 2004). Concentrations higher than 0.40 mM indicate NEB, and a high lipid mobilization (Oetzel, 2004). According to this, none of the cows sampled in this study showed evidence of high lipid mobilization from adipose tissue because only four cows exceeded 0.25 mM (the highest NEFA concentration recorded was 0.32 mM). Serum concentration of β-HBA has been recently used to discriminate cows affected by subclinical ketosis from healthy cows. The cutoff points used for this purpose vary between 1 and 1.4 mM (Duffield et al., 2009; Goldhawk et al., 2009). In the present study, three high-producing cows and two low-producing cows presented β-HBA
García et al.
452
Arq. Bras. Med. Vet. Zootec., v.69, n.2, p.445-456, 2017cows affected by ketosis the TAG concentration decreases because this biochemical analyte is deposited in cells of the liver and other organs.
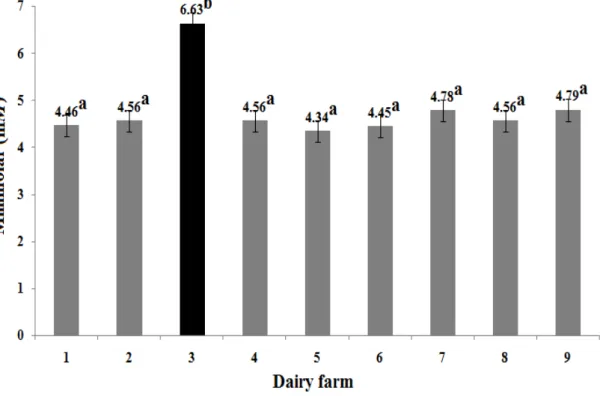
The BUN concentration was related to the amount of RDP and to the content of non-protein nitrogen (NPN) (Cozzi et al., 2011). It is possible that the observed values of BUN, on average slightly lower than the reference, could be related to a low protein intake or a low quality of protein source in the diet. However, it is necessary to consider: 1) that the liver produces nitrogen in the form of ammonia (NH3) as it breaks down proteins into their constituent amino acids to obtain energy (Rojen et al., 2012), and 2) the negative correlation coefficients (P<0.05) found between BUN and β-HBA (r = -0.39), and BUN and γ-GT (r = -0.36) (Table 3). González et al. (2011) reported that the accumulation of TAG in hepatic cytosol of dairy cows produces fatty liver that compromises BUN synthesis. The serum levels of γ-GT (29.04 ± 10.17 U/L) quantified in this study (Table 2) confirm a certain degree of hepatic damage or biliary tract disease, probably caused by the infiltration of TAG in the liver (Bossaert et al., 2012). Therefore, considering that less than 4% of cows (5 of 189) showed subclinical ketosis and a slightly high lipid mobilization, it is proposed that the sampled cows have a moderate degree of liver damage due to infiltration of TAG. A higher infiltration degree would have considerably reduced the ALB concentration, but results in this study proved to be comparable to reference values (Table 2). High values of COL-T were found in most sampled cows, perhaps due to hepatic steatosis (Bossaert et al., 2012), or a decrease in its excretion rate by an inflammatory process obstructing the bile ducts both inside and outside of the liver (Temel and Brown, 2012). These assumptions could explain the positive correlation (P<0.05) found between COL-T and GLOB (r = 0.31) (Table 3). Diet formulation is also worth considering, as foods high in fat can raise the COL-T concentration. Duske et al. (2009) and Zárate-Martínez et al. (2011) indicated that dairy cows supplemented with by-pass fat, show a significant increase in the COL-T concentration. COL-This information is consistent with our results. As it is shown in Figure 1, the cows supplemented with by-pass fat on farm No. 3, showed higher values (P<0.05) of COL-T with respect to the other eight dairy farms under study.
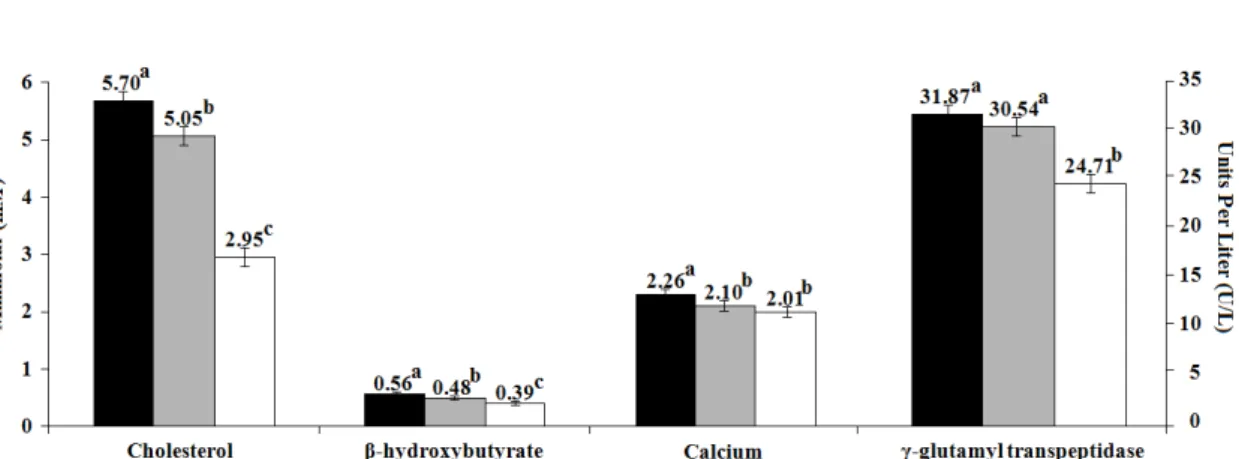
The physiological tendency of dairy cows to respond to NEB by catabolism and utilization of their body reserves generates subclinical ketosis with biosynthesis of Acetoacetate (AcAc) and β-HBA (Duffield et al., 2009). These ketone bodies release H+ ions in the extracellular fluid, which decrease the natural buffering capacity of HCO3-, and provoke changes in pH by movements of electrolytes, water, and CO2 (Herdt et al., 2000). Therefore, an increase in concentration of ketone bodies increases the difference between anions and cations (Kraut and Madias, 2010). This could explain the positive correlation coefficients (P<0.05) found between β-HBA and anion gap (r = 0.36), and between NEFA and anion gap (r = 0.38), as well as the negative correlation coefficient (P<0.05) found between HCO3- and anion gap (r = -0.38). When comparing the COL-T concentration between the three production groups, increased levels were found after calving. These levels started to decrease around 175 d postpartum. Guillén et al. (2008) reported that in dairy cows, the postpartum COL-T concentration increases in proportion to milk production. This information is consistent with the COL-T behavior found in our study, where the group of high-producing cows showed the highest values for this analyte (Figure 2).
cover the shortage of glucose during NEB (Ospina et al., 2010). Therefore, during the first stage of lactation the β-HBA concentration is slightly raised in response to lipid mobilization (Duffield et al., 2009). This information is consistent with our results (Figure 2), as different (P<0.05) β-HBA concentrations were observed between high-producing cows and the other two groups. The temporary accumulation of lipids in the liver of dairy cows is a normal physiological process (Duffield et al., 2009). All dairy cows of high genetic merit have a moderate degree of hepatic lipidosis after the dry period, and accumulate fat in the liver during the first days after calving (Ospina et al., 2010). These metabolic adaptations raise the γ-GT concentration, since the liver is exposed to large amounts of NEFA mobilized from the fat tissue (Jump, 2011). Afterwards, the γ-GT concentration begins to descend, reaching the lowest values during the dry period. Finally, the metabolism of the dairy cow keeps Ca under strict homeostatic control; therefore, its inclusion in the mineral profile only proves useful as an
indicator of a proper homeostatic capacity, and not as a reflection of its availability in the diet (Herdt et al., 2000). However, the quantified value of this analyte was 2.12 ± 0.50 mM (Table 2) which is lower than the reference value of 2.78 ± 0.15 mM (Kaneko, 2008). The lack of adequate levels of Ca increases the risk of developing postpartum diseases such as hypocalcemia, especially if an electrolyte imbalance also occurs (Van Saun et al., 2006) as seems to be the case in our study. Liao et al. (2012) and Michel et al. (2014) indicated that the Na/Ca exchange located in the plasma membrane of the osteocytes is essential for maintaining Ca homeostasis, and that a decrease in the Na concentration could lead to the presence of low serum Ca levels. This affirmation explains the positive correlation (P<0.05) found in our study between Na and Ca (r = 0.38). A negative balance between anions and cations was recorded in 19.5% of the sampled cows: 11 high-producing cows, 16 low-high-producing cows, and 10 dry cows.
García et al.
454
Arq. Bras. Med. Vet. Zootec., v.69, n.2, p.445-456, 2017Figure 2. Comparison of means between different groups of production in Holstein cows of the Mexican temperate zone (n = 9 dairy farms). High-producing cows [DIM: 42 ± 15 d postpartum; Milk Production (Mean ± SD): 34.96 ± 1.69, ■], 2) Low-producing cows [DIM: 91 ± 17 d postpartum; Milk Production (Mean ± SD): 16.14 ± 1.12, ■], and 3) Dry cows (21 ± 5 d prepartum; end of pregnancy and not producing milk, □); a, b significant differences were obtained between groups indicated with different letters (P<0.05).
CONCLUSIONS
The proposed approach to establish reference values for different biochemical analytes, in high-producing, low-producing, and dry Holstein cows, serves to improve the accuracy of the biochemical profile as a tool for the assessment of the metabolic status in intensive farming systems in the Mexican temperate zone. The calculated confidence intervals could be used at herd level to detect alert situations when at least 5% of the sampled cows would fall outside of the calculated reference interval for a given parameter. The reference values also open the possibility of comparisons between Mexico and other countries with similar dairy systems.
ACKNOWLEDGMENTS
This project was supported by the National Council of Science and Technology-México (CONACyT-México) and the Thematic Network Academic Collaboration: Producción, Calidad, e Inocuidad de la Leche de Vaca, PRODEP 2015. The authors wish to thank the colleagues Lisandro Atilio Montiel-Ramos rest in peace, Luis Arturo García-Hernández, and Simon Crum for their invaluable assistance.
REFERENCES
BJERRE-HARPOTH, V.; FRIGGENS, N.C.; THORUP, V.M. et al.Metabolic and production profiles of dairy cows in response to decreased nutrient density to increase physiological imbalance at different stages of lactation. J. Dairy. Sci., v.95, p.2362-2380, 2012.
BOSSAERT, P.; TREVISI, E.; OPSOMER,G. et al. The association between indicators of inflammation and liver variables during the transition period in high-yielding dairy cows: an observational study. Vet. J., v.192, p.222-225, 2012.
COZZI, G.; RAVAROTTO, L.; GOTTARDO,F. et al.Short communication: reference values for blood parameters in Holstein dairy cows: effects of parity, stage of lactation, and season of production. J. Dairy. Sci., v.94, p.3895-3901, 2011.
DUFFIELD, T.F.; LISSEMORE, K.D.;
MCBRIDE, B.W. et al. Impact of
hyperketonemia in early lactation dairy cows on health and production. J. Dairy. Sci., v.92, p.571-580, 2009.
FARM animal facilities and environment/Cattle.
In: OLFERT, D.E.; CROSS, M.B.;
MCWILLIAM, A.A. (Eds.). Guide to the care and use of experimental animals. Ottawa, Ontario: Canadian Council on Animal Care, 1993. p.65-69.
FONSECA, L.L.F.; RODRÍGUEZ, M.P.H.; SANTOS, V.M. et al.Supplementation of dairy cows with propylene glycol during the periparturient period: effects on body condition score, milk yield, first estrus post-partum, β-hydroxybutyrate, non-esterified fatty acids and glucose concentrations. Cienc. Rural., v.34, p.897-903, 2004.
GOLDHAWK, C.; CHAPINAL, N.; VEIRA, D.M. et al. Prepartum feeding behavior is an early indicator of subclinical ketosis. J. Dairy. Sci., v.92, p.4971-4977, 2009.
GONZÁLEZ, F.D.; MUINO, R.; PEREIRA,V. et al. Relationship among blood indicators of lipomobilization and hepatic function during early lactation in high-yielding dairy cows. J. Vet. Sci., v.12, p.251-255, 2011.
GUILLÉN, C.E.E.; PANAMEÑO, A.J.F.; BARRIENTOS, L.L.V.Efecto del cambio en la condición corporal, raza y número de partos en el desempeño reproductivo de vacas lecheras. Agron. Mesoam., v.9, p.251-259, 2008.
HERDT, T.H.; RUMBEIHA, W.;
BRASELTON, W.E.The use of blood analyses to evaluate mineral status in livestock. Vet. Clin. N. Am. Food. Anim. Pract., v.16, p.423-444, 2000.
HOUILLIER, P.Mechanisms and regulation of renal magnesium transport. Annu. Rev. Physiol., v.76, p.411-430, 2014.
JUMP, D.B.Fatty acid regulation of hepatic lipid metabolism. Curr. Opin. Clin. Nutr. Metab. Care, v.14, p.115-120, 2011.
KANEKO, J.J. Blood analyte reference values in large animals. In: KANEKO, J.J.; HARVEY, W.J.; BRUSS, L.M. (Eds.). Clinical biochemistry of domestic animals. California: Academic Press, 2008. p.882-888.
KRAUT, J.A.; MADIAS, N.E. Metabolic acidosis: pathophysiology, diagnosis and management. Nat. Rev. Nephrol., v.6, p.274-285, 2010.
KUME, S.; SATO, T.; MURAI, I. et al. Relationships between urine pH and electrolyte status in cows fed forages. Anim. Sci. J., v.82, p.456-460, 2011.
MICHEL, L.Y.; VERKAART, S.; KOOPMAN, W.J. et al.Function and regulation of the Na+-Ca2+ exchanger NCX3 splice variants in brain and skeletal muscle. J. Biol. Chem., v.289, p.11293-11303, 2014.
NAFIKOV, R.A.; BEITZ, D.C. Carbohydrate and lipid metabolism in farm animals. J. Nutr., v.137, p.702-705, 2007.
NUTRIENT requirements of dairy cattle. 7.ed. 2001. Washington: National Academy.
OETZEL, G.R. Monitoring and testing dairy herds for metabolic disease. Vet. Clin. N. Am. Food. Anim. Pract., v.20, p.651-674, 2004. SPSS Statistics user’s guide. Version 22.0. 2013. Armonk: IBM Corp., 2013.
OSPINA, P.A.; NYDAM, D.V.; STOKOL,T. et al. Associations of elevated nonesterified fatty acids and beta-hydroxybutyrate concentrations with early lactation reproductive performance and milk production in transition dairy cattle in the northeastern United States. J. Dairy. Sci., v.93, p.1596-1603, 2010.
PAYNE, J.M. The future of presyntomatic diagnosis. Proc. Roy. Soc. Med., v.65, p.181-183, 1972.
PEEL, M.C.; FINLAYSON, B.L.; MCMAHON, T.A. Updated world map of the Köppen-Geiger climate classification. Hydrol. Earth. Syst. Sci., v.11, p.1633-1644, 2007.
QUIROZ-ROCHA, G.F.; LEBLANC, S.J.; DUFFIELD, T.F. et al. Reference limits for biochemical and hematological analytes of dairy cows one week before and one week after parturition. Can. Vet. J., v.50, p.383-388, 2009. ROJEN, B.A.; LARSEN, M.; KRISTENSEN, N.B.Effect of abomasal infusion of oligofructose on portal-drained visceral ammonia and urea-nitrogen fluxes in lactating Holstein cows. J. Dairy. Sci., v.95, p.7248-7260, 2012.
García et al.
456
Arq. Bras. Med. Vet. Zootec., v.69, n.2, p.445-456, 2017SOETAN, K.O.; OLAIYA, C.O.; OYEWOLE, O.E. The importance of mineral elements for humans, domestic animals and plants: a review. Afr. J. Food. Sci., v.4, p.200-222, 2010.
SOLBERG, H.E. Approved recommendation (1987) on the theory of reference values. Part 5. Statistical treatment of collected reference values. Determination of reference limits. Clin. Chim. Acta, v.170, p.S13-S32, 1987.
STOJEVIĆ, Z.; PIRŠLJIN, J.; MILINKOVIĆ-TUR, S. et al.Activities of AST, ALT, and GGT in clinically healthy dairy cows during lactation and in the dry period. Vet. Arhiv, v.75, p.67-73, 2005.
TEMEL, R.E.; BROWN, J.M.Biliary and non-biliary contributions to reverse cholesterol transport. Curr. Opin. Lipidol., v.23, p.85-90, 2012.
VAN SAUN, R.J. Indicators of dairy cow transition risks: metabolic profiling revisited. In: WORLD BUIATRICS CONGRESS, 26., 2010, Santiago. Proceedings... Santiago: [s.n.], 2010. p.65-77. (Abstract).
VAN SAUN, R.J.; TODD, A.; VARGA, G.A. Serum mineral concentrations and periparturient health status in Holstein dairy cows. In: WORLD BUIATRICS, CONGRESS, 24., 2006, Nice. Proceedings... Nice: [s.n.], 2006. p.65-77. (Abstract).
WESTWOOD, C.T.; LEAN, I.J.; GARVIN, J.K. Factors influencing fertility of Holstein dairy cows: a multivariate description. J. Dairy. Sci., v.85, p.3225-3237, 2002.
WHITAKER, D.A. Use and interpretation of metabolic profile. In: ANDREWS,A.H. (Ed.). The health of dairy cattle. Oxford: Wiley Blackwell, 2000. p.89-107.
ZÁRATE-MARTÍNEZ, J.P.;
VINAY-VADILLO, J.C.; CARBALLO, C.O. et al. Efecto de la alimentación con grasas protegidas en vacas de doble propósito. Agron. Mesoam., v.22, p.359-366, 2011.