www.scielo.br/aabc
Tonal vocalizations in a noisy environment: an approach
to their semi-automatic analysis and examples of its application
ROGER MUNDRY and CHRISTINA SOMMER
Institute of Biology, Department of Behavioural Biology, Free University of Berlin, Haderslebener Str. 9, 12163 Berlin, Germany
Manuscript received on January 15, 2004; accepted for publication on February 5, 2004.
ABSTRACT
Vocalizations with an emphasized fundamental are common in many species of animals. Such calls can presumably be sufficiently described by measures of their fundamental shape or ‘contour’. Here we describe a software we developed to analyze such vocalizations semi-automatically. The software is particularly de-signed to cope with vocalizations recorded in a noisy environment. Some of the algorithms implemented (e.g. signal detection, contour detection, contour measurement, validation) and some preliminary applica-tions dealing with calls of different species of birds are presented. Finally, we briefly discuss the possible significance of such vocalizations.
Key words:tonal vocalizations, contour measurement, software.
INTRODUCTION
Many animals face the problem of communicating acoustically over larger distances and/or in noisy en-vironments (e.g. Lengagne et al. 1999). Under such circumstances, the acoustic quality of a sig-nal is clearly altered between sender and receiver. These alterations include, for instance, degradation and superimposed environmental noise (e.g. Dabel-steen et al. 1993). However, animals communicat-ing under such circumstances may need to extract information from these degraded signals. A possi-ble strategy to cope with the propossi-blems associated with communication in a noisy environment is to use calls of a structure that can convey information also when being degraded and/or masked. An ideal candidate for such a call structure is a tonal vocal-ization with an emphasized and modulated funda-mental frequency. Information may then be coded
Correspondence to: Roger Mundry E-mail: [email protected]
in the particular shape of the fundamental frequency. Interestingly, many species of birds and mammals utter these types of calls.
Researchers investigating vocal communica-tion face the same problems as animal receivers. In fact, many recordings of vocalizations brought back from the field are of rather low quality, even when recording conditions were good (e.g. very small dis-tance to the subject). For insdis-tance, Arabian Babblers
We thus began to develop a software designed to measure acoustic properties also in low quality recordings of tonal calls. The software analyzes spectrograms derived from different common soft-ware packages. Basically, it involves three levels of analysis: signal detection, extraction of the funda-mental’s contour, and measuring the fundafunda-mental’s contour. Some aspects of corresponding algorithms and concepts will be outlined in the following.
SIGNAL DETECTION
The signal detection algorithm uses thresholds that are dynamically adjusted for each file to be analyzed separately. It thus can be applied to a wide range of absolute amplitudes and signal-to-noise ratios. The software also allows for the detection of several signals within a file. To cope with low signal-to-noise ratios and at the same time prevent from errors, the software initially identifies those sections of the spectrogram that are most likely to include a signal. This is done by first determining the frequency dis-tribution of the sum of amplitudes within time seg-ments. Subsequently, a cut off point is determined from this distribution and each time segment with summed amplitude in excess of that cut off point is assumed to include part of the signal. Finally, only those sections are accepted as including signal that mainly consist of time points determined as part of the signal. From these sections the algorithm then ’moves’ backward and forward and includes neigh-boring parts into the signal until a stopping criterion is met. Using the graphical interface it is possible to supervise and, if necessary, manually correct the results of the signal detection process by adding sig-nals that have not been detected or removing noise that erroneously has been detected as a call. In ad-dition, it is possible to manually adjust each signal’s start and end, separately.
CONTOUR DETECTION
The contour detection uses one of two different algo-rithms depending on whether harmonics are present. If harmonics are absent or of only minor amplitude,
contour detection is based on the determination of the frequency with the highest amplitude within each time segment. Subsequently, potential outliers are removed.
If harmonics are present, the contour detection algorithm combines the former method with linear auto-correlation analysis on the power-spectrum of a given time segment. The maximum of the auto-correlation function derived for a certain time seg-ment is then assumed to equal the fundaseg-mental fre-quency in that time segment.
Like the signal detection, the contour detec-tion algorithm initially is very conservative, and only considers those parts of the ‘detected contour’ that are most likely to represent the actual fundamental. Beginning at these ‘cores’, it then ‘moves’ back and forth to detect the fundamental’s contour in the re-maining signal. The algorithm usually runs a num-ber of times, becoming increasingly permissive until a stopping criterion is met.
The graphical user interface displays the de-tected contours on the screen allowing an evaluation of whether the algorithm performed poorly or well. In addition, we implemented a variety of measures indicating the monotony and continuity of detected contours. Given the fact that many calls’ fundamen-tals are of rather simple shape, these measures also allow for an evaluation of the success of the contour detection algorithm.
MEASURING THE FUNDAMENTAL’S CONTOUR
In the studies we have conducted so far using the developed software, we mainly applied an ap-proach that could be termed ‘parametric’ (e.g. Schrader and Hammerschmidt 1997, Naguib et al. 2001). It consists of measuring the acoustic proper-ties of contours in the time and frequency domains. The specific parameters implemented depend on the particular shape of the contours under study and partly also on the question investigated. Using con-tours that more or less resemble an inverted ‘U’ as an example (Figs. 1 and 2), some of the parameters we implemented will be described below.
We first take some basic measures like the fre-quency at the fundamental’s start, maximum and end, the duration of the call, or time at maximum frequency. In addition, we determine the mean fre-quency of the fundamental as a whole, as well as for its two sections (before and after reaching max-imum frequency). We apply this separation of calls into two sections for a variety of other measures as well. Furthermore, we determine slopes for the whole contour as well as for the two sections by simply connecting the respective endpoints. In ad-dition, we measure slopes by means of linear regres-sion analysis. Doing so allows for estimating the strength of the relation between time and frequency by determiningR2, the effect size of the regression. To describe the shape of the fundamental in more detail, we use several approaches. First, we measure the frequency at several predefined time-points, that is after the first, second and third quarter of each of the two sections of the vocalization. Sec-ond, we determine the location of ‘bends’ in the con-tour. We then measure how emphasized the bends are using the difference between regression slopes derived for the two sections before and after the bend. We are also investigating whether polyno-mial curve fitting could be an approach to measure such vocalizations. The idea is to find an equation of a form like:
f(x) =c1x6+c2x5+c3x4+c4x3+c5x2
+c6x+c7
wheref(x)denotes the frequency of the contour at
time segmentx. If all contours to be analyzed are approximated using polynomials of the same order, then these contours could perhaps be sufficiently de-scribed by the coefficientsc1, c2etc. Although
pre-sumably quite ‘unnatural’, this approach may help to avoid the ‘inflation of parameters’ that commonly arises in acoustic analysis and consequently might be very useful for statistical analyses.
EXEMPLARY APPLICATIONS
We used the software to investigate the structure of long distance contact calls (‘shouts’) of Arabian Babblers, and analyzed the resulting param-eters with regard to potential differences between subjects. Arabian Babblers are cooperatively breed-ing songbirds that live in the deserts of the Middle East. They live in groups that maintain a territory year round, and the groups most commonly con-sist of a pair of breeders and additional helpers that contribute to defending the territory, rearing the off-spring, etc. (Zahavi and Zahavi 1997). Shouts are quite loud (audible for humans at distances up to more than 500 meters) and uttered during e.g. en-counters between neighboring groups or when one bird lost its group mates. The calls usually consist of a series of similar elements, repeated at regular in-tervals (Fig. 2). Preliminary results indicate that the vocalizations from different birds clearly differed in the call’s fundamental contours.
In a second study we investigated the structure of begging calls of Wilson’s Storm Petrel Ocean-ites oceanicusnestlings. The particular question we asked was whether begging calls convey information about the nutritional need of chicks. A preliminary analysis of correlations between principal compo-nent factor scores of acoustic parameters of calls and residual chick weight indicated that aspects of the fundamentals’ shape indeed correlated with the chicks’ nutritional needs.
CONCLUSION
1 s
2
4
6
kHz
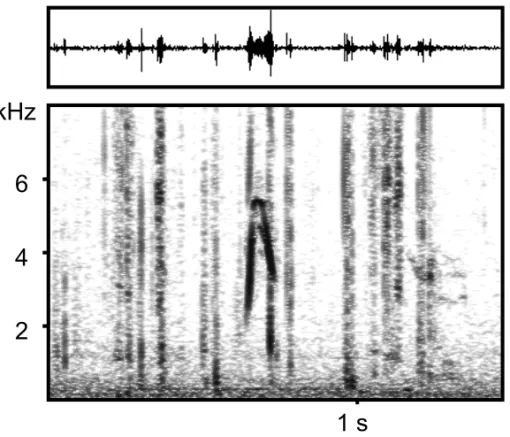
Fig. 1 – Contact call of an Arabian Babbler. Subjects commonly utter such calls during foraging. Note that the call is masked by noise (vertical lines) caused by subjects pecking on the ground.
2s 2
4 6 8 10 kHz
Fig. 2 – Far ranging contact call of an Arabian Babbler.
can be successfully extracted using the software pre-sented and may also be decoded by the intended receivers. Because the contours of fundamentals are presumably less influenced by degradation, re-verberation and environmental noise than are vocal cues, they can be measured reliably also from lower quality recordings. Focusing an acoustic analysis on the contours of fundamentals alone might thus be a reasonable means of elucidating aspects of signal meaning in animals.
ACKNOWLEDGMENTS
RESUMO
Vocalizações com uma freqüência fundamental dominante
são comuns em muitas espécies de animais.
Presumi-velmente tais sons podem ser adequadamente descritos
pelas medições da forma ou “contorno” de sua
funda-mental. Descrevemos aqui um programa computacional
que desenvolvemos para analisar essas vocalizações de
maneira semi-automática. O programa é projetado
es-pecialmente para tratar das vocalizações registradas em
ambiente ruidoso. Alguns dos algoritmos implementados
(por ex. detecção de sinal, detecção de contorno, medição
de contorno, validação) e algumas aplicações preliminares
tratando dos gritos de diversas espécies de aves são
apre-sentados. Finalmente, discutimos brevemente o possível
significado dessas vocalizações.
Palavras-chave: vocalizações tonais, medições de
con-torno, programa computacional.
REFERENCES
Bazúa-Durán C. 2004. Differences in the whistle
char-acteristics and repertoire of Bottlenose and Spinner Dolphins. An Acad Bras Cienc 76: 386-392.
Buck JR and Tyack PL. 1993. A quantitative measure of similarity forTursiops truncatussignature whistles. J Acoust Soc Am 94: 2497-2506.
Dabelsteen T, Larsen ON and Pedersen SB. 1993.
Habitat-induced degradation of sound signals: quan-tifying the effects of communication sounds and bird location on blur ratio, excess attenuation, and signal-to-noise ratio in Blackbird song. J Acoust Soc Am 93: 2206-2220.
Janik VM. 1999. Pitfalls in the categorization of
be-haviour: a comparison of dolphin whistle classifica-tion methods. Anim Behav 57: 133-143.
Lengagne T, Aubin T, Lauga J and Jouventin P. 1999. How do King Penguins (Aptenodytes patago-nicus) apply the mathematical theory of information to communicate in windy conditions? Proc Royal Soc London, B 266: 1623-1628.
McCowan B and Reiss D. 2001. The fallacy of ‘signa-ture whistles’ in Bottlenose Dolphins: a comparative perspective of ‘signature information’ in animal vo-calizations. Anim Behav 62: 1151-1162.
Naguib M, Hammerschmidt K and Wirth J. 2001.
Mi-crogeographic variation, habitat effects and individ-ual signature cues in calls of Chiffchaffs Phyllosco-pus collybita canarensis. Ethology 107: 341-355.
Schrader L and Hammerschmidt K. 1997.
Computer-aided analysis of acoustic parameters in animal vocal-izations: a multi-parametric approach. Bioacoustics 7: 247-265.