Investigation of Austenitic Stainless Steel Coatings on Mild Steel Produced by Friction
Surfacing Using a Conventional CNC Machining Center
Fernanda Troysia, Klaus Silvaa, Ítalo dos Santosa, Pedro Britoa*
Received: April 24, 2018; Revised: October 29, 2018; Accepted: December 04, 2018
The friction surfacing process allows deposition of similar and dissimilar coatings in the solid state, avoiding some of the problems associated with conventional coating methods in which fusion is involved. In the present work, a viability assessment of producing AISI 304 austenitic stainless steel coatings on AISI 1020 low-carbon steel substrates using a machining center with Computerized Numerical Control
(CNC) instead of dedicated friction surfacing equipment was pursued. The influence of consumable
rod rotation and translation speed, as well as substrate surface roughness on the geometry and adhesion of the coatings was evaluated. The microstructure of the stainless steel coatings was investigated by optical and scanning electron microscopy, while microhardness analysis was performed in order to evaluate properties near the coating-substrate interface. Finally, the electrochemical corrosion behavior of the coatings and the as-received AISI 304 steel consumables in 0.5M H2SO4 solution containing naturally dissolved O2 was compared. The results revealed that the friction surfacing process can be applied in non-specialized machinery, since the manufactured coatings exhibited good adhesion and
corrosion resistance. The formation of hard bands in the coatings was identified near the interface region and the adhesion of the coatings was found to be influenced by initial substrate roughness.
Keywords: Friction surfacing, stainless steel, microstructure, corrosion.
*e-mail: ppbrito@gmail.com
1. Introduction
The friction surfacing (FS) process is a solid state joining technique which can be applied for producing coatings on similar and dissimilar substrates with the objective of modifying or repairing surfaces. The basics of the process are illustrated in Figure 1. Essentially, a rotating consumable rod is forced upon a substrate material which leads to friction between the surfaces and intense heat generation. As the temperature rises, yield strength at the tip of the consumable rod is reduced, which causes intense plastic deformation
and the development of a visco-plastic material flow. This is accompanied by the formation of a characteristic flash at
the consumable rod tip, as also shown in Figure 1. After an initial dwell time, relative motion between consumable rod and substrate leads to the formation of a longitudinal deposit.
The metallurgical effects which occur during the process as
well as details regarding material transfer mechanisms have been explored by previous researchers 1-4. The main operation parameters are axial force (F), consumable rod rotation (R)
and forward speed (V). These parameters bear significant influence on the geometry of the coating and its mechanical
properties. As such, numerous studies have been performed with the purpose of optimizing or modeling deposition
conditions for different coating-substrate combinations 5-9. Normally, the process is considered to take place entirely in the solid state because the amount of friction heat
generated decreases with temperature such that ultimately the materials melting point is not reached 10,11. Thus, some problems that occur in coating deposition techniques in which
fusion is involved, such as solidification-induced cracks,
pores created by gas imprisonment, residual stresses and distortion (especially when joining dissimilar metals) can be avoided or reduced. Because of these positive characteristics, the FS process has been applied or considered for various industrial applications: recovery or repair of axles, repair of aged structural materials in nuclear plants, anchor chains and steel components in general, deposition of hard layers in agricultural and oil equipment and deposition of corrosion resistant coatings on low-carbon steel components 12,13.
The FS process is particularly interesting for situations
which require modification of surface properties for increasing
corrosion resistance. A number of researchers have pursued the development of stainless steel coatings on carbon or alloy steels for this purpose by investigating the relation between process parameters and coating characteristics, such as thickness, width and adhesion to the substrate 5,7,14,15. With respect to microstructure, in the case of austenitic stainless steel coatings, it has been established that dynamic
recrystallization takes place during FS leading to significant grain refinement 16-18, similar to the microstructure evolution that results from friction stir welding processes 19. Relatively less information can be found, however, on the actual corrosion behavior of these coatings. The existing reports have shown that austenitic and martensitic stainless steel coatings produced by FS exhibited superior corrosion resistance in
a Departamento de Engenharia Mecânica, Pontifícia Universidade Católica de Minas Gerais, Av. Dom
comparison to coatings manufactured by conventional arc-welding deposition techniques 20,21. On the other hand, for AISI 304 austenitic stainless steel coatings, it was found that pitting corrosion resistance in comparison to bulk stainless steel samples was considerably impaired because of the formation of strain-induced martensite 22.
Recently, attempts have been made to broaden possible applications for the FS process by its employment in non-specialized equipment 23-25. In an attempt to further explore such possibilities and to advance the current knowledge of corrosion behavior and microstructure formation in FS stainless steel coatings, the present study was conducted. The objective was to investigate the applicability of the FS process in a Computerized Numerical Control (CNC) machining center for producing AISI 304 stainless steel coatings on AISI 1020 carbon steel substrates. To this end, process parameters were adjusted for the system at hand, which does not allow for control of the axial force exerted by the consumable rod on the substrate, as in dedicated FS machinery, and correlated with coating characteristics.
2. Experimental Procedure
2.1 Materials
The materials used in FS experiments were 200 x 100 x 8 mm AISI 1020 carbon steel plates, received initially in the hot rolled condition, and AISI 304 austenitic stainless steel circular bars with 100 mm length and 15.4 mm diameter. The chemical composition of the materials is presented in Table 1. In all cases, the coatings were produced along the rolling direction of the substrate plates. Prior to FS, the consumable
rods were faced by turning and two different techniques
were employed in order to remove the mill scale from the
substrate materials: finish milling, which resulted in an
average surface roughness of Ra = 0.66 µm, and a rotating steel brush, which led to an average surface roughness of Ra = 2.95 µm.
2.2 Coating deposition
The FS procedures were carried out in a ROMI Discover 560 CNC machining center with a power output of 11 kW and maximum rotation of 10000 rpm, as in previous investigations 25,26. In order to assess the influence of process parameters on coating characteristics, an experimental plan was developed using a simple Design of Experiments (DoE) methodology which consisted of a complete factorial design with three factors and two levels per factor, which yielded a total of 23 distinct experimental conditions 27. The parameters chosen as factors were surface roughness (Ra, 0.66 and 2.95 µm), rotation (1500 and 2000 rpm) and travel speed (190 and 250 mm/min). The roughness of the substrate material can be
expected to modify the friction coefficient between the faying surfaces and can therefore influence heat generation during
the FS process. It is common in dedicated FS machinery that the axial force is controlled during the process, which was not possible with the CNC machining center employed. In the present study, therefore, the consumable rod was forced onto the substrate by using a 0.5 ratio between vertical and horizontal motions 23, which also allowed control of the feed rate. The value was chosen after initial tests for determining viable process parameters revealed comparatively worse results for 0.15, 0.4 and 1.0 ratios 26.
2.3 Characterization procedures
The coatings produced by FS were analyzed in terms of their basic geometry (average width, determined by using a standard capiler and thickness, determined from cross-section
macrographs), as well as microhardness, push-off strength 7 and microstructure. Vickers hardness was evaluated on the cross section of the coatings using a Shimadzu HMV-2T tester with an applied load of 100 gf and 20 s holding time.
The push-off test was performed by drilling a 6 mm diameter
hole on the back side of the coated plate. Hole depth was limited to the thickness of the substrate plate in order to
avoid damage to the coating prior to testing. The push-off test
itself consisted in moving a 5.95 mm diameter rod through the 6 mm hole and measuring the force necessary to detach
the coating from the substrate. The Push-off Strength (PS)
considered in each case was taken as the maximum value of the applied force prior to coating fracture or its detachment
Figure 1. Schematic of the FS process.
Table 1. Chemical composition of the materials used in the FS experiments (%wt.)
Material C Mn Si Cr Ni P S Mo N Fe
304 steel 0.057 1.90 0.143 18.42 8.092 0.026 0.03 0.340 0.906 bal.
from the substrate. For each of the 8 tested experimental
conditions, the push-off test was performed 3 times.
The microstructure of the coatings produced by FS was evaluated by optical microscopy (OM) and scanning electron microscopy (SEM). Further microstructure information was
obtained by X-Ray Diffraction (XRD) experiments (Cu Kα
radiation) which were performed on the consumable rod material, at the surface of the deposited coatings and at a 100 µm distance from the substrate/coating interface. In all cases, the analyzed XRD samples were milled using the
same machining parameters in order to obtain flat surfaces
with the same surface roughness.
2.4 Electrochemical corrosion behavior
In order to evaluate whether the FS process could hinder the stainless steel coating performance in acid media (in which stainless steels are commonly applied) the electrochemical corrosion behaviour of a selected coating and the consumable rod material was compared. The tests were carried out in an IVIUM Vertex potentiostat connected to a 400 mL horizontal
cell prepared for flat specimens and each electrochemical method was applied to three different samples obtained under
the same deposition conditions. A three electrode setup was used with a Pt wire counter electrode and a Ag-AgCl (in
saturated KCl) reference electrode. Prior to the experiments, the samples were milled in order to produce a flat surface and then ground and polished down to a 1 µm finish in diamond
suspension. All electrochemical measurements were carried out in a 0.5M H2SO4 solution containing naturally dissolved O2, which was prepared by dissolving 27.7 mL of 98% purity H2SO4 into 1000 mL distilled water. The samples were analysed by electrochemical impedance spectroscopy (EIS) and potentiodynamic polarization. Prior to all EIS measurements, the open circuit electrode potential (OCP) was monitored for 5,400 s. The EIS tests were carried out at the stabilized OCP within a frequency range of 100,000 to 0.01 Hz and a sinusoidal excitation signal of 10 mV. Data acquisition was set at 5 points per decade for a total of 36 frequencies and the results were analysed by modelling the equivalent circuit. The polarization curves were obtained after the EIS measurements by scanning over a -0.5 to 1.2 V/Ag-AgCl range with a 0.2 mV/s scan rate. The corrosion current density (icorr) was determined by extrapolation of the cathodic Tafel line to the corrosion potential (Ecorr). This
procedure was adopted because of different metal dissolution reactions, which yield non-linear or poorly defined anodic
Tafel lines 28,29.
3. Results and Discussion
3.1 Coating characteristics
The basic coating geometry characteristics, as well as
push-off strength, obtained for each experimental condition
tested are presented in Table 2. The standard deviations are given in parentheses next to the corresponding average
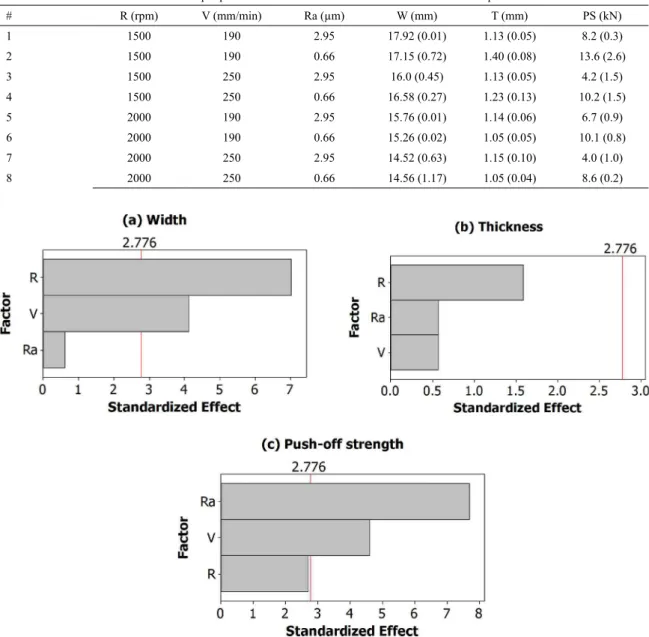
values. The relative influence of input parameters on coating
characteristics was assessed in terms of Pareto diagrams, which are shown in Figure 2(a-c) for, respectively, width
(W), thickness (T) and push-off strength (PS). The results presented in Figure 2 designate the most significant process
parameter for each output variable and also if a parameter
does not affect a given output, i.e. when the standardized
effect is lower than the indicated value of 2.776.
The effects of rotation and forward speed on coating
geometry have already been considered in published
literature and the existing trends could be confirmed in the
present study 11. In summary, coating width is lowered with increasing rotation, which was found to be the most influential
input parameter regarding this characteristic in the present
study. Forward speed did not significantly influence coating
thickness, but had a negative correlation with coating width. These observations are relevant because they show that in non-specialized equipment the overall behavior of the FS process is similar to that obtained in dedicated setups, thus showing the applicability of the process in the former situation for producing stainless steel coatings on carbon steel.
One aspect highlighted in the present study which has received relatively less attention in previous reports is the role of the substrate surface roughness. In this investigation,
it was found that surface roughness did not have a significant influence on coating geometry (thickness and width) but
had a strong impact on the adhesion between coating and
substrate, evaluated in terms of push-off strength: the lower the substrate roughness, the higher the push-off strength (for Ra = 2.95 µm, the average push-off strength was 5.8 kN whereas for Ra = 0.66 µm the average push-off strength
was 10.6kN). In a previous report concerning the deposition
of Al-alloy on mild steel the opposite effect was observed 25. In that case, however, the consumable rod hardness was significantly smaller compared to the substrate. As a
consequence, the presence of larger surface asperities (on the substrate) could contribute as anchorage sites providing mechanical interlocking and improving adhesion. In the present case, it is possible to speculate that lower surface roughness values have a positive impact on adhesion because of the
increase in the effective contact area between consumable
rod and substrate plate. In fact, it is worth noticing that for the samples produced with low surface roughness (#2, 4, 6,
8), the push-off test resulted in hole punctured through the
coating, with minor local detachment, as shown in Figure 3. For the remaining situations (samples #1, 3, 5, 7) the coating was lifted and detached along its complete width, indicating
poor adhesion. A systematic investigation of the influence
3.2 Coating microstructure
The microstructure of the coatings was analyzed by optical microscopy and the mechanical properties were evaluated in terms of Vickers microhardness for all experimental conditions. An overview of the coating cross-section is presented in Figure 4(a), along with micrographs corresponding to coating top surface, consumable rod base material and mid-sections of the advancing side, center and retreating side, respectively, in Figures 4(b-f). The results
reveal grain refinement in the entire coating. The average
grain size, evaluated by using the intercept method and a grain count of 200 grains, was found to be 70 ± 10 µm for
Table 2. Summary of experimental plan and results. The standard deviations are presented in parenthesis next to corresponding measurements (R – rotation, V – forward speed, W – width, T – thickness and PS – push-off strength).
Input parameters Output variables
# R (rpm) V (mm/min) Ra (µm) W (mm) T (mm) PS (kN)
1 1500 190 2.95 17.92 (0.01) 1.13 (0.05) 8.2 (0.3)
2 1500 190 0.66 17.15 (0.72) 1.40 (0.08) 13.6 (2.6)
3 1500 250 2.95 16.0 (0.45) 1.13 (0.05) 4.2 (1.5)
4 1500 250 0.66 16.58 (0.27) 1.23 (0.13) 10.2 (1.5)
5 2000 190 2.95 15.76 (0.01) 1.14 (0.06) 6.7 (0.9)
6 2000 190 0.66 15.26 (0.02) 1.05 (0.05) 10.1 (0.8)
7 2000 250 2.95 14.52 (0.63) 1.15 (0.10) 4.0 (1.0)
8 2000 250 0.66 14.56 (1.17) 1.05 (0.04) 8.6 (0.2)
Figure 2. Pareto diagrams for (a) width, (b) thickness and (c) push-off strength. Factors “Ra”, “V” and “R" are surface roughness, forward
speed and rotation, respectively.
the base material while for the coating presented in Figure 4 (sample #2), the values were found to be 7.0 ± 4.0 µm for the advancing side, 10 ± 2.0 µm for the center and 7.0 ± 4.0 µm for the retreating side. The surface hardness of the coating analyzed in Figure 4 was also determined and the values obtained were 270 ± 20 HV0.025 and 220 ± 10 HV0.025 for the base material and coating, respectively (average of 8 measurements). A low applied force was employed (25 gf) in order to restrict indentation depth, such that the hardness
values reflect differences in surface conditions. These results, along with the observed grain refinement, are consistent with
the occurrence of dynamic recrystallization during the FS process, in agreement with previous reports 16.
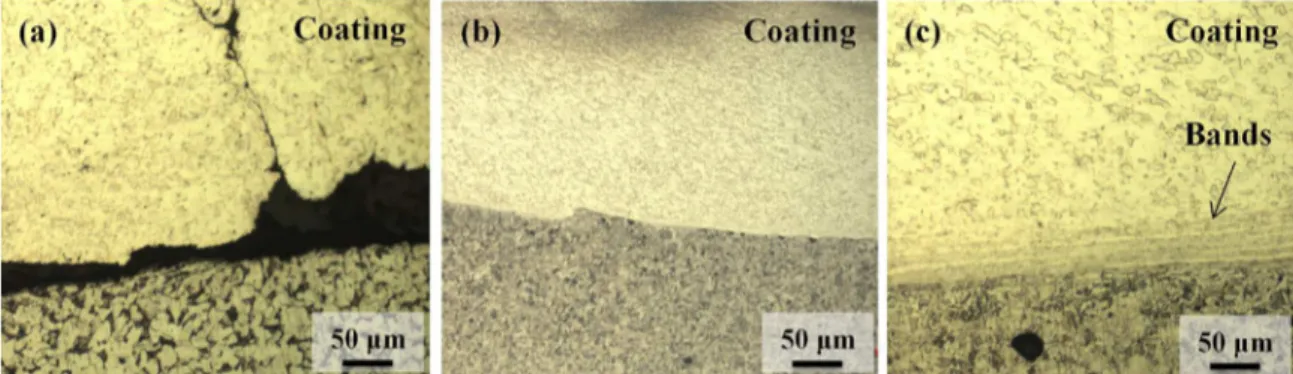
Details of the coating/substrate interface are explored in Figure 5. A common characteristic observed in all samples was the unbounded undercut region near the edges of the coating, as reported in published literature 5,7 and exemplified in Figure 5(a). Apart from that, in general, the interface at the
center of the coatings was found to be smooth, continuous and absent of defects such as pores or inclusions, as shown
in Figure 5(b). However, for some cases (specifically,
samples #1, #2 and #6, Table 2) it was possible to notice the presence of banded structures, parallel to the interface, on the side of the coating, as indicated in Figure 5(c). In these
bands, elevated hardness values were identified, as shown
in Figure 6. In contrast, for the remaining samples, hardness values near the interface on the stainless steel side varied between approximately 210 and 260 HV within a distance of 100 µm from the interface indicating that virtually no strain-hardening takes place as a consequence of dynamic recrystallization.
The elevated hardness values observed in Figure 6 suggest transformation of the austenite phase occurred during the FS process. In order to clarify this possibility the coating produced on sample #2 (Figure 6) was analyzed by XRD and the results were compared to the spectrum
obtained for a reference sample from the consumable rod
material, as presented in Figure 7. The diffraction pattern labeled as “interface” in Figure 7 was obtained after milling
the coating to a distance of 100 µm from the interface, so that the regions containing the banded structures could be
assessed. The spectrum labeled as “coating” corresponds, in
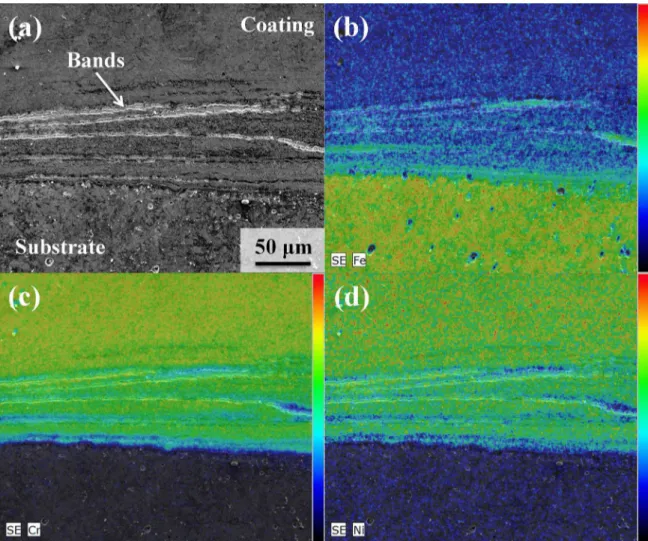
turn, to the external surface of the FS coating. In Figure 8, the morphology of the banded region is presented with
higher magnification, along with EDX maps for chemical
composition analysis.
It is possible to notice that for the initial consumable
rod material only austenite reflections could be identified and at the external surface of the coating the same reflections
are present, indicating the similar phase composition. In comparison to the reference sample, it can be seen that
the austenite peaks are shifted to higher diffraction angles
(consider e.g. the 111-peak at 2θ ~44°) which is a possible
indication of the presence of internal stresses in the coating.
Conversely, a comparison of the diffraction spectra from the
reference material and the interface region reveals larger
contrasts, with the presence of distinct reflections that could be ascribed to σ-phase and martensite (α’). The σ-phase is a
Cr-rich hard intermetallic which normally appears in ageing treatments of stainless steels and is considered undesirable
because its presence leads to reductions in toughness and corrosion resistance 30,31 and has been previously identified with banded morphology after friction processing of austenitic stainless steels 32-34. According to Park et al. 32, the formation of σ-phase directly from austenite requires long times, but can be accelerated if precipitated from δ-ferrite when the
material undergoes plastic deformation with high strain rates and dynamic recrystallization, as in the case of FS. The
formation of δ-ferrite is in turn possible with FS because of
the elevated temperatures attained during the process. No
residual δ-ferrite could, however, be identified by XRD in
the present study.
The formation of σ-phase could not be unambiguously
demonstrated, however, since the EDX analysis presented
in Figure 8 revealed that the previously identified bands
possess a lower amount of Cr in comparison to the bulk of the stainless steel coating. The banded regions exhibit instead elevated amounts of Fe, which indicates that they might be instead formed by particles removed from the substrate and incorporated into the coating by mechanical stirring. In addition, they are enriched in Cr (compared to the substrate material), which would assist the formation of martensite upon cooling after the process, thus explaining the elevated hardness values reported in Figure 6.
Figure 5. Typical characteristics observed at coating/substrate interface: (a) undercut region at the edge of coating (sample #5), (b) smooth interface at center region (sample #5) and (c) presence of banded structures at center region (sample #6).
Figure 6. Microhardness indentations at banded regions identified
3.3 Corrosion behavior
The evolution of OCP over time is presented in Figure 9 for the consumable rod material (reference) and coating #2,
which yielded best results in the push-off test (Table 2). It is
possible to notice that the OCP is stabilized in both samples
after 5,400 s. The results indicate a persistent difference of
approximately 0.1V between coating and reference, with the coating exhibiting less negative (more noble) behaviour. This might be associated with the fact that the coating exhibited a recrystallized microstructure with a lower degree of strain hardening compared to the base material, as presented in Figure 4 and revealed by the corresponding surface hardness values.
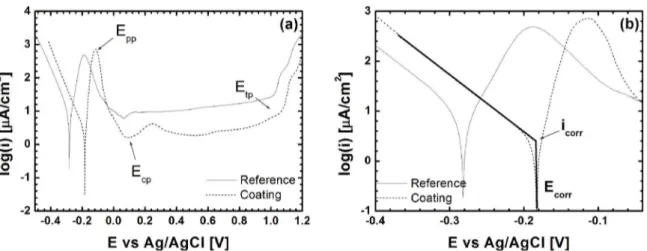
The polarization curves obtained for the reference and coating materials are presented in Figure 10. The complete curves, over the entire scanned potential range, are shown in Figure 10(a) while a highlight of the Tafel region is shown in Figure 10(b). The main parameters that can be extracted from the polarization curves shown in Figure 10 are presented in Tables 3 and 4. The passive current density (ipass) was
determined, in each case, by considering the average value over the entire passivity range, i.e. between the potential for complete passivation (Ecp) and the transpassive potential
Figure 8. SEM/EDX analysis of the interface region of FS coating #2: (a) analyzed region as revealed by SEI observation mode, (b) Fe map, (c) Cr map and (d) Ni map.
Figure 10. Polarization curves obtained in 0.5M H2SO4 containing naturally dissolved O2 for consumable rod material (reference) and
FS coating #2 (a). Highlight of the Tafel region (b).
(Etp). In Table 4, the values for anodic and cathodic Tafel slopes are also presented and for both materials similar values were obtained (even though ba was determined by linear extrapolation of a considerably narrower range in comparison to bc). The values obtained for bc are close to the theoretical Tafel slope value of -0.120mV/decade obtained by assuming a single electron transfer step for the hydrogen evolution reaction 35:
(1)
In turn, the anodic Tafel slope values are compatible with Fe dissolution forming Fe2+ by either the Bockris-Kelly (40mV/decade) or Heusler mechanisms (30 mV/decade) 35. However, it is not possible to reliably ascertain the active mechanism in each case because the anodic Tafel lines
obtained experimentally were not as well-defined as for
the cathodic reaction.
From the results reported in Table 4 it is possible to notice that the Ecorr values followed the trend observed for the evolution of OCP presented in Fig. 9, i.e. the coating behaviour was slightly nobler in comparison to the substrate. The corrosion current density was also found to be smaller
for the FS coating, even though the observed difference
falls between the limits of the standard deviation of each measure (Table 4). The results from the EIS measurements are presented in the form of Nyquist plots in Figure 11 along with the equivalent circuit model. The corresponding numerical results are registered in Table 5. In the equivalent
circuit used to model the passive film and electrolyte
Table 3. Passivity characteristics for reference and coating samples obtained in naturally aerated 0.5M H2SO4 (Epp – potential for primary
passivation; icrt – critical current density for passivation; Ecp – potential for complete passivation; ipass – passive current density; Etp – transpassive potential). The standard deviation is given in parentheses next to the average values.
Sample Epp(V/Ag-AgCl) icrt(µA/cm2) E
cp(V/Ag-AgCl) ipass(µA/cm
2) E
tp(V/Ag-AgCl)
Reference -0.20 (0.08) 660 (200) 0.03 (0.06) 12.3 (1.0) 1.00 (0.10)
Coating -0.10 (0.02) 530 (250) 0.01 (0.04) 4.6 (2.6) 1.00 (0.10
ensemble, Rs is the resistance due to the solution and Rp is the polarization resistance. The plots presented in Figure 11 exhibit a depressed capacitive arc which was modelled by
using a constant phase element (CPE), identified by Q. The
impedance behaviour of such an element is given by 36:
(2)
in which Q is a constant, ω is the frequency and n is an
adjustable factor which can assume values ranging from -1, in which case the CPE element acts as an inductor, to 1, for which behaviour is that of an ideal capacitor.
It is possible to compare the polarization results presented in Table 4 by the EIS analyses, since Rp is inversely proportional to icorr35:
(3)
Using the values determined for ba, bc and Rp (Tables 4 and 5) in Equation (2) it was possible to obtain a second measure for
icorr: 13.5 ± 8 µA/cm2 and 17.0 ± 9 µA/cm2 for the reference and coating, respectively. As noticed for the corrosion current density determined by the polarization experiments, the values fall within the evaluated standard deviations even though the trend is reversed, i.e. the coating exhibited larger average values for icorr compared to the substrate. In previous investigations, an increase of icorr in coatings obtained by FS was attributed to the formation of a more chemically active surface with higher defect density 20,21. For instance, Puli and Janaki Ram 21 noticed an increase in corrosion rate of
H
ads+
H
+
e
"
H
2+
-Z
CPEQ j
n 1~
=
"
R
W
%
-.
i
corr2 303
R
p1
b
1
b
a c
1
=
+
-T
Y
Table 4. Corrosion parameters for reference and coating samples in naturally aerated 0.5M H2SO4 (Ecorr – Corrosion potential; icorr – corrosion
current density; bc – cathodic Tafel slope; ba – anodic Tafel slope). The standard deviation is given in parentheses next to the average values.
Sample Ecorr(V/Ag-AgCl) icorr(µA/cm
2) b
c(V/dec) ba(V/dec)
Reference -0.28 (0.07) 17.5 (9.3) -0.095 (0.01) 0.036 (0.008)
Coating -0.18 (0.01) 7.0 (9.5) -0.093 (0.01) 0.030 (0.014)
approximately 6 times when comparing bulk and friction surfaced AISI 316L steels. In the present work, however,
the differences in corrosion rate are relatively smaller since
the coating top surface was found to be recrystallized and less strain-hardened than the base material.
It is worth considering that, even though no significant differences in the uniform corrosion rate between base material and coating were identified, it is apparent that
the FS coating exhibited superior corrosion resistance concerning passive behaviour. The results reveal that both tested materials exhibit active-passive behaviour and similar passivity ranges, taken as Etp - Ecp, but the coating exhibited lower values for the passive current density compared to the base material (although the critical current density was
roughly equivalent), as shown in Table 3. The differences in
ipass cannot be dismissed and indicate that a more compact
and dense passive film was formed on the coating compared
to the base material. These results are consistent with the considerations of Ralston and Birbilis 37 that decreases in grain size improve passive film stability because of the increased diffusion rates along grain boundaries. As a consequence, it is found that the microstructure modifications induced at the
Table 5. Impedance parameters for reference and coating samples (Rs – solution impedance; RP – polarization resistance; Q – constant phase element due to surface film). The standard deviation is given in parentheses next to the average values.
Sample Rs(Ωcm
2) R
p(Ωcm
2) Q(×10-4Fsn-1cm-2) n
Reference 7.8 (1.6) 850 (500) 3.7 (1.8) 0.94 (0.06)
Coating 4.1 (1.4) 700 (400) 2.1 (0.3) 0.88 (0.04)
Figure 11. Nyquist diagrams obtained at OCP after 5400 s in 0.5M H2SO4 containing naturally dissolved O2 for the consumable rod material (reference) and FS coating #2 (a). Equivalent circuit used to model EIS data (b).
surface of the coatings by the FS process may be beneficial
regarding corrosion resistance in the tested medium.
4. Conclusions
The FS process was applied in a machining center for the production of AISI 304 stainless steel coatings on AISI 1020 carbon steel substrates by varying rotation, forward speed and
substrate roughness. The influence of rotation and forward
speed on coating geometry was consistent to existing reports
and the adhesion of the coatings was influenced by the surface
roughness of the substrate plates. It was possible to identify the formation of hard banded structures near the interface on the stainless steel coatings but the surface of the coatings presented the same phase composition as the consumable
rod material with equiaxed and refined grains. Analysis of
the electrochemical corrosion behavior of the coating and base material by EIS and potentiodynamic polarization
did not reveal significant differences in corrosion rate, but
investigated materials, the FS process can be successfully applied in non-specialized equipment.
5. Acknowledgements
This work was partially funded by the Coordenação de Aperfeiçoamento de Pessoal de Nível Superior - Brasil (CAPES) - Finance Code 001. Author P. Brito is supported
by a CNPq PQ grant. The authors would also like to
acknowledge the Center of Microscopy at the Universidade Federal de Minas Gerais (http://www.microscopia.ufmg. br) for providing the equipment and technical support for experiments involving electron microscopy.
6. References
1. Fukakusa K. On the characteristics of the rotational contact plane - a fundamental study of friction surfacing. Welding International. 1996;10(7):524-529.
2. Bedford GM, Vitanov VI, Voutchkov II. On the thermo-mechanical events during friction surfacing of high speed steels. Surface and Coatings Technology. 2001;141(1):34-39.
3. Gandra J, Miranda RM, Vilaça P. Performance analysis of friction surfacing. Journal of Materials Processing Technology. 2012;212(8):1676-1686.
4. Liu XM, Zou ZD, Zhang YH, Qu SY, Wang XH. Transferring mechanism of the coating rod in friction surfacing. Surface and Coatings Technology. 2008;202(9):1889-1894.
5. Vitanov VI, Voutchkov II, Bedford GM. Decision support system to optimize the Fritec (friction surfacing) process.
Journal of Materials Processing Technology. 2000;107(1-3):236-242.
6. Vitanov VI, Voutchkov II, Bedford GM. Neurofuzzy approach to process parameter selection for friction surfacing applications.
Surface and Coatings Technology. 2001;140(3):256-262.
7. Vitanov VI, Voutchkov II. Process parameters selection for friction surfacing applications using intelligent decision support. Journal of Materials Processing Technology. 2005;159(1):27-32.
8. Vitanov VI, Javaid N. Investigation of the thermal field in micro friction surfacing. Surface and Coatings Technology. 2010;204(16-17):2624-2631.
9. Fitseva V, Krohn H, Hanke S, dos Santos JF. Friction surfacing of Ti-6Al-4V: Process characteristics and deposition behaviour at various rotational speeds. Surface and Coatings Technology. 2015;278:56-63.
10. Bedford GM, Richards PJ. On the absence of dilution in friction surfacing and lateral friction welding. In: 1st International Conference on Surface Engineering; 1985 Jun 25-28; Brighton, SSX, United Kingdom. p. 279-290.
11. Gandra J, Krohn H, Miranda RM, Vilaça P, Quintino L, dos Santos JF. Friction Surfacing - A review. Journal of Materials Processing Technology. 2014;214:1062-1093.
12. Yamashita Y, Fujita K. Newly Developed Repairs on Welded Area of LWR Stainless Steel by Friction Surfacing. Journal of Nuclear Science and Technology. 2001;38(10):896-900.
13. de Macedo MLK, Pinheiro GA, dos Santos JF, Strohaecker TR. Deposit by friction surfacing and its applications. Welding International. 2010;24(6):422-431.
14. Khalid Rafi H, Janaki Ram GD, Panikumar G, Prasad Rao K. Friction Surfacing of Austenitic Stainless Steel on Low Carbon Steel: Studies on the Effects of Traverse Speed. In: Proceedings of the World Congress on Engineering - WCE 2010; 2010 Jun 30-Jul 2; London, United Kingdom.
15. Govardhan D, Kumar ACS, Murti KGK, Madhusudhan Reddy G. Characterization of austenitic stainless steel friction surfaced deposit over low carbon steel. Materials & Design (1980-2015). 2012;36:206-214.
16. Puli R, Janaki Ram GD. Dynamic recrystallization in friction surfaced austenitic stainless steel coatings. Materials Characterization. 2012;74:49-54.
17. Khalid Rafi H, Kishore Babu N, Phanikumar G, Prasad Rao K. Microstructural Evolution During Friction Surfacing of Austenitic Stainless Steel AISI 304 on Low Carbon Steel. Metallurgical and Materials Transactions A. 2013;44(1):345-350.
18. Vilaça P, Hänninen H, Saukkonen T, Miranda RM. Differences between secondary and primary flash formation on coating of HSS with AISI 316 using friction surfacing. Welding in the World. 2014;58(5):661-671.
19. Zhang H, Wang D, Xue P, Wu LH, Ni DR, Ma ZY. Microstructural evolution and pitting corrosion behavior of friction stir welded joint of high nitrogen stainless steel. Materials & Design. 2016;110:802-810.
20. Puli R, Janaki Ram GD. Wear and corrosion performance of AISI 410 martensitic stainless steel coatings produced using friction surfacing and manual metal arc welding. Surface and Coatings Technology. 2012;209:1-7.
21. Puli R, Janaki Ram GD. Corrosion performance of AISI 316L friction surfaced coatings. Corrosion Science. 2012;62:95-103. 22. Singh AK, Madusudhan Reddy G, Srinvas Rao K. Pitting corrosion
resistance and bond strength of stainless steel overlay by friction surfacing on high strength low alloy steel. Defence Technology. 2015;11(3):299-307.
23. Vitanov VI, Javaid N, Stephenson DJ. Application of response surface methodology for the optimization of micro friction surfacing process. Surface and Coatings Technology. 2010;204(21-22):3501-3508.
24. Galvis JC, Oliveira PHF, Hupalo MF, Martins JP, Carvalho ALM. Influence of friction surfacing process parameters to deposit AA6351-T6 over AA5052-H32 using conventional milling machine. Journal of Materials Processing Technology. 2017;245:91-105.
26. Troysi FCTD, Santos IB, Silva KHS, Brito PP. Analysis of the friction surfacing process applied in a CNC machining center for deposition of austenitic stainless steel on carbon steel substrates. In: Proceedings of the 9th Brazilian National Congress of Mechanical Engineering; 2016 Aug 21-25; Fortaleza, CE, Brazil. p. 1-9.
27. Montgomery DC. Design and Analysis of Experiments. 8th ed. Hoboken: John Wiley & Sons; 2013.
28. Troselius L. Polarization performance of stainless steels in H2SO4 and HCl. Corrosion Science. 1971;11(7):473-484.
29. Hermas AA, Morad MS. A comparative study on the corrosion behaviour of 304 austenitic stainless steel in sulfamic and sulfuric acid solutions. Corrosion Science. 2008;50(9):2710-2717.
30. Magnabosco R. Kinetics of sigma phase formation in a Duplex Stainless Steel. Materials Research. 2009;12(3):321-327.
31. Hajian M, Abdollah-zadeh A, Rezaei-Nejad SS, Assadi H, Hadavi SMM, Chung K, et al. Microstructure and mechanical properties of friction stir processed AISI 316L stainless steel. Materials & Design. 2015;67:82-94.
32. Park SHC, Sato YS, Kokawa H, Okamoto K, Hirano S, Inagaki M. Rapid formation of the sigma phase in 304 stainless steel during friction stir welding. Scripta Materialia. 2003;49(12):1175-1180.
33. Reynolds AP, Tang W, Gnaupel-Herold T, Prask H. Structure, properties, and residual stress of 304L stainless steel friction stir welds. Scripta Materialia. 2003;48(9):1289-1294.
34. Chen YC, Fujii H, Tsumura T, Kitagawa Y, Nakata K, Ikeuchi K, et al. Banded structure and its distribution in friction stir processing of 316L austenitic stainless steel. Journal of Nuclear Materials. 2012;420(1-3):497-500.
35. McCafferty E. Introduction to Corrosion Science. 1st ed. New York: Springer-Velag; 2010.
36. Stoynov Z. Impedance modelling and data processing: structural and parametrical estimation. Electrochimica Acta. 1990;35(10):1493-1499.