Article
*e-mail: [email protected]
Geochemical Markers as a Tool to Assess Sedimentary Organic Matter Sources
of the Laguna Estuarine System, South Brazil: Aliphatic and Polycyclic Aromatic
Hydrocarbons
Rafael Tarozo,a,b Morgana Frenaa and Luiz Augusto S. Madureira*,a
aDepartamento de Química, Universidade Federal de Santa Catarina,
88040-900 Florianópolis-SC, Brazil
bDepartment of Geological Sciences, Brown University, 02912 Providence-RI, USA
Amostras de sedimentos supericiais do Sistema Estuarino de Laguna foram analisadas
objetivando a identiicação das fontes de matéria orgânica. Razões entre n-alcanos selecionados,
elevados teores de hidrocarbonetos alifáticos (HA) (média de 9.168 µg g-1 de carbono orgânico, CO)
e policíclicos aromáticos (HPA) (média total de 426.593 ng g-1 CO), e a distribuição de hopanos
com estereoquímica αβ detectados nas amostras da Lagoa de Santo Antônio foram evidências de
que o aporte de hidrocarbonetos petrogênicos prevalece sobre os de fontes naturais. Nas demais
amostras estudadas, a distribuição de HA (de 38 até 2.749 µg g-1 CO), a detecção de hopenos e
hopanos-ββ sugerem hidrocarbonetos de fontes mistas. Todavia, o teor de HPA em todas as amostras
(de 7.731 até 786.469 ng g-1 CO, sendo que os aromáticos alquilados representaram > 92% do total)
revelou contaminação petrogênica crítica. As atividades pesqueira e urbana são fontes potenciais dos hidrocarbonetos petrogênicos detectados nas amostras sedimentares.
Surface sediment samples from the Laguna Estuarine System were analyzed to identify organic matter sources. The ratios between selected n-alkanes, high concentrations of aliphatic hydrocarbons
(AH) (average of 9,168 µg g-1 of organic carbon, OC) and polycyclic aromatic hydrocarbons (PAH)
(total average of 426,593 ng g-1 OC), and the hopanes distribution with αβ stereochemistry found
in the Santo Antônio Lagoon samples were evidence that hydrocarbon inputs from petrogenic sources predominate over natural sources. In the other samples studied, the AH distribution
(from 38 to 2,749 µg g-1 OC), and detection of hopenes and hopanes-ββ suggest mixed sources
of hydrocarbons. Nevertheless, PAH concentrations in all samples (from 7,731 to 786,469 ng g-1
OC, whereof alkyl naphthalenes accounted for > 92% of the total) indicated critical petrogenic contamination. Fishing and urban activities are potential sources to the petrogenic hydrocarbons detected in these sediment samples.
Keywords: hydrocarbons, hopanes, PAH, sediment, chromatography
Introduction
Estuaries are important areas of world’s coastal zones. In general, they are highly productive and provide spawning and nursery grounds for migratory species, besides playing a signiicant role in the global carbon cycle.1,2 Furthermore, an overwhelming majority of the
human populations is concentrated along or near coasts, which inevitably leads to complex problems concerning environmental quality due to the residues generated by miscellaneous human activities.
Along with various other organic and inorganic contaminants, the study of sedimentary aliphatic hydrocarbons (AH) (e.g., n-alkanes and hopanes)
provides an important tool to assess organic matter sources and pollution levels in aquatic ecosystems.3-5
This class of organic compounds has biogenic and anthropogenic sources. Natural inputs are comprised mostly of vascular plants, algae, microorganisms and early diagenesis of natural products, whereas petroleum and its derivatives are generally examples of human-related sources.5,6 In the case of hopanes, they appear in
or crude oil and its products).7 Moreover, due to their
chemical stability and easy detectability by GC-MS, these biomarkers have been extensively used as powerful tool in petroleum and correlated studies.7-9 Polycyclic
aromatic hydrocarbons (PAH) are also widely used in environmental research due to their persistence, ability to bioaccumulate and high toxicity (e.g., mutagenic and
carcinogenic effects) to any organism.10,11 Consequently,
they have been included in the US EPA and the EU priority pollutants list.
AH and PAH enter estuarine waters via several pathways, notably from urban runoff (e.g., industrial
and municipal wastes, and sewage sludge), atmospheric deposition (e.g., combustion of petroleum-related products,
charcoal and wood), nonpoint source runoff from land and/ or autochthonous sources.11 Because of their hydrophobicity
and low susceptibility to microbial degradation, they are readily adsorbed onto particulate matter and then buried in the bottom sediments.5,6 Thus, the process of distinguishing
their origin in sediment is not always straightforward and requires the use of several chemical tools,8 which belong
to the ield of organic geochemistry.
The Laguna Estuarine System is one of the largest estuarine formations along the Brazilian south and southeast coasts, and is internationally known because of a communal property system where ishermen and dolphins (Tursiops truncates) participate in cooperative ishing,
preying on the same species, that is, mullet (Mugil spp.).12
Because of the highly productive aquatic ecosystem, the town of Laguna is an important and traditional ishing port in Santa Catarina State, where some 8,000 artisanal ishermen make their living.13 Unfortunately, the coastal
environment is also famous for the constant conlicts caused by human activities in the surrounding area. Small factories, rice culture, pig farming, urban sewage, shipping transport, and coal extraction and processing are some examples of the local pollutant sources.14
In this paper, we present the irst survey of AH and PAH in surface sediments of the Laguna Estuarine System. Since the few studies carried out at this site are focused on ecological and biological aspects,13,15-18 this study aims
to assess the AH and PAH sources and concentrations, to serve as a baseline for future monitoring programs and to improve the environmental sustainability. To achieve this goal, the separation, identiication and quantiication of
n-alkanes, isoprenoid hydrocarbons, pentacyclic triterpanes
and PAH were carried out. Additionally, several organic geochemical indices reported in the specialized literature were calculated in the attempt to distinguish between the diverse aliphatic and polycyclic aromatic hydrocarbons inputs and evaluate the pollution level.
Experimental
Study area and sampling
The Laguna Estuarine System, located on the southern coast of Brazil (Santa Catarina State) at ca. 28˚25’ S
and 48˚50’ W, is composed of several lagoons with a total surface area of 220 km2 (Figure S1, Supplementary
Information, SI)). The three main water bodies, with mean depth of 2 m (Santo Antonio, 33.85 km2; Imaruí, 86.32 km2;
and Mirim, 63.77 km2), are connected one to another and to
the adjacent ocean by a single narrow channel representing a choked lagoon,2 where Santo Antônio Lagoon receives
the main freshwater stream discharge from the Tubarão River (annual mean discharge of 50 m3 s-1).14 It has been
reported that the surface water salinity (ranging from 1 to 15‰) is lower than that of the bottom water (ranging from 2 to 20‰)).16 In association with the frequent winds over the
shallow aquatic system (81% from SW and S with annual mean velocity of 12 km h-1),19 this factor plays a signiicant
role in the input, transport, sedimentation and recycling of organic compounds.
Nine sampling sites were selected along the west side of the Laguna Estuarine System in January 2007 (Figure S1, SI). These locations were chosen because the input of coarse sediments from the near-shore coast is less expressive than on the east side. A total of thirteen surface sediment samples (0-5 cm depth) were collected as follows: Mirim Lagoon (station Mir1) - two samples (MirV: close to the margin vegetation and MirNV: 4 m from vegetation); Imaruí Lagoon (station IM1) - two samples in duplicate (IM1 and IM2); Santo Antônio Lagoon (stations SA1, SA2, SA3, SA4) - one sample per station; Channel site (station
C1 - water course that connects Santa Marta Lagoon with the Tubarão River) - two samples in duplicate (C1 and C2); Santa Marta Lagoon (stations SM1 and SM2) - two samples in duplicate at SM1 (SM1A and SM1B) and one sample at SM2. All sediment samples were stored in glass jars (previously cleaned with 5% Extran solution, deionized water, kept at 450 ˚C for 4 h and rinsed with solvent), sealed with heat-treated aluminum foil-lined lids and kept frozen until being freeze-dried in the laboratory.
Analytical procedures
Prior to the laboratory work, all sediment samples were freeze-dried, pulverized with a mortar and sieved with a stainless steel sieve of 120 mesh size (< 0.125 mm fraction). Homogenized subsamples from each sample were acidiied with 0.1 mol L-1 HCl solution to remove carbonates, rinsed
analysis (total organic carbon, total nitrogen and total sulfur) using a Carlo Erba EA1110 CHNS-O analyzer. Grain size analysis (clay, silt and ine sand fractions) was conducted following the procedure described by Suguio.20
In order to study the sources and distribution of AH and PAH in the Estuarine System, 10 g of sediment were used. Two sets of surrogates were added to quantify the overall recovery of the aliphatic and aromatic fractions. The surrogates were deuterated hydrocarbons n-C20 (n-eicosane)
and n-C30 (n-triacontane) for the aliphatic hydrocarbon
fraction (recovery of over 80%) and p-terphenyl-d14 for the
aromatic fraction (recovery of over 70%).
Since molecular sulfur can interfere with GC-MS analysis, 2 g of active metallic copper was added to all samples to adsorb the sulfur during the extraction. The extractable lipids were obtained applying three successive extractions by ultra-sound. In the irst step, 20 mL of dichloromethane:methanol (2:1) were used and then dichloromethane only. The extracts were combined and completely rotary evaporated. Lipids were dissolved in 3 mL of hexane and loaded into a glass column (30 cm length × 1.3 cm i.d.) previously illed with activated silica (10 g), alumina (1 g) and metallic copper (2 g) (adapted from EPA3540C). The lipid extract was fractionated into two fractions: fraction 1 containing aliphatic hydrocarbons (F1) eluted with 55 mL of hexane, and fraction 2 with polycyclic aromatic hydrocarbons (F2) eluted with 70 mL of hexane:dichloromethane (1:1). Each fraction was rotary evaporated under nitrogen lux, concentrated to 1 mL and kept at −18 ˚C until analysis. Prior to the gas chromatography analysis, a known amount of deuterated
n-C12 (n-dodecane) (2 µg mL-1) was added to F1 and a PAH
deuterated solution mixture of naphthalene, acenaphthene, phenanthrene, chrysene and perylene (100 ng mL-1) was
added to F2 as internal standards. Individual AH were quantiied by internal calibration and corrected using the response factor. External calibration was used to quantify the PAH. Hopanoids were analyzed qualitatively by comparison between samples.
The aliphatic hydrocarbon fraction was analyzed using a GC (ThermoFinigan model Trace Ultra) with injector split/splitless and lame ionization detector (FID). Injector and detector temperatures were kept at 280 and 300 °C, respectively. A Restek RTX-5 MS capillary column with 30 m × 0.25 mm i.d. × 0.25 µm ilm thickness was used. The temperature was programmed as follows: 60 °C (hold for 1.5 min) ramping at 6 °C min-1 to 300 °C (hold for 30 min).
Splitless mode injection (1 min) was performed using 1 µL of sample extract. The carrier gas was helium at 1.5 mL min-1.
GC-MS analysis was carried out on a ThermoFiningan Polaris Q (ion trap as mass analyzer) interfaced to a
ThermoFiningan GC model Trace Ultra, which enabled identification of hopanoids in F1, and quantification of PAH in F2. GC conditions were as for GC/FID except that injector temperature was 250 °C and carrier gas low was 1.0 mL min-1. The MS Polaris Q was operated
in full scan mode (90-500 for F1 and 50-500 Dalton for F2) and mass spectra were obtained by electron impact at 30 eV with ion source at 175 °C for F1, with values of 70 eV and 250 °C, respectively, for F2. In both cases the emission current was 250 µA and the transfer line was kept at 250 °C. Mass spectrometer parameters for F1 were optimized in order to promote less molecule fragmentation to give better relative signal for the molecular ion.8 For
example, in the mass spectra (Figure 1) obtained with the optimal mass spectrometer parameters, the molecular ion
Figure 1. Example of mass chromatograms for pentacyclic triterpanes and
(m/z 410) and [M-15]+ (m/z 395) peaks exhibited excellent
response. When the regular mass spectrometer parameters were employed (i.e., those used for F2 and widely reported
in studies using the quadrupole mass analyzer), these peaks are barely seen. Xcalibur v.1.4 SR1 software was used for data acquisition and analysis.
The n-alkanes, isoprenoid hydrocarbons and PAH
were identified by matching the retention times and fragmentation proiles against corresponding standards and those in the NIST/EPA/NIH Mass Spectra Library version 2.0d. Pentacyclic triterpanes were identified by comparison of the mass spectra obtained with those reported in the specialized literature and by analysis of a crude oil sample.7,9
Results and Discussion
Grain size and elemental analysis
Surface sediment samples along the Laguna Estuarine System are comprised mostly of silt, except for stations SA3 and SM1A, where sand is the dominant sedimentary component (Table 1). Fine particles (silt and clay) have been reported to show good correlation with organic matter concentration.21 In this study, considering all samples
(except SA3), total organic carbon showed no signiicant correlation with ine particles (r = 0.483, p = 0.112). However, the correlation between percentages of TOC and silt (excluding clay) was signiicant (r = 0.705, p = 0.011). These observations indicate that the TOC originates from nonpoint sources and winds may play an important role in
the organic matter cycle. Whitmore et al.22 reported that
shallow, wind-stressed lakes in Florida showed highly uneven organic sediment distribution. Since the sediment samples of this study are from coastal lagoons where strong winds are frequent and human activity signiicant, the inputs of organic and inorganic matter are not constant. Additionally, wind waves can winnow ine particles from shoals thus modifying the texture, while tidal mechanisms have selective effects on the particle composition and size distribution.2 Regarding grain particle size and TOC values,
these were consistent with results previously reported for the same area.15 Table 1 shows the ratio in dry weight (dw)
between TOC (total organic carbon), TN (total nitrogen) and TS (total sulfur). The TOC/TS ratio suggests that stations at Imaruí and Mirim lagoons have anoxic characteristics, considering that values lower than 3 are characteristic of anoxic environments.23 The low water circulation observed
at these sites,16 combined with small grains (only 0.2-2.4%
sand) which do not contribute to sediment bioturbation by benthic fauna, could explain the tendency toward a reducing environment in the sediment. The TOC/TN ratio is used to estimate terrigenous and aquatic inputs of organic matter in aquatic environments.24 The TOC/TN values (4-14)
indicated mixed input of allochthonous and autochthonous organic matter.
Aliphatic hydrocarbons and n-alkanes
To assess the extent of pollution within the aquatic system, we analyzed chromatogram proiles and calculated several ratios between individual hydrocarbons. In addition
Table 1. Sediment characteristics, total organic carbon (TOC), total nitrogen (TN), total sulfur (TS) (percentage by dry weight) in surface sediment samples of the Laguna Estuarine System
Station Sand / (%) Silt / (%) Clay / (%) TOC / (%)a TN / (%)a TS / (%)a TOC/TN TOC/TS
SM2 5.0 93.8 1.2 3.74 0.49 1.41 8 3
SM1A 61.5 38.0 0.3 0.46 0.13 0.14 4 3
SM1B 18.7 80.1 1.1 3.11 0.43 1.09 7 3
C1 8.6 89.4 2.0 3.18 0.36 0.53 9 6
C2 10.6 87.7 1.7 3.14 0.35 0.49 9 6
SA1 9.4 89.1 1.5 2.66 0.22 < LOQ 12
-SA2 44.1 55.5 0.4 0.65 0.12 < LOQ 5
-SA3 99.9 0.1 0.0 3.39 0.24 < LOQ 14
-SA4 33.7 65.6 0.8 0.46 0.12 0.11 4 4
IM1 0.7 96.9 2.4 1.88 0.29 1.67 6 1
IM2 0.2 97.8 1.9 1.63 0.24 1.64 7 1
MirNV 1.2 93.2 5.7 2.28 0.57 1.63 4 2
MirV 2.4 90.7 6.9 3.94 0.74 1.61 5 1
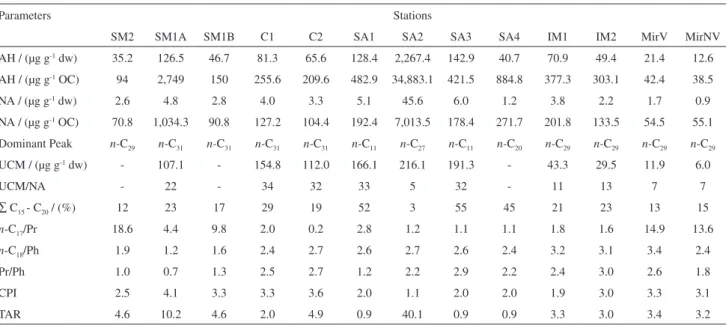
to obtaining the absolute concentration values, all results (expect for pentacyclic triterpanes) were normalized to TOC.
The aliphatic hydrocarbon (AH - total resolved compounds) and n-alkane (NA - total resolved n-alkanes)
compositions of sediment samples have been used successfully as recorders of the origins of organic matter in coastal environments.25-29 Concentrations and indices
regarding AH and NA in our samples are summarized in Table 2. The AH concentrations varied from 12.6 to 2,267.4 µg g-1 of sediment dry weight (dw) and from
38.5 to 34,883.1 µg g-1of organic carbon weight (OC),
whereas NA concentrations ranged from 0.9 to 45.6 µg g-1
dw and from 55.1 to 7,013.5 µg g-1 OC. These values are
comparable to unpolluted (< 100 µg g-1 dw)4 and polluted
coastal environments around the world.30-32 Organic carbon
normalization revealed that hydrocarbon concentrations in these samples may be underestimated when expressed as dry weight, notably in SM1A (NA concentration of 4.8 µg g-1 dw
and 1,034.3 µg g-1 OC). The Santo Antônio Lagoon samples
(SA1-4) showed the highest values for both AH and NA. Short chain n-alkanes were signiicant constituents of
the total NA, ranging from 3 to 55% at the Santo Antônio stations and from 13 to 29% at the other sites. Except for SA samples, long chain odd n-alkanes (n-C > 21)
were predominant with odd-to-even carbon number predominance and the most dominant compound was
n-C29 or n-C31 (Figure 2). The NA distribution suggests that
terrigenous matter and aquatic organisms are important sources of the sediments in the Laguna Estuarine System.5,33
This observation is supported by the above mentioned TOC/TN ratio and terrigenous/aquatic ratio (TAR - indicator of relative terrigenous versus aquatic organic matter
input) with values ranging from 0.9 to 40.1. In contrast, samples from locations SA1-4 have proiles characteristic of petroleum derivative products with even or unimodal distribution from n-C14 to n-C34 showing similarities to
diesel fuel chromatograms (Figure 2).34 Another n-alkane
ratio widely used in environmental studies is the Carbon Preference Index (CPI).35-37 A CPI value close to 1 suggests Figure 2. Chromatograms of aliphatic hydrocarbons in representative surface sediment samples of the Laguna Estuarine System. Notation: total carbon atoms in n-alkane chain.
Table 2. Concentrations and indices of hydrocarbons in surface sediment samples of the Laguna Estuarine System
Parameters Stations
SM2 SM1A SM1B C1 C2 SA1 SA2 SA3 SA4 IM1 IM2 MirV MirNV
AH / (µg g-1 dw) 35.2 126.5 46.7 81.3 65.6 128.4 2,267.4 142.9 40.7 70.9 49.4 21.4 12.6 AH / (µg g-1 OC) 94 2,749 150 255.6 209.6 482.9 34,883.1 421.5 884.8 377.3 303.1 42.4 38.5
NA / (µg g-1 dw) 2.6 4.8 2.8 4.0 3.3 5.1 45.6 6.0 1.2 3.8 2.2 1.7 0.9
NA / (µg g-1 OC) 70.8 1,034.3 90.8 127.2 104.4 192.4 7,013.5 178.4 271.7 201.8 133.5 54.5 55.1 Dominant Peak n-C29 n-C31 n-C31 n-C31 n-C31 n-C11 n-C27 n-C11 n-C20 n-C29 n-C29 n-C29 n-C29
UCM / (µg g-1 dw) - 107.1 - 154.8 112.0 166.1 216.1 191.3 - 43.3 29.5 11.9 6.0
UCM/NA - 22 - 34 32 33 5 32 - 11 13 7 7
∑ C15 - C20 / (%) 12 23 17 29 19 52 3 55 45 21 23 13 15
n-C17/Pr 18.6 4.4 9.8 2.0 0.2 2.8 1.2 1.1 1.1 1.8 1.6 14.9 13.6
n-C18/Ph 1.9 1.2 1.6 2.4 2.7 2.6 2.7 2.6 2.4 3.2 3.1 3.4 2.4
Pr/Ph 1.0 0.7 1.3 2.5 2.7 1.2 2.2 2.9 2.2 2.4 3.0 2.6 1.8
CPI 2.5 4.1 3.3 3.3 3.6 2.0 1.1 2.0 2.0 1.9 3.0 3.3 3.1
TAR 4.6 10.2 4.6 2.0 4.9 0.9 40.1 0.9 0.9 3.3 3.0 3.4 3.2
the presence of petrogenic hydrocarbons and a CPI value greater than 3 suggests the presence of terrestrial plants.31,38
The CPI values for the sediments of this study ranged from 1.1 to 4.1 (Table 2). In addition to these results for stations SA1-4, where the lowest CPI values were found, petroleum-derived products appear as the main source of hydrocarbons. For the other samples, the CPI values suggested the inluence terrigenous hydrocarbons in the sediment composition. In fact, the CPI values did not show predominance from one source, but rather indicated both anthropogenic and natural sources.
Sediment samples contaminated by petroleum products (weathered compounds or even fresh oil inputs) are known to exhibit the characteristic unresolved complex mixture (UCM) in the chromatograms of aliphatic hydrocarbons,8,39
although smaller contributions may be related to bacterial reworking of sedimentary organic matter.4 UCM was
found in most of the samples with values ranging from 6.0 to 216.1 µg g-1dw, which accounted for 10-85% of
the AH content. Nonetheless, for samples C1, C2, SA1 and SA3 the UCM concentration was higher than that of the AH. The ratio of absolute UCM to absolute NA has been used to indentify sedimentary anthropogenic hydrocarbons and values greater than 4 usually indicate petrogenic contamination.40 Nearly all samples exhibited
UCM/NA > 11, indicating input and/or biodegradation of fossil fuels. A recent input of fossil fuel is unquestionable in SA2, due to the value for UCM/NA, high UCM concentration and to the chromatogram proile (Figure 2). On the other hand, the UCM/NA value for samples from the Mirim Lagoon might express biodegradation of natural compounds given the low UCM concentration (6.0 and 11.9 µg g-1dw) associated with low values of AH and NA.
In order to gain a better understanding of the identification of petroleum-related products, ratios between isoprenoid hydrocarbons, n-C17 (n-heptadecane)
and n-C18 (n-octadecane) were also calculated. Pristane
(2,6,10,14-tetramethylpentadecane) and phytane (2,6,10,14-tetramethylhexadecane) were detected in all samples. The origin of these branched alkanes in geological samples can be petroleum products as well as aquatic biota (e.g. algae and zooplankton). A high pristane (Pr)
to phytane (Ph) ratio (Pr/Ph), or the predominance of a single isoprenoid (pristane), is indicative of a biogenic source41 and most crude oils have Pr/Ph values that fall
within a narrow range (0.8-3).9 The Pr/Ph values ranged
from 0.7 to 3.0 suggesting the inluence of fossil fuels in all samples. The n-C17/Pr and n-C18/Ph ratios have been used
in the attempt to verify weathered residues or fresh fossil fuel input to sediment samples.30,42 Since microorganisms
generally utilize n-alkanes before isoprenoids, low values
for these ratios (< 1) are associated with biodegraded oil, while recent inputs may yield values greater than 1. As summarized in Table 2, the n-C18/Ph ratio ranged from 1.2 to
3.4 and the n-C17/Pr ratio varied from 0.2 to 18.6, suggesting
microbial degradation of anthropogenic hydrocarbons in samples SA1-4, IM1-2, C1-2 and SM1A. It is interesting to note that high values (from 9.8 to 18.6) were found for the other samples. As discussed previously, in these samples (SM1B, SM2, MirV and MirNV), non-anthropogenic sources of hydrocarbons are predominant, thus the n-C17/Pr
value may typify primary productivity.
Pentacyclic triterpanes
Hopanoids have been used in organic geochemical research to obtain information on recent and ancient geological environments related to organic matter maturity and oil-source rock correlations in oil exploration.9,43-45 These
compounds originate mainly from bacterial membrane lipids (biohopanoids, e.g., bacteriohopanetetrol) and once
the bacteria are buried in sediments, diagenetic processes readily modify their structure leading to the formation of geohopanoids, including pentacyclic triterpanes (mostly hopenes and hopanes) and other compounds with different functional groups.7,9,46 Recently buried hopanes found
in modern sediments (with no or a very low degree of maturation) generally have 17β(H),21β(H) stereochemistry and occur only in the R coniguration at the C22 position in extended-molecules, whereas ancient buried hopanes (higher degree of maturation, e.g., found in petroleum)
are indentiied by the 17α(H),21β(H) coniguration (more thermodynamically stable) associated with the R and S epimers at the C22 position, which do not occur in living
organisms.7,9,47 Environmental researchers have taken
advantage of these very speciic stereochemical changes using the hopanes series (27 to 35 carbon atoms) with the 17α(H),21β(H) coniguration and epimers (R and S) as additional evidence of petrogenic pollution in the aquatic ecosystems.
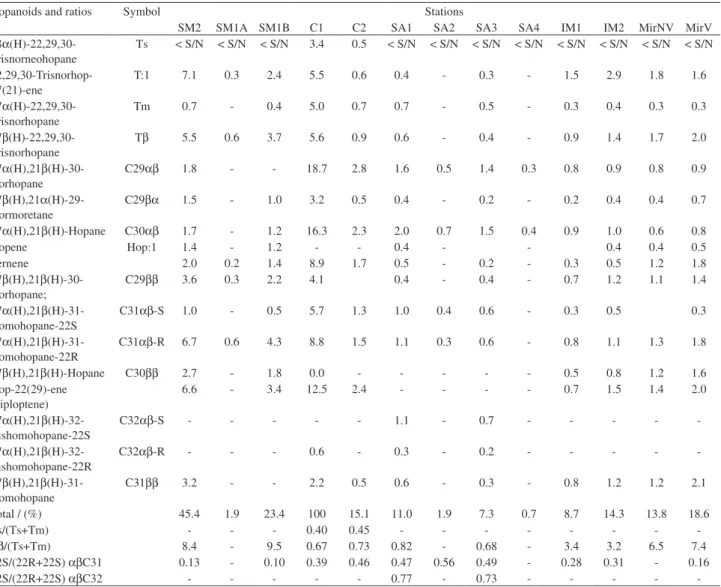
We found the hopane series C27-C32 (except C28) in all samples. Hopenes were also detected. Their relative distribution in the lagoons were normalized by the total relative amount found in sample C1 (sample with the highest percentage of hopanes), as summarized in Table 3. The representative mass chromatograms (m/z 191 and m/z 243)
and basic chemical structures are given in Figure 1. Fernene was detected (by monitoring m/z 243) in most samples
were collected). To the best our knowledge, there have been no reports indicating the marshes or petroleum as a possible source of fernene. Hence, this biomarker is more likely derived from microbiotic precursors.48 Diploptene
(present in various types of bacteria)49 and its possible
diagenetic products (other hopenes) were detected in all samples (monitoring m/z 191 and 189) following the same
trend as that observed for fernene, and thus supporting the hypothesis of a biogenic source for this compound. The hopane skeleton with the coniguration 17β(H),21β(H) was dominant in samples from the Santa Marta, Imaruí and Mirim Lagoons. On the other hand, 17α(H),21β (H)-30-norhopane and 17α(H),21β(H)-hopane were dominant in the sediment samples C1 and C2 and SA1, 2, 3, and 4. Besides the use of the identiication of the hopane series with specific stereochemistry and epimers to verify petroleum residues, several ratios have been applied to
estimate the degree of maturity of sedimentary organic matter. The ratios of 18α(H)-22,29,30-trisnorneohopane (Ts) to 17α(H)-22,29,30-trisnorhopane (Tm) (Ts/Ts+Tm) and of the S to R epimers of 17α(H),21β(H)-homohopane and 17α(H),21β(H)-bishomohopane (22S/22S+22R) have been used to assess changes during the maturation of the sedimentary organic matter. Tm and the biological epimer 22R (both thermodynamically less stable than Ts and the geological epimer 22S, respectively) are affected by sediment maturity and the ratio values increases from 0 to
ca. 0.6 during maturation.7,9 The results of these ratios are
given in Table 3.
The relative percentages of the recent pentacyclic triterpanes (mainly indicative of biogenic sources: hopenes, hopanes-ββ, and C31αβ-R) and ancient pentacyclic triterpanes (mainly indicative of petrogenic sources: hopanes- αβ, including the epimer C31αβ-S), are shown
Table 3. Relative distribution of pentacyclic triperpanes and triterpenes in surface sediments and selected individual compound ratios
Hopanoids and ratios Symbol Stations
SM2 SM1A SM1B C1 C2 SA1 SA2 SA3 SA4 IM1 IM2 MirNV MirV
18α (H)-22,29,30-Trisnorneohopane
Ts < S/N < S/N < S/N 3.4 0.5 < S/N < S/N < S/N < S/N < S/N < S/N < S/N < S/N
22,29,30-Trisnorhop-17(21)-ene
T:1 7.1 0.3 2.4 5.5 0.6 0.4 - 0.3 - 1.5 2.9 1.8 1.6
17α (H)-22,29,30-Trisnorhopane
Tm 0.7 - 0.4 5.0 0.7 0.7 - 0.5 - 0.3 0.4 0.3 0.3
17β (H)-22,29,30-Trisnorhopane
Tβ 5.5 0.6 3.7 5.6 0.9 0.6 - 0.4 - 0.9 1.4 1.7 2.0
17α(H),21β (H)-30-Norhopane
C29αβ 1.8 - - 18.7 2.8 1.6 0.5 1.4 0.3 0.8 0.9 0.8 0.9
17β(H),21α (H)-29-Normoretane
C29βα 1.5 - 1.0 3.2 0.5 0.4 - 0.2 - 0.2 0.4 0.4 0.7
17α(H),21β(H)-Hopane C30αβ 1.7 - 1.2 16.3 2.3 2.0 0.7 1.5 0.4 0.9 1.0 0.6 0.8
Hopene Hop:1 1.4 - 1.2 - - 0.4 - - 0.4 0.4 0.5
Fernene 2.0 0.2 1.4 8.9 1.7 0.5 - 0.2 - 0.3 0.5 1.2 1.8
17β(H),21β (H)-30-Norhopane;
C29ββ 3.6 0.3 2.2 4.1 0.4 - 0.4 - 0.7 1.2 1.1 1.4
17α(H),21β (H)-31-Homohopane-22S
C31αβ-S 1.0 - 0.5 5.7 1.3 1.0 0.4 0.6 - 0.3 0.5 0.3
17α(H),21β (H)-31-Homohopane-22R
C31αβ-R 6.7 0.6 4.3 8.8 1.5 1.1 0.3 0.6 - 0.8 1.1 1.3 1.8
17β(H),21β(H)-Hopane C30ββ 2.7 - 1.8 0.0 - - - 0.5 0.8 1.2 1.6
Hop-22(29)-ene (diploptene)
6.6 - 3.4 12.5 2.4 - - - - 0.7 1.5 1.4 2.0
17α(H),21β (H)-32-Bishomohopane-22S
C32αβ-S - - - 1.1 - 0.7 - - - -
-17α(H),21β (H)-32-Bishomohopane-22R
C32αβ-R - - - 0.6 - 0.3 - 0.2 - - - -
-17β(H),21β (H)-31-Homohopane
C31ββ 3.2 - - 2.2 0.5 0.6 - 0.3 - 0.8 1.2 1.2 2.1
Total / (%) 45.4 1.9 23.4 100 15.1 11.0 1.9 7.3 0.7 8.7 14.3 13.8 18.6
Ts/(Ts+Tm) - - - 0.40 0.45 - - -
-Tβ/(Ts+Tm) 8.4 - 9.5 0.67 0.73 0.82 - 0.68 - 3.4 3.2 6.5 7.4
22S/(22R+22S) αβC31 0.13 - 0.10 0.39 0.46 0.47 0.56 0.49 - 0.28 0.31 - 0.16
22S/(22R+22S) αβC32 - - - 0.77 - 0.73 - - - -
in Figure 3 (we excluded C32αβ and epimers because of their low frequency). Biomarkers characteristic of biogenic precursors ranged from 84% to 100% in the Santa Marta and Mirim Lagoons. Considering the low levels of AH, NA and UCM (excepted for SM1A) associated with low 22S/(22R+22S) ratios for C31αβ (from 0.105 to 0.155), the contribution of petrogenic sources to the sedimentary organic matter is small compared to highly contaminated samples (e.g., SA1-4). A 17α(H),21β(H) and 22S/ (22R+22S) ratio for C31αβ (0.277 and 0.307) was observed in the samples IM1 and IM2. Petrogenic-related hopanes ranged from 51 to 100% in the Santo Antonio Lagoon. The 22S/(22R+22S) ratio values for C31αβ (from 0.277
to 0.467) and C32αβ (0.766 and 0.733) are indicative of petrogenic input.9,50 Diesel and gasoline are excluded as
possible sources since they belong to the low boiling point fraction of crude oil, which does not contain hopanes.51,52
Other petroleum-related products, such as lubricating oils and marine diesel may be potential sources. The relative distribution of hopanes and hopenes in samples C1 and C2, associated with the 22S/(22R+22S) ratio for C31αβ
(0.393 and 0.465) and Ts/(Ts+Tm) ratio (0.404 and 0.452) indicated mixed sources (biogenic and anthropogenic).
17β(H)-22,29,30-Trisnorhopane (Tβ) was detected in most samples. Tm has been reported to be thermodynamically less stable than Ts during catagenesis and thus the Ts/ (Ts+Tm) ratio is a maturity indicator in oil studies.9 Tβ
shows even lower thermal stability9 and thus we propose
that the Tβ/(Ts+Tm) ratio may be related to a pentacyclic triterpane source. Based on the organic geochemical parameters discussed above, we suggest that in these study values of this ratio of > 6 indicate signiicant biogenic input (bacterial), values < 6 and > 1 indicate mixed sources, and values < 1 indicate predominance of petrogenic sources (Table 3).
Polycyclic aromatic hydrocarbons
In order to gain further insight into anthropogenic inluences on the supericial sediments of the Laguna Estuarine System, polycyclic aromatic hydrocarbons (PAH) analysis was carried out by GC-MS. The biogeochemistry of PAH in ecosystems is well documented, and likewise their source-indicator parameters have been widely used in atmospheric, aquatic and sedimentary studies.3,4,26,52-59
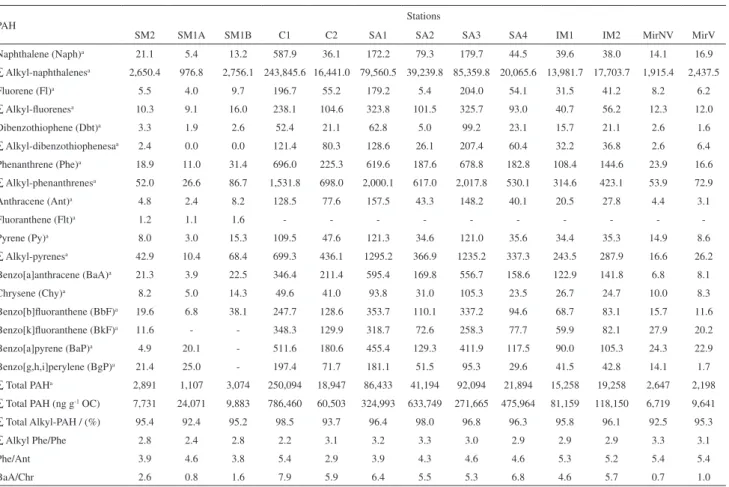
PAH were identified and quantified in all samples (Table 4). The total of 18 individual PAH (including parent and the sum of individual alkylated compounds) ranged from 1,107 to 250,094 ng g-1 dw and from 6,719 to 786,460ng g-1
OC. Again, organic carbon normalization was necessary to verify whether the PAH concentrations were underestimated (e.g., SM1A and IM2) when expressed as dry weight. Our
values are comparable or higher than those previously reported for highly polluted coastal areas worldwide (e.g.,
Guanabara bay, Brazil, up to 9,700 ng g-1 dw; Cienfuegos
bay, Cuba, up to 10,500 ng g-1 dw; Patos Lagoon, Brazil,
up to 11,779 ng g-1 dw; Narragansett Bay, USA, up to
216,000 ng g-1 dw .).3,31,60,61 PAH distribution was dominated
by alkylated compounds, notably alkyl-naphthalenes. The Santo Antônio Lagoon and Channel samples exhibited the highest PAH concentrations, whereas the lowest concentrations were found in the Santa Marta and Mirim Lagoons with the exception of sample SM1 (organic carbon normalization revealed a 22-fold increase, which is much higher than the average (3-fold) for the samples from that location). Alkyl PAH accounted for ≥ 92.4% of total PAH at all sites, which indicates a strong inluence of fossil fuels on the sediments.53 Further data analysis considering
the estuarine and marine sediment quality guidelines speciied by US NOAA (National Oceanic and Atmospheric Administration - United States Department of Commerce)62
demonstrated that the total PAH concentration of the sediment samples from Santa Marta and Mirim Lagoons (averages of 2,357 and 2,423 ng g-1 dw, respectively) are below the effects
range-low (ERL) value of 4,022 ng g-1 dw (a range intended
to estimate conditions in which adverse biological effects would be rarely observed), whereas the Imaruí Lagoon sediments (total average PAH of 17,258 ng g-1 dw) had a
value between the ERL and effects range-median (ERM) (value of 44,792 ng g-1 dw, which represents a
probable-effects range within which adverse biological probable-effects would frequently occur) representing a possible-effects range with adverse biological effects would occasionally occur. In the Santa Marta and Imaruí Lagoons the total alkyl-naphthalenes are above the ERM value of 670 ng g-1 dw for 2-methyl
naphthalene. In contrast, the total PAH concentration at the Santo Antônio Lagoon and Channel stations (average of
134,521 and 60,404 ng g-1 dw, respectively) are far above
of the ERM value.
In an attempt to differentiate petrogenic from pyrogenic PAH, the concentration ratios of selected PAH were calculated as follows: phenanthrene/anthracene (Phe/Ant), sum of alkyl phenanthrenes/phenanthrene (∑alkyl-Phe/Phe) and benzo[a]anthracene/chrysene (BaA/Chy). Characteristic values of these ratios indicate: (i) petrogenic sources: > 15, > 2
and ≤ 0.4, respectively; and (ii) pyrolytic sources: < 10, < 2
and > 0.9, respectively.4 The results for all samples (Table 4)
were: Phe/Ant < 10, ∑alkyl-Phe/Phe > 2 and BaA/Chy > 0.7 suggesting mixed PAH origins in the sediments of the Laguna Estuarine System, where liquid fossil fuels (direct inputs) and combustion (atmospheric deposition) of hydrocarbon-based fuels (e.g., gasoline, diesel, oil, wood and coal) are potential
sources.4,53 According to this information, petroleum-related
products have widespread presence in the sediments of the estuary, differing only in terms of concentration.
Conclusions
The uneven surface distribution of sand, silt and clay along the shallow Laguna Estuarine System and the lack
of a linear relationship between clay and TOC indicate that winds, natural water sources and human activities play a signiicant role in sediment transport and organic matter geochemical cycling. Also, this investigation showed that even though they are interconnected, the lagoons have signiicantly different sources and concentrations of sedimentary organic compounds. The lowest anthropogenic inluence was veriied at Mirim Lagoon. At this sampling station, the aliphatic hydrocarbon fraction was comprised mostly of natural sources, although the PAH levels and ratios indicated high contamination levels. Elevated levels of hydrocarbons in the other sediment samples and the geochemical markers revealed anthropogenic input of petroleum-related products to the aquatic system, especially the Santo Antonio Lagoon and the Channel. The data obtained also suggest that the Tβ/(Ts+Tm) ratio is a potential tool to estimate hopane sources in recent sediments.
Considering all samples studied, a comparison of the PAH concentrations in the estuarine sediments with quality guidelines speciied by US NOAA revealed serious levels of petrogenic pollution across the entire aquatic system. Further research to assess the adverse effects on the biota
Table 4. Analytical data and selected individual compound ratios for PAH
PAH Stations
SM2 SM1A SM1B C1 C2 SA1 SA2 SA3 SA4 IM1 IM2 MirNV MirV
Naphthalene (Naph)a 21.1 5.4 13.2 587.9 36.1 172.2 79.3 179.7 44.5 39.6 38.0 14.1 16.9
∑ Alkyl-naphthalenesa 2,650.4 976.8 2,756.1 243,845.6 16,441.0 79,560.5 39,239.8 85,359.8 20,065.6 13,981.7 17,703.7 1,915.4 2,437.5
Fluorene (Fl)a 5.5 4.0 9.7 196.7 55.2 179.2 5.4 204.0 54.1 31.5 41.2 8.2 6.2
∑ Alkyl-luorenesa 10.3 9.1 16.0 238.1 104.6 323.8 101.5 325.7 93.0 40.7 56.2 12.3 12.0
Dibenzothiophene (Dbt)a 3.3 1.9 2.6 52.4 21.1 62.8 5.0 99.2 23.1 15.7 21.1 2.6 1.6
∑ Alkyl-dibenzothiophenesaa 2.4 0.0 0.0 121.4 80.3 128.6 26.1 207.4 60.4 32.2 36.8 2.6 6.4 Phenanthrene (Phe)a 18.9 11.0 31.4 696.0 225.3 619.6 187.6 678.8 182.8 108.4 144.6 23.9 16.6 ∑ Alkyl-phenanthrenesa 52.0 26.6 86.7 1,531.8 698.0 2,000.1 617.0 2,017.8 530.1 314.6 423.1 53.9 72.9
Anthracene (Ant)a 4.8 2.4 8.2 128.5 77.6 157.5 43.3 148.2 40.1 20.5 27.8 4.4 3.1
Fluoranthene (Flt)a 1.2 1.1 1.6 - - - - - - - - -
-Pyrene (Py)a 8.0 3.0 15.3 109.5 47.6 121.3 34.6 121.0 35.6 34.4 35.3 14.9 8.6
∑ Alkyl-pyrenesa 42.9 10.4 68.4 699.3 436.1 1295.2 366.9 1235.2 337.3 243.5 287.9 16.6 26.2 Benzo[a]anthracene (BaA)a 21.3 3.9 22.5 346.4 211.4 595.4 169.8 556.7 158.6 122.9 141.8 6.8 8.1
Chrysene (Chy)a 8.2 5.0 14.3 49.6 41.0 93.8 31.0 105.3 23.5 26.7 24.7 10.0 8.3
Benzo[b]luoranthene (BbF)a 19.6 6.8 38.1 247.7 128.6 353.7 110.1 337.2 94.6 68.7 83.1 15.7 11.6 Benzo[k]luoranthene (BkF)a 11.6 - - 348.3 129.9 318.7 72.6 258.3 77.7 59.9 82.1 27.9 20.2 Benzo[a]pyrene (BaP)a 4.9 20.1 - 511.6 180.6 455.4 129.3 411.9 117.5 90.0 105.3 24.3 22.9 Benzo[g,h,i]perylene (BgP)a 21.4 25.0 - 197.4 71.7 181.1 51.5 95.3 29.6 41.5 42.8 14.1 1.7 ∑ Total PAHa 2,891 1,107 3,074 250,094 18,947 86,433 41,194 92,094 21,894 15,258 19,258 2,647 2,198 ∑ Total PAH (ng g-1 OC) 7,731 24,071 9,883 786,460 60,503 324,993 633,749 271,665 475,964 81,159 118,150 6,719 9,641 ∑ Total Alkyl-PAH / (%) 95.4 92.4 95.2 98.5 93.7 96.4 98.0 96.8 96.3 95.8 96.1 92.5 95.3
∑ Alkyl Phe/Phe 2.8 2.4 2.8 2.2 3.1 3.2 3.3 3.0 2.9 2.9 2.9 3.3 3.1
Phe/Ant 3.9 4.6 3.8 5.4 2.9 3.9 4.3 4.6 4.6 5.3 5.2 5.4 5.4
BaA/Chr 2.6 0.8 1.6 7.9 5.9 6.4 5.5 5.3 6.8 4.6 5.7 0.7 1.0
is needed to better understand the signiicance of the pollutants present in these coastal lagoons.
Supplementary Information
Supplementary data are available free of charge at http://jbcs.sbq.org.br, as PDF ile.
Acknowledgments
Thanks are due to the Laboratory of Marine Sciences of UNISUL for helping us to collect all samples. We also thank João Renato Estrelau for helping with GC/FID and GC-MS instrumental issues and Cesar Alexandro da Silva for helping with experimental procedure. Scholarships for R. Tarozo and M. Frena were provided by the CNPq. Financial support was provided by FAPESC (project number 12.500/2007-8) and Petrobras.
References
1. Bouloubassi, I.; Fillaux, J.; Saliot, A.; Mar. Pollut. Bull.2001,
42, 1335.
2. Kjerfve, B., ed.; Coastal Lagoon Processes, Elsevier
Oceanography Series: Amsterdam, 1994.
3. Meniconi, M. D. G.; Gabardo, I. T.; Carneiro, M. E. R.; Barbanti, S. M.; da Silva, G. C.; Massone, C. G.; Environ. Forensics2002,
3, 303.
4. Readman, J. W.; Fillmann, G.; Tolosa, I.; Bartocci, J.; Villeneuve, J. P.; Catinni, C.; Mee, L. D.; Mar. Pollut. Bull.
2002, 44, 48.
5. Volkman, J. K.; Holdsworth, D. G.; Neill, G. P.; Bavor, H. J.;
Sci. Total Environ.1992, 112, 203.
6. Meyers, P. A.; Ishiwatari, R.; Org. Geochem.1993, 20, 867.
7. Philp, R. P.; Methods in Geochemistry and Geophysics 23:
Fossil Fuel Biomarkers - Applications and Spectra, Elsevier:
Amsterdam, 1985.
8. Farias, C. O.; Hamacher, C.; Wagener, A.; Scoield, A. D. L.;
Org. Geochem.2008, 39, 289.
9. Peters, K. E.; Walters, C. C.; Moldowan, J. M.; The Biomarker Guide, 1 - Biomarkers and Isotopes in the Environment and
Human History, 2nd ed., Cambridge: New York, 2005; Peters,
K. E.; Walters, C. C.; Moldowan, J. M.; The Biomarker Guide, 2 - Biomarkers and Isotopes in the Petroleum Exploration and
Earth History, 2nd ed., Cambridge: New York, 2005.
10. Lichtfouse, É.; Budzinski, H.; Garrigues, P.; Eglinton, T. I.;
Org. Geochem.1997, 26, 353.
11. Kennish, M. J.; Ecology of Estuaries: Anthropogenic Effects,
CRC Press: Florida, 1992.
12. Peterson, D.; Hanazaki, N.; Simoes-Lopes, P. C.; Ocean Coast.
Manage.2008, 51, 469.
13. Fonseca, G.; Netto, S. A.; Braz. J. Oceanogr.2006, 54, 41. 14. SDM; Bacias Hidrográicas do Estado de Santa Catarina:
Diagnóstico Geral. Secretaria do Desenvolvimento Urbano e
Meio Ambiente do Estado de Santa Catarina: Florianópolis, Brasil, 1997. (http://www.aguas.sc.gov.br/sirhsc/baixararquivo. jsp?id=116&NomeArquivo=2.pdf).
15. Netto, S. A.; Pereira, T. J.; Aquat. Ecol.2009, 43, 521. 16. Eichler, P. P. B.; Castelão, G. P.; Mendonça, F. P.; Eichler, B. B.;
Pesq. Geoci.2006, 33, 101.
17. Giannini, P. C. F.; Sawakulchi, A. O.; Martinho, C. T.; Tatumi, S. H.; Mar. Geol.2007, 237, 143.
18. Meurer, A. Z.; Netto, S. A.; Braz. J. Aquat. Sci. Technol.2007,
11, 53.
19. SDM; DIMA; GEHID; Plano Integrado de Recursos Hídricos da Bacia Hidrográica do Rio Tubarão e Complexo Lagunar,
1: Atividades Preliminares. Secretaria do Desenvolvimento
Urbano e Meio Ambiente do Estado de Santa Catarina; Diretoria de Recursos Naturais e Gestão Ambiental; Gerência de Gestão de Recursos Hídricos: Florianópolis, Brasil, 2002. (http://www.aguas.sc.gov.br/sirhsc/baixararquivo. jsp?id=116&NomeArquivo=3-2-4.PDF)
20. Suguio, K.; Introdução à Sedimentologia, Edgar
Blücher-EDUSP: São Paulo, Brasil, 1973.
21. Alexandre, M. R.; Huang, Y.; Madureira, L. A. S.; Geochim.
Bras.2006, 20, 208.
22. Whitmore, T. J.; Brenner, M.; Schelske, C. L.; J. Paleolimn.
1996, 15, 207.
23. Berner, R. A.; Raiswell, R.; Geology1984, 12, 365.
24. Meyers, P. A.; Org. Geochem.2003, 34, 261.
25. Colombo, J. C.; Barreda, A.; Bilos, C.; Cappelletti, N.; Demichelis, S.; Lombardi, P.; Migoya, M. C.; Skorupka, C.; Suárez, G.; Environ. Pollut.2005, 134, 277.
26. Bouloubassi, I.; Saliot, A.; Oceanol. Acta1993, 16, 145. 27. Silva, C. A.; Oliveira, C. R.; Oliveira, I. R. W. Z.; Madureira,
L. A. S.; J. Braz. Chem. Soc.2008, 19, 1513.
28. Vanvleet, E. S.; Quinn, J. G.; Environ. Sci. Technol.1977, 11,
1086.
29. Medeiros, P. M.; Bicego, M. C.; Mar. Pollut. Bull.2004, 49,
892.
30. Harji, R. R.; Yvenat, A.; Bhosle, N. B.; Environ. Int.2008, 34,
959.
31. Medeiros, P. M.; Bícego, M. C.; Castelão, R. M.; Del Rosso, C.; Fillmann, G.; Zamboni, A. J.; Environ. Int.2005, 31, 77. 32. Figueiredo, L. H. M.; Wagener, A. L. R.; Dagaut, J.; Saliot, A.;
J. Braz. Chem. Soc.2008, 19, 516.
33. Rieley, G.; Collier, R. J.; Jones, D. M.; Eglinton, G.; Org.
Geochem.1991, 17, 901.
34. Hupp, A. M.; Marshall, L. J.; Campbell, D. I.; Smith, R. W.; McGufin, V. L.; Anal. Chim. Acta2008, 606, 159.
35. Mater, L.; Alexandre, M. R.; Hansel, F. A.; Madureira, L. A.
36. Tuo, J. C.; Wang, X. B.; Chen, J. F.; Simoneit, B. R. T.; Org.
Geochem.2003, 34, 1615.
37. Gomes, A. O.; Azevedo, D. A.; J. Braz. Chem. Soc.2003, 14, 358.
38. Wang, X.-C.; Sun, S.; Ma, H.-Q.; Liu, Y.; Mar. Pollut. Bull.
2006, 52, 129.
39. Shi, H.; Zhang, L.; Yue, L.; Zheng, G.; Bull. Environ. Contam.
Toxicol.2008, 81, 416.
40. Simoneit, B. R. T.; Mazurek, M. A.; Atmos. Environ.1982, 16, 2139.
41. Mille, G.; Asia, L.; Guiliano, M.; Malleret, L.; Doumenq, P.;
Mar. Pollut. Bull.2007, 54, 566.
42. Diez, S.; Jover, E.; Bayona, J. M.; Albaiges, J.; Environ. Sci.
Technol.2007, 41, 3075.
43. Trendel, J. M.; Restle, A.; Connan, J.; Albrecht, P.; J. Chem.
Soc., Chem. Commun.1982, 304.
44. Volkman, J. K.; Org. Geochem.2005, 36, 139.
45. Blumenberg, M.; Seifert, R.; Kasten, S.; Bahlmann, E.; Michaelis, W.; Geochim. Cosmochim. Acta2009, 73, 750. 46. Saito, H.; Suzuki, N.; Org. Geochem.2007, 38, 1715.
47. Damsté, J. S. S.; van Duin, A. C. T.; Hollander, D.; Kohnen, M. E. L.; deLeeuw, J. W.; Geochim. Cosmochim. Acta1995,
59, 5141.
48. Simoneit, B. R. T.; Methods in Geochemistry and Geophysics,
24: Biological Markers in the Sedimentary Record; Johns, R.
B., ed; Elsevier: Amsterdam, 1986.
49. Talbot, H. M.; Watson, D. F.; Pearson, E. J.; Farrimond, P.; Org.
Geochem.2003, 34, 1353.
50. Mackenzie, A. S.; Patience, R. L.; Maxwell, J. R.; Vandenbroucke, M.; Durand, B.; Geochim. Cosmochim. Acta1980, 44, 1709.
51. Simoneit, B. R. T.; Atmos. Environ.1984, 18, 51.
52. Simoneit, B. R. T.; Int. J. Environ. Anal. Chem.1985, 22, 203.
53. Yunker, M. B.; Macdonald, R. W.; Vingarzan, R.; Mitchell, R. H.; Goyette, D.; Sylvestre, S.; Org. Geochem.2002, 33, 489.
54. Liang, F. Y.; Lu, M. M.; Keener, T. C.; Liu, Z. F.; Khang, S. J.;
J. Environ. Monit.2005, 7, 983.
55. Smith, J. N.; Lee, K.; Gobeil, C.; Macdonald, R. W.; Sci. Total
Environ.2009, 407, 4858.
56. Lim, M. C. H.; Ayoko, G. A.; Morawska, L.; Ristovski, Z. D.; Jayaratne, E. R.; Atmos. Environ.2005, 39, 7836.
57. Boitsov, S.; Jensen, H. K. B.; Klungsøyr, J.; Mar. Environ. Res.
2009, 68, 236.
58. Yunker, M. B.; Macdonald, R. W.; Org. Geochem.2003, 34, 1429.
59. Volkman, J. K.; Revill, A. T.; Murray, A. P. In Molecular
Markers in Environmental Geochemistry:Applications of
Biomarkers for Identifying Sources of Natural and Polluted
Hydrocarbons in Aquatic Environments; Eganhouse, R. P., ed.,
American Chemical Society: Washington, 1997.
60. Tolosa, I.; Mesa-Albernas, M.; Alonso-Hernandez, C. M.; Mar.
Pollut. Bull.2009, 58, 1624.
61. Hartmann, P. C.; Quinn, J. G.; Cairns, R. W.; King, J. W.; Mar.
Pollut. Bull.2004, 48, 351.
62. Long, E. R.; Macdonald, D. D.; Smith, S. L.; Calder, F. D.;
Environ. Manage.1995, 19, 81.
Supplementary Information
0103 - 5053 $6.00+0.00
*e-mail: [email protected]
Geochemical Markers as a Tool to Assess Sedimentary Organic Matter Sources
of the Laguna Estuarine System, South Brazil: Aliphatic and Polycyclic Aromatic
Hydrocarbons
Rafael Tarozo,a,b Morgana Frenaa and Luiz Augusto S. Madureira*,a
aDepartamento de Química, Universidade Federal de Santa Catarina,
88040-900 Florianópolis-SC, Brazil
bDepartment of Geological Sciences, Brown University, 02912 Providence-RI, USA