J. Braz. Chem. Soc., Vol. 18, No. 2, 255-258, 2007. Printed in Brazil - ©2007 Sociedade Brasileira de Química 0103 - 5053 $6.00+0.00
Communication
*e-mail: [email protected]
Mesophase Formation Investigation in Pitches by NMR Relaxometry
Antonio Luís dos Santos Lima,*,a,b Angelo C. Pinto,a Rosane A. S. San Gila and Maria Inês B. Tavaresc
a
Instituto de Química, Universidade Federal do Rio de Janeiro, 21941-972, Rio de Janeiro - RJ, Brazil b
Instituto Militar de Engenharia, Praça General Tibúrcio, 80, Urca, 22290-270 Rio de Janeiro - RJ, Brazil c
Instituto de Macromoléculas Profa. Eloísa Mano, Universidade Federal do Rio de Janeiro, CT, Bloco J, Ilha do Fundão, 21941-972 Rio de Janeiro-RJ, Brazil
Piches são utilizados como precursores de diversos materiais avançados de carbono. O objetivo deste trabalho foi combinar as metodologias de extração com solvente com a ressonância magnética nuclear de baixo campo, através da técnica de relaxação, caracterizando piches de petróleo tratados termicamente. O tempo de relaxação T1 apresentou dois domínios: um na região aromática e o outro atribuído a mesofase. Os resultados mostraram que a técnica de relaxometria por RMN de 1H pode ser empregada como uma nova ferramenta para a
caracterização desse tipo de sistema.
Carbonaceous pitches are used as raw materials in advanced carbon products. This work aims at combining solvent extraction methodology with low field nuclear magnetic resonance relaxometry technique in order to characterize heated-treated samples of petroleum pitches. The T1 relaxation times showed two distinct domains: one was referring to the aromatic region and the other one was attributed to mesophase. The results also evidenced that the 1H NMR
relaxometry could be used as a new tool for the characterization of this kind of system.
Keywords: mesophase pitch, nuclear magnetic resonance, low field NMR, relaxometry
Introduction
Carbonaceous pitches are used as raw materials in advanced carbon products.1 The growth of the mesophase
affects the physical properties of the pitch, softening point and viscosity, and also affects the final properties of the resultant carbon products. Several studies were concentrated on the importance of the development of mesophase during the heat treatment of pitches.2-5 The extensive characterization
studies about coal tar and petroleum pitches using liquid and gas chromatography, X-ray diffraction, 13C and 1H NMR,
mass spectrometry, optical and electronic microscopy and solvent-insoluble fractions have been summarized by several review articles and books.2-7Polarized optical microscopy
(POM) and solvent-insoluble fractions are conventional tools for the study and measurement of the amount of mesophase formation.2,6,8 Although POM is a standard identification tool,
extensively used by liquid crystal researchers, Li et al.9 have
concluded that conventional POM observation could not be regarded as a good method to analyze the size and size
distribution of the mesophase spheres in the isotropic matrix of heat-treated pitches, because of their random distribution. Even the statistical assumptions used in some works could not help to obtain the precise size, since the different apparent sizes could be caused by the random positions. In these random positions spheres were cut in the preparation of the samples and also caused by the size distribution of mesophase spheres in the pitches.
Another analytical method frequently used to follow the growth of the mesophase is solvent extraction. The literature reports a wide range of solvents, e.g. heptane, toluene, tetrahydrofuran, pyridine, quinoline and N-methyl pyrrolidinone. However, in different systems, each different extracted material and its extract behave differently. The mesophase spheres in the heat-treated coal tar or petroleum pitches are extracted at a very low yield. Besides, extraction and filtration are very tedious procedures.2,3,5
256 Mesophase Formation Investigation in Pitches by NMR Relaxometry J. Braz. Chem. Soc.
relaxation time data, which is conventionally characterized by relaxation time T1, was used to investigate the presence of domains in the samples studied. Spin-lattice relaxation reports the return of magnetization to its equilibrium populations after a radio frequency pulse.3,10-13
Torregrosa-Rodriguezet al.14and Evdokimov et al.15 have also studied
the formation of asphaltene dispersions in oil/toluene solutions by low field NMR relaxation, with measurement of the spin-spin relaxation times (T2), identifying monomers below 10 mg L-1. In this investigation, low field NMR
relaxometry and insoluble fractions techniques were used to characterize different domains in the samples studied.
Experimental
The pitch precursor (sample A) comes from petroleum cracking residue submitted to heating treatment; it was heated at 430 oCper 4 hours in a N
2 atmosphere, and five
different samples were obtained (samples B-E) as specified in Table 1. Two other pitch samples were obtained from the precursor by density difference with hot stage centrifugation, the upper (isotropic-sample F) and lower (anisotropic-sample G).16
The low-field 1H NMR relaxation measurements were
done on a Resonance Instruments Maran Ultra 23 NMR analyzer, operating at 23.4 MHz (for protons) and equipped with an 18 mm variable temperature probe operating at 300 K. Proton spin-lattice relaxation times (T1H) were measured with the inversion-recovery pulse
sequence (D1- π - τ - π/2 - acq.), using a recycle delay value greater than 5T1 (e.g. D1 of 10 s), and π/2 pulse of 4.5µs calibrated automatically by the instrument software. The amplitude of the FID was sampled for twenty τ data points, ranging from 0.1 to 5000 ms, with 4 scans each point. The T1 values and relative intensities were obtained with the aid of the program WINFIT by fitting the exponential data. Distributed exponential fittings as a plot of relaxation amplitude versus relaxation time were performed by using the software WINDXP.
Results and Discussion
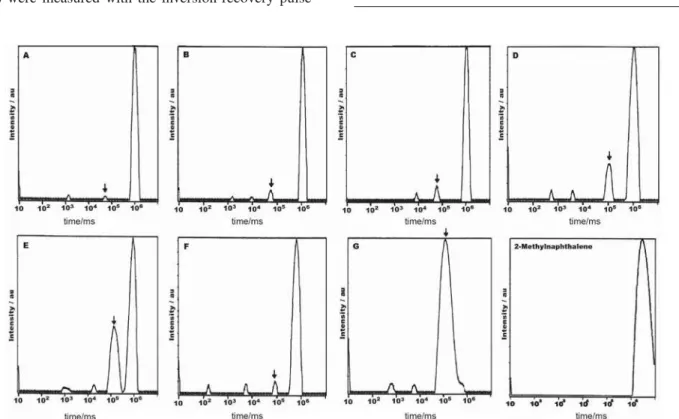
The T1H relaxation time data obtained at 300 K for the samples studied are shown in Table 2. The mesophase formation can be followed across the distributed exponential fittings as a plot of relaxation amplitude versus
relaxation time; this was performed using WINDXP software (Figure 1).
Figure 1. Relaxation amplitude versus spin-lattice relaxation times (D1=10 s, 300 K) of the samples (↓ mesophase domain). Table 1. Characteristics of samples studied
Sample Insoluble Fraction/(%)
Toluene(TI) Quinoline(QI) N-methyl pyrrolidinone(NMPI)
A 8.8 0.1 0.9
B 24.9 3.8 8.7
C 28.0 7.0 13.5
D 37.1 16.2 24.1
257
Limaet al.
Vol. 18, No. 2, 2007
In our studies of T1 relaxation times, two distinct domains were observed: one referring to the aromatic region and the other was attributed to mesophase. Jurkiewicz et al.10 have
used spin-lattice characteristics of coal 1H NMR signals and
have suggested that two phases, one molecular and other macromolecular, could be distinguished in the coal structure. In the present work, T1H longitudinal relaxation time and the insoluble fraction data were correlated to the presence of different domains in the samples studied (Figure 2). In Figure 2, the highest one belongs to the domain
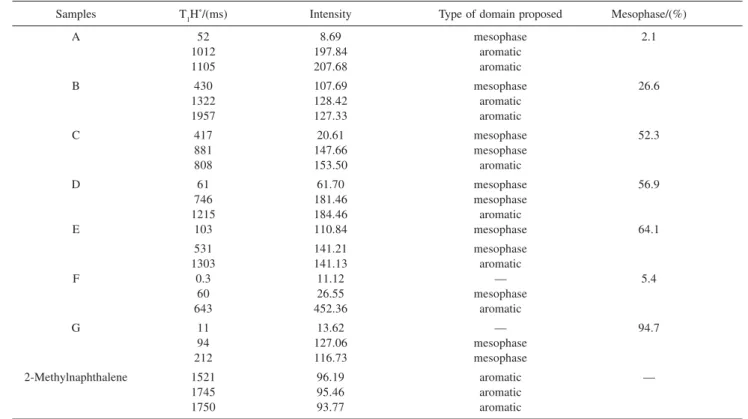
Table 2. Proton spin-lattice relaxation times of the samples determined by low field NMR using WINFIT software
Samples T1H*/(ms) Intensity Type of domain proposed Mesophase/(%)
A 52 8.69 mesophase 2.1
1012 197.84 aromatic
1105 207.68 aromatic
B 430 107.69 mesophase 26.6
1322 128.42 aromatic
1957 127.33 aromatic
C 417 20.61 mesophase 52.3
881 147.66 mesophase
808 153.50 aromatic
D 61 61.70 mesophase 56.9
746 181.46 mesophase
1215 184.46 aromatic
E 103 110.84 mesophase 64.1
531 141.21 mesophase
1303 141.13 aromatic
F 0.3 11.12 — 5.4
60 26.55 mesophase
643 452.36 aromatic
G 11 13.62 — 94.7
94 127.06 mesophase
212 116.73 mesophase
2-Methylnaphthalene 1521 96.19 aromatic —
1745 95.46 aromatic
1750 93.77 aromatic
* These values result from T1 curve adjustment for three exponentials.
controling the relaxation process, which is a rigid one. The results from the insoluble fraction determinations were lower than those obtained with 1H NMR relaxometry10 and
proved that the mesophase formation was understimated, probably due to the scale of the measurement. It was also observed a good correlation between lower insoluble fraction concentration and NMR relaxation data.
Conclusions
The NMR relaxation results showed that the system in investigation presented more than one domain, according to their molecular mobility, as a function of phase interaction and dispersion. These results also supported that NMR relaxometry could be used as a new tool for the characterization of this kind of system.
References
1 Mochida, I.; Yoon, S-H.; Qiao, W.; J. Braz. Chem. Soc.2006,
17, 1059.
2 March, H.; Martínez-Escandell, M.; Rodríguez-Reinoso, F.;
Carbon1999,37, 363.
3 Bunsell, R. A.; Fibre Reinforcements for Composite Materials, Elsevier: Amsterdam, 1988.
4 Fitzer, E.; Carbon Fibre and their Composites, Springer-Verlag: New York, 1983.
Figure 2. T1H longitudinal relaxation time data and insoluble fraction of the samples
0 10 20 30 40 50 60
0 10 20 30 40 50 60 70
Mesophase - NMR / %
In
soluble
F
ra
ct
ion
/
% TI
QI
258 Mesophase Formation Investigation in Pitches by NMR Relaxometry J. Braz. Chem. Soc.
5 Mochida, I.; Korai, Y.; Ku, C.; Watanabe, F.; Sakai, Y.; Carbon
2000,38, 305.
6 Andrésen, J. M.; Luengo, C. A.; Moinelo, S. R.; Garcia, R.; Snape, C. E.; Energy Fuels 1998,12, 524.
7 Dong, R. Y.; Nuclear Magnetic Resonante of Liquid Crystals, Springer-Verlag: New York, 1997.
8 Moriyama, R.; Kumagai, H.; Hayashi, J-i; Yamguchi, C.; Mandori, J.; Matsui, H.; Chiba, T.; Carbon2000,38, 749. 9 Li, T. Q.; Wang, C. Y.; Zheng, J. M.; Carbon2002,40, 2037. 10 Jurkiewicz, A.; Idziak, S.; Pislewski, N.; Fuel1987,66, 1066. 11 Cutmore, N. G.; Sowerby, B. D.; Lynch, L. J.; Webster, D. S.;
Fuel1986,65, 34.
12 Harmer, J.; Callcott, T.; Maeder, M.; Smith, B. E.; Fuel2001,
80, 417.
13 Fantazzini, P.; Brown, R. J. S.; Concepts Magn. Reson.Part A
2005,27A, 122.
14 Torregrosa-Rodriguez, P.; Martinez-Escandell, M.; Rodriguez-Reinoso, F. ; Marsh, H.; Salazar, C.G.; Palazon, E.R.; Carbon
2000,38, 535.
15 Evdokimov, I.; Eliseev, N.; Akhmetov, B.; Fuel2006,85,1465. 16 Kim, C. J.; Ryu, S. K.; Rhee, B. S.; Carbon1993,31, 833.