Printed in Brazil - ©2006 Sociedade Brasileira de Química 0103 - 5053 $6.00+0.00
A
r
ti
c
le
* e-mail: [email protected]
Multivariate Regression Models for the Simultaneous Quantitative Analysis of Calcium and
Magnesium Carbonates and Magnesium Oxide through Drifts Data
Luciano Marder,a Paulo Tomedi,b Marco F. Ferrão,*,a André Jablonskib and Celso U. Davanzoc
a
Grupo de Quimiometria, Departamento de Química e Física, Universidade de Santa Cruz do Sul, Av. Independência, 2293, 96815-900 Santa Cruz do Sul – RS, Brazil
b
Departamento de Engenharia de Minas, Universidade Federal do Rio Grande do Sul, Av. Osvaldo Aranha, 99, 90035-190 Porto Alegre – RS, Brazil
c
Instituto de Química, Universidade Estadual de Campinas, Cidade Universitária Zeferino Vaz, s/n, 13083-970 Campinas – SP, Brazil
Neste trabalho são apresentados modelos de regressão multivariada, empregando espectros por reflexão difusa no infravermelho com transformada de Fourier (DRIFTS), para análise quantitativa do sistema ternário formado pelos carbonatos de cálcio e magnésio e pelo óxido de magnésio. Através de um diagrama ternário, foram definidas as misturas para aquisição dos espectros por reflexão no infravermelho médio. Empregando-se a regressão por mínimos quadrados parciais (PLS), foram construídos modelos com os dados espectrais centrados na média e/ou escalados pela variância, utilizando o conjunto de espectros de calibração. Para selecionar os melhores modelos, foram comparados os valores de RMSEP (root mean square error of prediction). Os resultados comprovam que bons modelos de calibração multivariada para a determinação de carbonatos de cálcio e magnésio e de óxido de cálcio podem ser obtidos a partir dos espectros por reflexão no infravermelho. Estas determinações são particularmente úteis no estudo da decomposição térmica de rochas dolomíticas.
In the present work multivariate regression models were developed for the quantitative analysis of ternary systems using Diffuse Reflectance Infrared Fourier Transform Spectroscopy (DRIFTS) to determine the concentration in weight of calcium carbonate, magnesium carbonate and magnesium oxide. Nineteen spectra of standard samples previously defined in ternary diagram by mixture design were prepared and mid-infrared diffuse reflectance spectra were recorded. The partial least squares (PLS) regression method was applied to the model. The spectra set was preprocessed by either mean-centered and variance-scaled (model 2) or mean-centered only (model 1). The results based on the prediction performance of the external validation set expressed by RMSEP (root mean square error of prediction) demonstrated that it is possible to develop good models to simultaneously determine calcium carbonate, magnesium carbonate and magnesium oxide content in powdered samples that can be used in the study of the thermal decomposition of dolomite rocks.
Keywords: dolomite, DRIFTS, partial least squares, multivariate regression, ternary mixture design
Introduction
The reserves of carbonate rocks in the state of Rio Grande do Sul - Brazil, are mainly constituted by dolomite-like rocks (MgO content ≅ 18%), while calcite-like rocks (MgO content < 4%) occur in a smaller proportion. It is assumed that, in volume, only 18% of the calcareous rocks are calcite-like (used mainly in cement production) and
82% are dolomite-like and are used mainly in the correction of soil acidity and in the production of lime.
carbonates (52% and 40% approximately),1 at a given
temperature and a complete calcination process that results in a mix of calcium carbonate combined with magnesium oxide in the same material.
The lack of specific methodologies2-6 that allow the
joint analysis of the mix of obtained products from the fractionated calcination of the dolomite-like rocks led to the development of a technique that enabled the quantitative analysis of calcium carbonate and magnesium oxide by means of Diffuse Reflectance Infrared Fourier Transform Spectroscopy (DRIFTS).
Several studies that use infrared spectrometry have been carried out in the last few years in order to qualitatively and quantitatively determine organic and inorganic compounds in soils and rocks.7-11 Among these
studies, special attention has been given to those employing mid-infrared (DRIFTS)12-14 and near-infrared
(NIRRS) reflectance.15-16
This is a non-invasive method of analysis that allows for the quantification of the main components in the mix of generated products in one measurement, with a high degree of reliability.17 The determination of the contents in the mix
is very important for the quality control of the calcination and separation processes. Furthermore, the evaluation method also allows the control of final quality of the singular products generated after the extraction process.
The partial least squares (PLS) regression method18-25
is an outstanding method of multivariate regression usually applied to ternary systems, especially when preceded by a robust factorial design.26,27 Furthermore, there are many
software packages that include the PLS regression method as a routine treatment of spectral data as obtained by DRIFTS.28-31
The present paper proposes the use of the DRIFTS-PLS method to determine the concentration in weight of calcium carbonate, magnesium carbonate and magnesium oxide. The major advantages are that these analyses do not require extensive sample preparation,32 are
non-invasive, and do not produce residues that are harmful to the environment.
Experimental Design
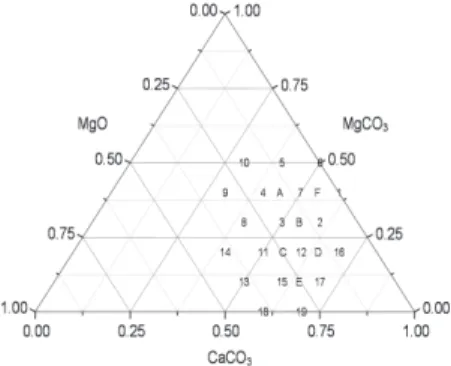
Mixture design has been used throughout this work in order to model the ternary system, which is composed of the following analytes: calcium carbonate, magnesium carbonate and magnesium oxide. Nineteen mixtures were distributed along the ternary diagram presented in Figure 1. These mixtures will be used to develop the multivariate regression models. Other six mixtures, represented by tiny light letters, were selected to compose the validation set.
Samples
Powdered samples of calcium carbonate, magnesium carbonate and magnesium oxide were used in order to prepare a set of standard mixtures with different concentrations according to the mixture design. Calcium carbonate was supplied by FERTISUL, located in the state of Paraná, in southern Brazil, magnesium carbonate was donated by UNISINOS, located in the state of Rio Grande do Sul, in southern Brazil, and commercial analytical-grade magnesium oxide was supplied by VETEC.
After the mixture was made, each component percentage was recalculated, and the final values are presented in Table 1. The calcium carbonate content varied between 29.99 and 70.00%, the magnesium carbonate content varied between 0.00 and 49.99% and the magnesium oxide content, between 0.00 and 40.03%. The same procedures were used with the external validation set samples.
Spectra
Each previously prepared standard was diluted in spectroscopic-grade KBr at a ratio of 1:49. The mid-infrared reflectance spectra were recorded from 4000 to
450 cm-1 with an FT-IR NICOLET spectrometer MAGNA
550 according to Table 2 parameters and using a diffuse reflectance accessory EasiDiff PIKE Technologies, Inc. KBr (spectroscopic grade) was used as background and the spectra were obtained in triplicate for each sample.
The same procedures were used with the external validation set samples.
Software
OMNIC E.S.P. v.3.1 was used to acquire the spectra and to calculate an average spectrum. TurboQuant v.1.1 was employed in the modeling.
Figure 1. Mixture design of ternary system of calcium carbonate,
Modeling
The partial least squares (PLS) regression method was employed on the modeling using the standard set. Briefly, spectra were pretreated by either mean-centered and variance-scaled or mean-centered only.
Variables selection
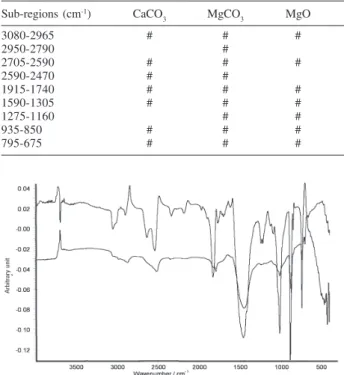
PLS regression on the full spectra range was performed on the nineteen standard spectra. The first three acquired latent variables (LV) are presented in Figure 2. Throughout the development of the calibration models the sub-regions where there was large LV2 or LV3 signal contribution were used and are presented in Table 3 and Figure 3.
The stepwise elimination algorithm33 was used to
optimize the regions used in the models, and a coefficient of determination increase and PRESS (Predictive Residual Error Sum Of Squares) decreases were used as selection criteria.
Evaluating models
The six validation sample prediction errors were
calculated in order to compare the models beyond the calculated coefficient of determination (R2) with the
calibration standards. Another adequate parameter used to simultaneously evaluate the six samples is called RMSEP (Root Mean Square Error Of Prediction), being calculated according to expression 1.
(1)
where yi is the reference value for the i-th sample and y^i is the predicted value for the same sample and n to the number of validation samples.
Table 3. Sub-regions selected for each analytes
Sub-regions (cm-1) CaCO
3 MgCO3 MgO
3080-2965 # # #
2950-2790 #
2705-2590 # # #
2590-2470 # #
1915-1740 # # #
1590-1305 # # #
1275-1160 # #
935-850 # # #
795-675 # # #
Figure 2. Loadings for latent variables of the reference model.
Figure 3. Sub-regions selected through the 2nd and 3rd latent variable
loadings.
Table 2. Experimental parameters for spectra acquisition
Parameters Set value
Number of scans 128
Resolution 8 cm-1
Gain 8
Mirror speed 0.4747
Aperture 100
Detector DTGS KBr
Beamsplitter KBr
Table 1. Percentage weight of the samples in the standard set
Standard # CaCO3 MgCO3 MgO
(% in weight) (% in weight) (% in weight)
1 60.00 40.00 0.00
2 60.03 29.97 10.00
3 49.99 29.98 20.03
4 40.00 40.00 20.00
5 40.00 49.99 10.01
6 50.01 49.99 0.00
7 50.04 39.97 10.00
8 39.97 30.00 30.03
9 29.99 40.00 30.01
10 30.03 49.98 19.99
11 49.99 20.02 29.99
12 59.99 19.98 20.03
13 49.98 10.00 40.03
14 40.01 20.00 39.99
15 59.98 10.00 30.03
16 69.97 20.01 10.02
17 69.96 10.01 20.03
18 60.00 0.00 40.00
Results and Discussion
After many attempts to obtain a calibration model it was verified that two different pre-processing produced better results. Both models used the regions shown in Table 3. It is worthwhile to note that there are regions selected by LV2 and LV3 criteria and not used in the optimization. A different region set was selected for each analyte.
The model that used mean-centered pretreatment is called model 1. In model 2 the mean-centered data were also variance scaled.
The minimum PRESS was used in the calibration process together with the search for minimum RMSEP. For model 1 those criteria give three latent variables (factors) for CaCO3 and MgCO3 and four latent variables for MgO. For model 2, three latent variables were obtained for all analytes.
The 19 standard samples used for calibration yielded coefficient of determination (R2) values of 0.954, 0.954
and 0.989 for CaCO3, MgCO3 and MgO, respectively, in model 1; and 0.974, 0.967 and 0.959 in model 2, showing a good linear correlation.
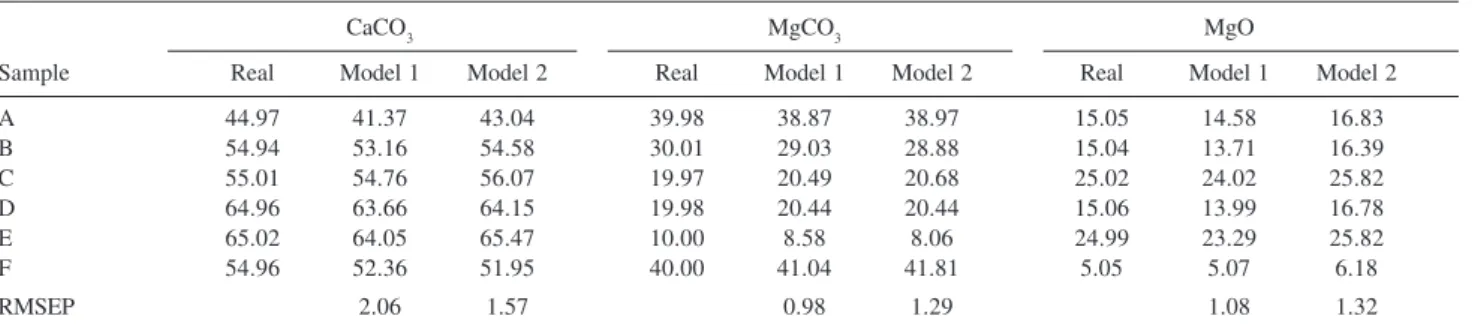
The prediction results for the validation set of the six samples are presented in Table 4 for both models and compared with the real values. Also presented in the table are RMSEP values for each analyte. These results can be considered quite reasonable for the both preprocessing techniques.
The RMSEP values can be used to suggest that the prediction value for each analyte is better obtained when
model 1 is used for MgCO3 and MgO and model 2 for
CaCO3.
Conclusions
In this work it was demonstrated that it is possible to develop a model to be used in the study of the thermal decomposition of dolomite rocks. It was possible to simultaneously determine the three basic analytes: calcium
carbonate, magnesium carbonateand magnesium oxide
by employing partial least squares regression methods in DRIFTS data.
The model that used the mean-centering technique gives better results for magnesium carbonate and magnesium oxide, whereas a model that also included variance-scaled data gives better results for calcium carbonate.
This method is therefore ideal for monitoring the calcination of dolomitc rocks and of other carbonate-rich rocks. The major advantages are that these analyses do not require extensive sample preparation, are non-invasive, do not produce residues that are harmful to the environment, and are less time-consuming, especially when used on a routine basis.
Acknowledgments
The authors acknowledge FERTISUL, located in the state of Paraná, in southern Brazil, and UNISINOS, located in the state of Rio Grande do Sul, in south Brazil, for the samples used in this work.
References
1. Deer, W. A.; Howie, R. A.; Zussman, J.; Minerais Constituintes das Rochas: Uma Introdução. Fundação Calouste Gublenkian: Lisboa, 1981.
2. Ootto, J. W.; Wyllie, P. J.; Mineral. Petrol.1993, 48, 343. 3. Silaban, A.; Narcida, M.; Harrison, D. P.; Chem. Eng. Commun.
1996, 146, 149.
4. Lin, C. -C.; Liu, L. -g.; Phys. Chem. Miner.1997, 24, 149. 5. Wainerdi, R. E.; Uken, E. A.; Modern Methods of Geochemical
Analysis, Plenum Press: New York, 1971.
6. Arvidson, R. S.; Mackenzie, F. T.; Aquat. Geochem. 2000, 6, 2000.
7. Pérez Ponce, A.; Garrigues, P. M.; Garrigues, S.; de la Guardia, M.; Analyst1998, 123, 1817.
8. Paroz, G. N.; Frost, R. L.; Analyst1998, 123, 2813.
9. Mecozzi, M.; Pietrantonio, E.; Amici, M.; Romanelli, G.; Analyst2001, 126,144.
Table 4. Prediction values for all analytes and RMSEP values for both models
CaCO3 MgCO3 MgO
Sample Real Model 1 Model 2 Real Model 1 Model 2 Real Model 1 Model 2
A 44.97 41.37 43.04 39.98 38.87 38.97 15.05 14.58 16.83
B 54.94 53.16 54.58 30.01 29.03 28.88 15.04 13.71 16.39
C 55.01 54.76 56.07 19.97 20.49 20.68 25.02 24.02 25.82
D 64.96 63.66 64.15 19.98 20.44 20.44 15.06 13.99 16.78
E 65.02 64.05 65.47 10.00 8.58 8.06 24.99 23.29 25.82
F 54.96 52.36 51.95 40.00 41.04 41.81 5.05 5.07 6.18
10. McCarty, G. W.; Reeves III, J. B.; Reeves, V. B.; Follett, R. F.; Kimble, J. M.; Soil Sci. Soc. Am. J.2002, 66, 640.
11. Daniel K.W.; Tripathi N. K.; Honda, K.; Aust. J. Soil Res.2003, 41, 47.
12. Wijnja, H.; Schulthess, C. P.; Spectrochim. Acta1999, 55A, 861.
13. Tung, J. W. T.; Tanner, P. A.; Mar. Chem. 2003, 80, 161. 14. Madejová, M.; Vib. Spectrosc. 2003, 31, 1.
15. Chang, C. W.; Laird, D. A.; Mausbach, M. J.; Hurburgh Jr., C. R.; Soil Sci. Soc. Am. J.2001, 65, 480.
16. Coûteaux, M. M.; Berg, B.; Rovira, P.; Soil Biol. Biochem. 2003, 35, 1587.
17. Tevrucht, M. L. E.; Griffiths, P. R.; Talanta 1991, 38, 839. 18. Osborne, C.; Int. Stat. Rev.1991, 59, 309.
19. Ferreira, M. M. C.; Antunes, A. M.; Melgo, M. S.; Volpe, P. L. O.; Quim. Nova1999, 22, 724.
20. Wold, S.; Esbensen, K.; Geladi, P.; Chemometrics Intell. Lab. Syst.1987, 2, 37.
21. Sjöström, M.; Wold, S.; Lindberg, W.; Persson, J. A.; Martens, H.; Anal. Chim. Acta1983, 150, 61.
22. Wold, S.; Tecnometrics1978, 20, 397. 23. Brereton, R. G.; Analyst2000, 125, 2125.
24. Sena, M. M. , Poppi, R. J.; Frighetto, R. T. S.; Valarini, P. J.; Quim. Nova 2000, 23, 547.
25. Ferrão, M. F.; Davanzo, C. U.; Anal. Chim. Acta2005, 540, 411.
26. Scarmínio, I. S.; Oliveira, A. E.; Bruns, R. E.; J. Mol. Struct.: THEOCHEM1999, 464, 163.
27. Schönherr, A.; Hüning, S. L.; Ferrão, M. F.; Jandrey, A.; Tecno-Log.1998, 2, 9.
28. Pereira, E. S.; Riella, H.G.; An. Assoc. Bras. Quim.1995, 44, 15.
29. Reis, C.; Andrade, J. C., Quim. Nova1996, 19, 313. 30. Zamora, P. P.; Ponce, L. C.; Nagata, N.; Poppi, R. J., Quim.
Nova1997, 20, 469.
31. Adams, M. J.; Chemometrics in Analytical Spectroscopy, RSC: Cambridge, 1995.
32. Bastiani, R.; Zonno, I. V.; Santos, I. A.; Henriques, C. A.; Monteiro, J. L. F.; Braz. J. Chem. Eng.2004, 21, 193. 33. Lucasius, C. B.; Beckers, M. L. M.; Kateman, G.; Anal. Chim.
Acta1994, 286, 135.
Received: September 30, 2005
Published on the web: April 19, 2006