Paul R. Martin and Ulrike Grünert, ARC Centre of Excellence in Vision Science, University of Sydney, 8 Macquarie St, Sydney, New South Wales 2001 Australia. Save Sight Institute, The University of Sydney, 8 Macquarie St, Sydney, New South Wales 2001 Australia. Discipline of Physiology, The University of Sydney, Building F13, Sydney, New South Wales 2006 Australia. Correspondence regarding this article should be directed to: Paul R Martin, Save Sight Institute C09, The University of Sydney, NSW 2006 Australia. Phone: +612 9382 7631 E-mail: [email protected]
Color signals in retina and lateral geniculate nucleus of
marmoset monkeys
Paul R. Martin and Ulrike Grünert
University of Sydney, Sydney, NSW, Australia
Abstract
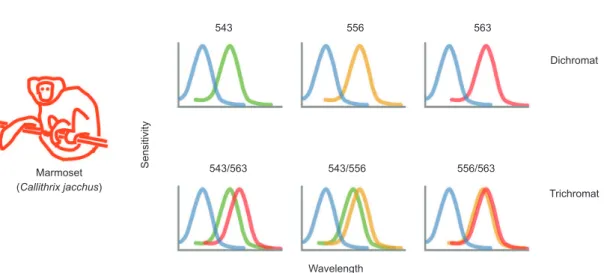
Marmosets show sex-linked polymorphism of color vision, whereby all males and some females show dichromatic (“red-green color-blind”) vision based on two classes of photoreceptor sensitive to short or medium wavelength bands. Most female marmosets by contrast express three photoreceptor classes, one sensitive to short wavelengths and two classes in the medium-long wavelength sensitivity band. We used this ‘natural knock-out’ to study the organization of color vision pathways in primates. We review here results from our and other laboratories showing how the primordial dichromatic blue-yellow pathway is characterized by selective connections to short wavelength sensitive cones in the retina and that signals for blue-yellow color vision travel through an ancient part of the subcortical visual pathway called the koniocellular system. Signals serving red-green color vision by contrast are tightly linked to retinal circuits serving high-resolution spatial vision at the fovea and show little sign of specific patterns of connections with medium- and long-wavelength sensitive cones. Routine trichromatic color vision thus is based on converging signals from two quite distinct retinal and subcortical pathways. Keywords: color, neurophysiology, neuroanatomy, primate, evolution.
Received 23 July 2012; received in revised form 12 November 2012; accepted 16 November 2012. Available online 18 November 2013.
Introduction
The collected papers in this volume are presented in honor of our long-standing mentor, friend and collaborator Barry B. Lee. We thank him sincerely for
his valued and continued contributions to the ields
of color science and visual neuroscience. This review paper concerns the nerve pathways carrying signals that serve color vision in primates with emphasis on data from experiments on marmoset monkeys.
Our concentration here is on a single species of New World monkey (Callithrix jacchus) that our laboratories have studied for over 20 years. In common with many other New World monkeys, marmosets show sex-linked polymorphism of cone photoreceptor opsin expression. Such species provide a “natural knock-out experiment” to study how variation in cone opsin expression changes the function of visual pathways. The methods used include light- and electron microscopy, immunocytochemistry, retrograde labelling and
tract-tracing, and extracellular recording from single neurones in the afferent visual pathways. Recommended reviews in related topics are as follows: genetics and evolution of mammalian color vision (Jacobs, 1993; Nathans, 1999; Neitz & Neitz, 2011), retinal anatomy and physiology (Dacey & Packer, 2003; Field & Chichilnisky, 2007; Lee, Martin, & Grünert, 2010; Silveira et al., 2004; Wässle, 2004), and cortical mechanisms processing color (Conway et al., 2010; Gegenfurtner, 2003; Shapley & Hawken, 2011).
Basis of marmoset polymorphic color vision
Color vision requires photoreceptors sensitive to distinct spectral bands and on a brain that can use these photoreceptor signals to recover informationabout spectral relectance of objects in the environment.
Figure 1. Variety of photoreceptor pigment expression exhibited by marmosets. Each graph shows schematically the spectral sensitivity range and peak of the photoreceptor classes expressed by dichromatic marmosets (upper row) and trichromatic marmosets (lower row).
the medium-long (ML) wavelength range of the visible spectrum. Female marmosets carrying the same allele on each X chromosome show, in common with male marmosets, dichromatic color vision. Female marmosets carrying distinct alleles on each X chromosome express two ML pigments with spectral peaks separated by 7 nm (for the 556 nm/563 nm combination), 13 nm (for the 543 nm/556 nm combination), or 20 nm (for the 543 nm/563 nm combination) and can make trichromatic color discriminations (Tovée et al., 1992; Williams et al., 1992). Thus, in addition to studying differences between dichromatic and trichromatic color vision, the effects of varying degree of spectral separation between M and L pigments can be examined in marmosets.
Retinal pathways for colour signals: S cone
pathways
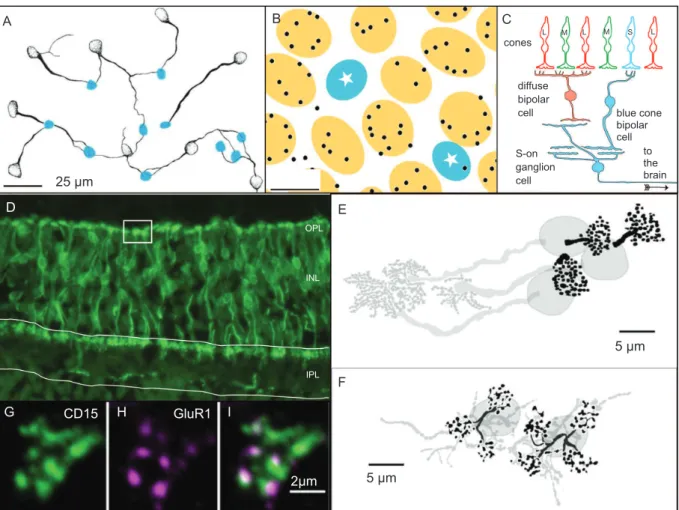
The retinal pathways thought responsible for transmitting S cone signals to the marmoset brain are summarized in Figure 2. Signals from cone photoreceptors are transmitted to retinal output neurons (ganglion cells) through multiple classes of bipolar cells, which contact cones in the outer plexiform layer and contact ganglion cells in the inner plexiform layer
(Boycott & Wässle, 1991). The major functional division
of bipolar cells is into ON type bipolar cells (which are depolarized subsequent to increased photon absorption in photoreceptors), and OFF type bipolar cells, which are depolarized by decreased photon absorption in photoreceptors (Nelson & Kolb, 2003).
In whole mount retina preparations, the S cones and the blue cone bipolar cells can be labelled and their
pattern of connections traced (Figure 2A, modiied
from Luo, Ghosh, Martin, & Grünert, 1999). Such preparations reveal that dendritic processes of blue
cone bipolar cells (stippled outlines, Figure 2A) extend horizontally across the outer plexiform layer to reach individual S cone pedicles (blue outlines, Figure 2A). In this way, signals from the S cone array are transmitted to the blue cone bipolar array (Ghosh, Martin, & Grünert, 1997; Kouyama & Marshak, 1992; Kouyama & Marshak, 1997; Schein, Sterling, Ngo, Huang, & Herr, 2004).
In common with other ON-type bipolar cells, the blue cone bipolar cells express the sign-inverting metabotropic glutamate receptor MgluR6 and thus increased photon absorption in S cones leads to depolarization of blue cone bipolar cells (Nomura et al., 1994; Vardi, Duvoisin, Wu, & Sterling, 2000). Additional to the selective connections with the S cone array, the blue cone bipolar cells make a small number of “blind ending” dendrites with unknown connectivity. Some of these endings may contact ML class cones, but the exact connectivity has not been established (Kouyama & Marshak, 1992; Luo et al., 1999).
There is agreement that the vast majority of
ON-type connections between bipolar cells and S cones are made with blue cone bipolar cells (Herr, Klug, Sterling, & Schein, 2003; Kolb, Goede, Roberts, McDermott, & Gouras, 1997; Kouyama & Marshak, 1992; Luo et al., 1999). Thus, the spectral sensitivity of blue cone bipolar cells should be weighted to the S wavelength band. The pattern of connections between S cones and other bipolar cell classes is less well established but some progress has been made, as summarized below.
The ML class cones in primates make contact with multiple parallel bipolar channels (Boycott & Wässle, 1991; Calkins, Tsukamoto, & Sterling, 1996;
Haverkamp, Grünert, & Wässle, 2000). The majority of
bipolar contacts to M and L cones are from midget bipolar Marmoset colour vision phenotypes
Marmoset
(Callithrix jacchus)
Sensitivity
Dichromat
Trichromat
Wavelength 543
543/563 543/556 556/563
Figure 2. Selective and random connections in retinal color pathways. (A) Drawing from a double-labelled preparation of whole mount marmoset retina showing blue cone bipolar cells (stippled) and S cone pedicles (blue plaques). The M and L cone pedicles are not shown. Note that blue cone bipolar dendrites are selectively associated with S cone pedicles. (B) Drawing of a marmoset retina showing the dendritic terminals of diffuse-ON DB4 bipolar cells (black puncta) are selectively associated with ML class cones (yellow plaques) and make little or no contact with S cones (starred blue plaques). (C) Selective contact patterns can contribute to blue-ON/yellow-OFF response property of small bistratiied (blue-ON) ganglion cell. The blue cone bipolar cells connections are selective for S cones, whereas the diffuse-OFF bipolar (most likely, DB2 and DB3) connections are selective for ML cones. These cone selective signals confer blue-ON/yellow-OFF properties by convergence to the ganglion cell dendrites. (D) Midget-OFF bipolar cells and diffuse DB6 bipolar cells are labelled by antibodies to CD15 in this vertical section of marmoset retina. Note the palisade of single-cone contacting midget dendrites (two are enclosed by the white box). (E) Drawings of midget bipolar cells in marmoset fovea showing points of single cone connections (black clusters) and axons that contact midget-PC pathway ganglion cells (grey clusters). (F) Drawings of two midget bipolar cells at 3.6 mm from the fovea. These cells get convergent input from three and four cones, respectively (black clusters). (G,H,I) Evidence for synaptic (OFF-type) contact of midget bipolar cells at ML cone pedicles: (G) midget bipolar terminal, (H) OFF-type (AMPA) glutamate receptor clusters, (I) overlay. The dendritic tips are associated with glutamate receptors at points of contact with the cone pedicle. Panel A modiied from Luo et al. (1999); panel B modiied from Lee & Grünert (2007); panel D modiied from Chan et al. (2001); panels E and F modiied from Telkes et al. (2008).
cells (Kolb, 1970); the remaining contacts are divided among seven or more diffuse bipolar cell types that each make relatively small numbers of synapses with multiple cones (Boycott & Hopkins, 1991; Boycott & Hopkins, 1993; Boycott & Wässle, 1991; Calkins, Tsukamoto, & Sterling, 1998; Chun, Grünert, Martin, & Wässle, 1996; Hopkins & Boycott, 1997). There is evidence for a bias against diffuse bipolar cell connections with S cones (Figure 2B, Lee & Grünert, 2007; Lee, Jusuf, & Grünert, 2004; but see also Joo, Peterson, Haun, & Dacey, 2011; Puthussery, Gayet-Primo, Taylor, & Haverkamp, 2011). Thus, the spectral sensitivity of diffuse bipolar cells
should be weighted to the medium-long wavelength band. The differential spectral weighting of bipolar inputs to (ON type) blue cone bipolar and (OFF type) diffuse bipolar classes DB2/DB3 is the best-supported explanation for the characteristic
“blue-ON/yellow-OFF” receptive ield property of small bistratiied
ganglion cells in the retina (Figure 2C) and their thalamic target cells in the lateral geniculate nucleus (Chichilnisky & Baylor, 1999; Crook et al., 2009; Dacey & Lee, 1994). Blue-ON cells typically respond poorly to achromatic contrast (Tailby, Solomon, & Lennie, 2008a;
Tailby, Szmajda, Buzás, Lee, & Martin, 2008b); this
A B C
D E
F
G CD15 GluR1
2µm 5 µm
5 µm 25 µm
cones
L M L M S L
diffuse bipolar
cell blue cone
bipolar cell
to the brain
OPL
INL
IPL
S-on ganglion cell
I
fact is consistent with in vitro recordings from macaque retina showing that both the blue-ON and yellow-OFF
receptive ield subunits have inherited center-surround
structure from their bipolar and horizontal cell inputs (Crook et al., 2009; Field et al., 2007).
The blue-OFF pathway is less well understood than the blue-ON pathway. To date, an S cone-selective blue-OFF bipolar cell has not been described for primate retina. In marmoset retina, only very sparse connections between S cones and OFF midget bipolar cells are present (Lee, Telkes, & Grünert, 2005; Telkes, Lee, Jusuf, & Grünert, 2008). In macaque fovea, an electron microscopic study found that OFF midget bipolar cells made contacts with S cones (Klug, Herr, Ngo, Sterling, & Schein, 2003), but blue-OFF receptive
ields reported in primates are substantially larger than midget-parvocellular ields at the same eccentricity
(Dacey & Packer, 2003; Dacey, Peterson, Robinson, &
Gamlin, 2003; Szmajda, Buzás, FitzGibbon, & Martin,
2006; Tailby et al., 2008a,b; Tailby, Dobbie, Hashemi-Nezhad, Forte, & Martin, 2010). Signals from S cones
contribute to midget-OFF receptive ields in peripheral
macaque retina (Field et al., 2010) but these signals are also non-opponent (i.e.,, they have the same sign as M and L inputs). These apparent inconsistencies between anatomy and physiology are an important unsolved puzzle. Recent demonstration of a blue-on type amacrine cell in rodent retina (Chen & Li, 2012) raises the possibility that a homologous pathway in primate retina could invert blue-on signals from bipolar cells to supply blue-off type responses in ganglion cells.
ML cone pathways in the fovea
In contrast to the selective connections between the S cone array and the blue cone bipolar array, there is to date no compelling evidence that midget or diffuse bipolar cells discriminate between M and L cones (Boycott & Wässle, 1991; Chan, Martin, Clunas, & Grünert, 2001; Silveira, Grünert, Kremers, Lee, & Martin, 2005; Silveira, Lee, Yamada, Kremers, & Hunt, 1998; Telkes et al., 2008). Figure 2D shows a vertical section of marmoset retina processed with antibodies to CD15; in marmosets this antibody labels OFF-type midget bipolar cells and the diffuse bipolar class DB6 (Chan et al., 2001; Telkes et al., 2008). In the fovea, the midget bipolar cells form a dense array with each cell contacting a single cone photoreceptor. Each midget bipolar cell
can thus signal spatial contrast over a receptive ield
corresponding to that of a single cone and will also inherit the spectral signature (M or L) of the contacted cone. Each midget bipolar cell makes dominant contact with a single midget ganglion cell in the inner plexiform layer. Again in the fovea there is one-to-one connectivity giving a ‘private line’ for signals from each foveal cone (Jusuf, Martin, & Grünert, 2006a).
The ‘private line’ connections extend to about 10 degrees in macaque monkey, cebus monkey, marmoset, and human retina (Silveira et al., 1998); at greater eccentricities in macaque retina the one-to-one
connections between cones and midget bipolar cells persist, but each ganglion cell starts to draw input from multiple bipolar cells (Goodchild, Ghosh, & Martin, 1996; Wässle, Grünert, Martin, & Boycott, 1994). Some private line connections may persist up to 50 degrees in human retina (Kolb, Linberg, & Fisher, 1992). Beyond ~10 mm (40 degrees) in macaque retina the midget bipolar cells each contact two or more cones. In marmoset retina the one-to-one pattern breaks down even closer to the fovea (Telkes et al., 2008; Yamada, Silveira, Gomes, & Lee, 1996): below 1 mm eccentricity each midget bipolar cell contacts a single cone (Figure 2E) but already at 1 mm the midget bipolar dendrites branch to form multiple clusters contacting 3–4 cone pedicles (Figure 2F).
Apart from qualitative differences in convergence, nearly all anatomical evidence points to common functional mechanisms for retinal processing in New World (e.g., marmoset) and Old World (e.g., macaque, human) primates (Kremers, Weiss, & Zrenner, 1997; Kremers, Zrenner, Weiss, & Meierkord, 1998). For example, OFF bipolar cells express ionotropic AMPA/ kainate receptors (Figure 2G–H) in both marmoset (Puller, Haverkamp, & Grünert, 2007) and macaque retina (Haverkamp, Grünert, & Wässle, 2001). There may, however, be a species difference with respect to expression of AMPA/kainate receptors postsynaptic to S cone pedicles. Haverkamp et al. (2001) found GluR1 receptors opposed to all cones including S cones in macaque retina, but in marmosets GluR1 (AMPA) receptors were not associated with S cones (Puller et al., 2007). This difference may be related to the potential differences in S cone connections of OFF midget ganglion cells outlined above, but other possibilities such as antibody cross-reactivity cannot be ruled out.
ML cone pathways outside the fovea
The presence of one-to-one connections in the fovea gives the only (so far) demonstrated substrate for preserving M and L cone signals in primate retina. But how then could the psychophysically demonstrated (albeit weak) persistence of red-green color vision
in peripheral visual ield be supported? Figure 3
summarizes the problem. In the fovea (Figure 3A), each M and L cone provides input through one-to-one
connections to the receptive ield center of ON and
OFF type midget ganglion cells: in other words, there is divergence of cone signals to ganglion cells. Further from the fovea (Figure 3B; for simplicity, only connections of ON type ganglion cells are shown) the cones are more widely spaced (i.e., their spatial density is lower), some midget bipolar cells contact multiple cones, and midget ganglion cells receive input from multiple bipolar cells: in other words, there is convergence of cone signals to ganglion cells.
Figure 3. Random wiring model for transmission of red-green signals in the midget-parvocellular (midget-PC) pathway. (A) Schematic vertical section of foveal retina. Each medium (M) and long (L)-wavelength sensitive cone makes contact with midget-ON and midget-OFF bipolar and ganglion cells, thus preserving the spatial and chromatic signals in the foveal array. (B) Schematic of the mid-peripheral retina. For simplicity, only ON-type connections are shown. Here, some bipolar cells contact multiple cones and there is also convergence of bipolar to ganglion cells, thus spectral mixing of cone signals to midget-PC pathway ganglion cell centers becomes increasingly likely with increasing distance from the fovea. (C,D) Estimates of the numbers of M and L cones providing convergent input to midget-PC ganglion cells (via
midget bipolar cells) at different distances from the fovea. Drawings in (D) show midget-PC ganglion cells labelled by intracellular injection or following retrograde injections in lateral geniculate nucleus parvocellular layers. (E) Numerical estimates of convergence and predicted cone mixing to midget-PC pathway receptive ield centers at different distances from the fovea.
cells (Figure 3B, left). Thus, the color signature of the
ganglion cell receptive ield center will be a weighted
sum of the local proportion of M and L cones. It is important to remember that convergence does not preclude spectral selectivity, but only makes it less likely. A ganglion cell that receives its dominant input from bipolar cells contacting the same M or L cone type (Figure 3B, right) will show perfectly respectable cone opponent properties. But such ‘good luck’ becomes ever less likely at higher eccentricities (Figure 3C–E).
We know that outside the fovea the receptive ield
center area of midget cells roughly corresponds to the
area of its dendritic arbour (Buzás, Blessing, Szmajda,
& Martin, 2006; Dacey, 1999, see also Figure 7 below; Wässle & Boycott, 1991). The potential cone inputs to midget ganglion cells at different eccentricities can thus be estimated by comparing local cone density (Figure 3C) with ganglion cell dendritic arbors (Figure 3D). The resulting estimates for marmoset retina (Figure 3E)
show that the midget receptive ield center receives input
from ∼15 cones at 10 degrees eccentricity and ∼90 cones at 40 degrees (Goodchild et al., 1996). The binomial probabilities that >80% of cones will have the same (M or L) type are 0.03 at 10 degrees and 8 x 10⁻⁹ at 40 degrees,
so it is obvious that outside the fovea, spectrally pure cone centers would be exceedingly rare if connections were random. We return to this issue in a later section.
Segregation of color signals in the lateral
geniculate nucleus
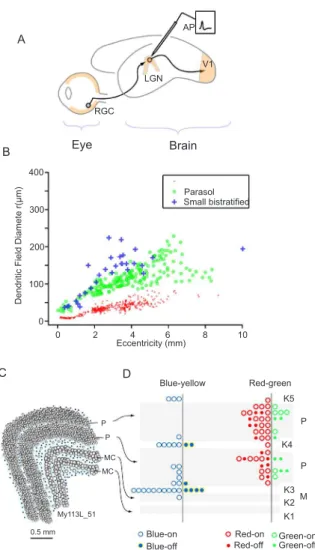
Figure 4 summarizes the outputs of primate retina and distribution of cone signals in the main dorsal thalamic target of ganglion cell axons, i.e., the dorsal lateral geniculate nucleus (LGN). Thalamocortical relay cells in the LGN get dominant input from one or (less frequently) more ganglion cells and each ganglion cell action potential triggers a relay cell action potential with probability about 0.5 (Kaplan, Purpura, & Shapley, 1987; Lee, Virsu, & Elepfandt, 1983). It is important
to remember that the LGN is not just a simple relay
for visual signals but participates in local interneuron circuits, sends collaterals to and receives inhibitory feedback from the thalamic reticular nucleus, receives
reciprocal projections from layer VI of primary visual
cortex, and is also innervated by neuromodulating systems in divisions of the midbrain reticular formation (Casagrande & Norton, 1991; Sherman & Guillery, 2006). Nevertheless, in anesthetized animals, the dominant excitatory drive to relay cells comes from the
retina and the receptive ield properties of relay cells are a good relection of the properties of the afferent ganglion
cells. Thus, monitoring extracellular action potentials
from LGN relay cells is a way to monitor the irst site of
interaction between the eye and the brain, with emphasis in anesthetized animals on signals coming from the eye.
A
L M M L M L L
cones
bipolar cells
ganglionz cells
OFF
ON
10 µm
eccentricity (mm)
(deg)
(n)
binomial P(M | L) > 80%
0.3 1.7
13
15
0.03
4.6
37
87
8 x 10 -9 <1
1
1 eccentricity
cones in rf centre
ON
B
C
D
Figure 4. Transmission of color signals through the lateral geniculate nucleus (LGN) in marmosets. (A) Schematic view of marmoset eye and brain showing connections of a retinal ganglion cell (RGC) in the eye to a relay cell in the dorsal lateral geniculate nucleus (LGN). The relay cell signals are transmitted to primary visual cortex (V1); extracellular action potentials (AP) can be monitored at the relay cell to characterize receptive ield properties. (B) Anatomical distinction of midget-parvocellular (PC), parasol-magnocellular (MC) and small bistratiied-koniocellular (K-bon) pathways. Dendritic ield diameter (a rough proxy for receptive ield center diameter) of PC cells is smaller than that of MC or KC cells at a given distance from the fovea. (C) Drawing from a coronal section through marmoset LGN showing arrangement of the PC, MC and KC layers. (D) Summary of receptive ield encounter position in a ‘lattened’ schematic of the LGN. The blue-yellow opponent receptive ields are largely, but not completely, segregated to the KC layers, whereas red-green opponent ields are largely, but not completely, segregated to the PC layers.
1984; Rodieck & Watanabe, 1993; Szmajda, Martin,
& Grünert, 2008). Anatomically the midget pathway
constitutes the smallest dendritic ields and the PC layers
make up roughly 80% of the volume of the LGN (Ahmad & Spear, 1993; Connolly & Van Essen, 1984; White, Goodchild, Wilder, Sefton, & Martin, 1998). At a given
distance from the fovea the midget-PC projecting cells have about 1/3 the diameter of parasol-MC projecting
cells (Figure 4B), and the MC layers make up roughly
10% of LGN volume. Small bistratiied cells likely project dominantly to the koniocellular/interlaminar
(KC) division of the LGN: they are preferentially
labelled following retrograde tracer injections targeted to KC layers (Szmajda et al., 2008) and blue-ON/ yellow-OFF receptive ields are commonly (but not
exclusively) encountered in layer K3 between the PC and MC layers (Martin, White, Goodchild, Wilder, & Sefton, 1997). Figure 4C shows a schematic coronal section through marmoset LGN to illustrate the relative size and position of the PC and MC layers with the intercalated KC layers. The encounter frequency of blue-yellow and red-green opponent responses (recorded in trichromatic female marmosets) is shown relative to the borders of PC, MC and KC layers in Figure 4D. Here the anatomical segregation of blue-yellow opponent responses becomes clear. Although the KC layers make
up only ~10% of LGN volume, the majority of blue-yellow receptive ields is encountered in KC layers.
By contrast, the red-green opponent responses are segregated to PC layers (Blessing, Solomon, Hashemi-Nezhad, Morris, & Martin, 2004; Martin et al., 1997;
Szmajda et al., 2006). Consistent results were also
obtained from recordings in LGN of macaque monkeys (Dreher, Fukada, & Rodieck, 1976; Roy et al., 2009; Schiller & Malpeli, 1978; Wiesel & Hubel, 1966). In summary, the pathways serving blue-yellow and red-green axes of color vision have quite distinct retinal substrates and remain anatomically segregated at least as far as the geniculocortical relay.
Multiplex color and acuity signals in PC
pathway receptive fields.
As outlined above, the low convergence (one-to-one connections) of midget-PC pathway bipolar and ganglion cells in the fovea give a plausible explanation for high spatial acuity as well as chromatic selectivity in
the receptive ield center of foveal PC cells. Theory and
observation also show that red-green opponent responses in PC cells can arise from the spatial opponent
(center-surround) structure of PC cell receptive ields provided
that spatial pooling in the surround is extensive enough to draw mixed M and L cone inputs (Crook, Manookin, Packer, & Dacey, 2011; Diller et al., 2004; Lennie, Haake, & Williams, 1991; Paulus & Kröger-Paulus, 1983; Solomon, Lee, White, Rüttiger, & Martin, 2005). This “random wiring” explanation for transmission of red-green signals is, however, incomplete; two main problems are as follows. First, red-green opponent responses are consistently recorded from PC cells The three best-characterized groups of ganglion
cells projecting to the LGN are midget, parasol and small bistratiied cells. Midget cells project to the
parvocellular (PC) layers of the LGN and parasol cells
project to the magnocellular (MC) layers (Leventhal,
Rodieck, & Dreher, 1981; Perry, Oehler, & Cowey,
A
B
C D
Eye Brain
RGC LGN
V1 AP
Parasol Small bistratiied 400
300
200
Dendritic Field Diamete r(µm)
100
0
0 2 4 6 8 10 Eccentricity (mm)
Blue-yellow
P P
MC MC
My113L_51
0.5 mm Blue-on
Blue-off Red-off
Red-on Green-on Green-off Red-green
K5
K4
P
K3 K2
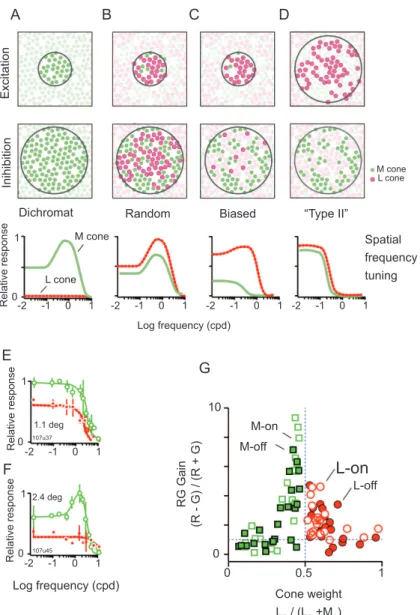
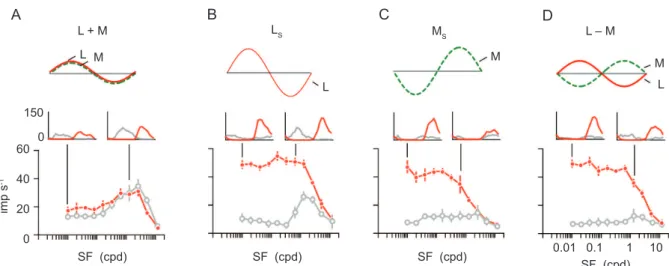
Figure 5. Characterization of red-green opponent responses (A-D). Each column shows a different hypothetical pattern of sampling from the extra-foveal ML cone mosaic to midget-parvocellular pathway (PC) cells. Top row shows excitatory (“center”) inputs, center row shows inhibitory (“surround”) inputs. Lower row shows predicted spatial frequency tuning for L cone selective and M cone selective gratings. Mixed inputs of either cone type to both excitation and inhibition lead to bandpass spatial frequency tuning, and selective inputs lead to lowpass frequency tuning. (E,F) Frequency tuning curves of two PC cells in marmoset lateral geniculate nucleus. Dashed lines show responses to L-cone selective (Ls) stimuli, solid lines show responses to M-cone selective (Ms) gratings. Curves in E are consistent with type II receptive ield organization, the receptive ield in F is dominated by M cone inputs. (G) Population responses of PC cells showing wide variation in relative response amplitude for Ls and Ms gratings, and cells with approximately balanced cone weights show high responsivity for red-green gratings. Panels E,F,G modiied from Martin et al. (2011).
outside the fovea where spatial pooling from M and L
cones to the receptive ield center should, on average,
substantially degrade chromatic selectivity. The resultant question then is whether red-green opponent PC cells outside the fovea are a specialized population
or just edges of a functional continuum of chromatic
and spatial opponent properties. Second, the signals from ‘randomly wired’ PC cells are ambiguous in the sense that changes in discharge rate could be produced by luminance or chromatic variation in the environment (Dreher et al., 1976; Ingling & Martinez, 1985; Lee, 1996; Shapley & Perry, 1986). Can the brain disentangle the responses of PC cells to get high-acuity spatial signals
or are PC cell responses only useful for color vision?
We have attacked these questions by studying receptive
ield properties of PC cells at different distances from
the fovea and by comparing responses of PC cells in LGN of dichromatic and trichromatic marmosets.
Figure 5A–D shows alternative ways that cone
inputs to PC cell receptive ields could be arranged in the peripheral (extrafoveal) visual ield of dichromatic and
trichromatic marmosets. The anatomical convergence
sketched here is appropriate for receptive ields at 20– 30 degrees eccentricity in the marmoset retina (Buzás
et al., 2006; Goodchild et al., 1996; Jusuf, Martin, & Grünert, 2006b). The location of individual cones that
A B C D
E
F
G
10
0
0 0.5 1
Inihibition
Relative response
Relative response
Relative response
RG Gain
(R - G) / (R + G)
Cone weight LS / (LS +MS)
Excitation
Dichromat Random Biased “Type II”
Spatial frequency tuning
Log frequency (cpd)
Log frequency (cpd)
M-on
107u37
107u45
M-off
L-off L-on
1.1 deg M cone
L cone
2.4 deg 1 1
0
1
0 0
-2 -1 0 1
-2 -1 0 1
-2 -1 0 1
could provide input (via retinal interneurons) to PC pathway ganglion cells are sketched as small colored points; cones showing strong functional connections
are illed with saturated color. Each column shows a different receptive ield arrangement. The upper row shows excitatory input to the receptive ield; the center
row shows inhibitory input. The lower rows shows the predicted shape of spatial frequency tuning curves for gratings that modulate only M cones (“M selective”, Ms) or only L cones (“L selective”, Ls). Because PC cells get negligible functional input from S cones in marmosets (Tailby et al., 2008b), the S cones have been omitted from the sketch diagrams. In a dichromatic marmoset expressing only M cones (Figure 5) there is no response to Ls gratings and the frequency response to Ms gratings shows the bandpass characteristic of
center-surround receptive ield organization. Three alternative
(but not mutually exclusive) hypothetical arrangements in trichromatic marmosets are shown. For simplicity,
high spatial frequency aliasing due to ine structure of
L and M cone expression is not considered. In a pure “random wiring” arrangement (Figure 5B), spatial tuning is band-pass for Ms and Ls gratings because both cone types contribute to center and surround. Alternatively, if the functional weight of inputs is biased (Figure 5C), in this example, to L cones in the center and M cones in the surround, the Ms response would be weaker than the Ls response and show more lowpass tuning. Figure 5D shows a canonical “Type II” receptive
ield arrangement where there is functional segregation
and spatial overlap of cone mechanisms; this receptive
ield is specialized to signal chromatic contrast as for
luminance (M+L) modulation the M and L signals would cancel. We evaluated the response patterns of PC cells in dichromatic and trichromatic marmoset against
these model receptive ields.
Figure 5E and 5F shows for two PC cells spatial frequency tuning curves consistent with pattern of cone inputs shown in Figure 5C,D. One cell (Figure 5E) shows overlapping and lowpass tuning for Ms and Ls gratings
as predicted for “Type II” receptive ield organization.
The second cell (Figure 5F) shows responses consistent with biased input whereby M cones contribute to both center and surround (yielding bandpass frequency tuning). L cones make only a weak contribution biased to the surround. These two cells were recorded from the same animal showing there is variability in receptive
ield properties. Population data from seven marmosets are shown in Figure 5G (Martin, Blessing, Buzás, Szmajda, & Forte, 2011). Here the relative weight of
M and L inputs (X axis) is estimated from response amplitude at low spatial frequencies (which activate both center and surround). The response amplitude for out-of-phase modulation of M and L cones (M–L, “red-green”) is shown relative to amplitude for in-phase (M + L, “luminance”) modulation on the Y axis. It is clear that cells with approximately balanced inputs from M and L cones show higher chromatic selectivity. The important point is that there are not distinct clusters of luminance-
or color-selective receptive ields, but variation of
cone weights naturally yields some cells that are more color selective and others that are less so. Comparable reports of relative cone weights in macaque ganglion cells and LGN cells show relatively well-balanced M and L cone inputs in parafoveal (<15 degrees) receptive
ields with increased variability at higher eccentricities
(Derrington, Krauskopf, & Lennie, 1984; Solomon et al., 2005). Different observations in two species may be reconciled by the fact that spatial pooling of cone inputs at a given eccentricity in marmoset retina is two to three times greater than in macaque retina; for example, ∼50 cones feed to a PC cell center at 20 degrees in marmoset retina, but this level of convergence is only present at 55 degrees in macaque retina. Thus increased cone convergence may lead to greater variability in cone weight.
A further example of variability in PC cell selectivity is shown in Figure 6. Responses of two simultaneously recorded PC cells are shown. The spatial frequency amplitude tuning of these two cells for in-phase modulation of M and L cones (Figure 6A) is indistinguishable; they differ only in response phase (ON vs. OFF) as shown by the PSTH histograms above the tuning curves. Exploration with Ls and Ms gratings reveals, however, a dramatic difference in cone inputs: the L cones contribute to both center and surround of one cell (yielding bandpass tuning) but only to the center of the second cell, which shows lowpass tuning for Ls gratings (Figure 6B). The M cones contribute only weakly to one cell but provide strong inhibitory (surround) input to the second cell (Figure 6C); consistent with the population data shown above (Figure 5) these balanced opponent inputs yield vigorous responses to “red-green” (M – L) modulation (Figure 6D). This example shows directly that expression of M and L cones can generate red-green opponent responses in PC cells without dramatic effects on frequency tuning for luminance modulation.
Color and acuity signals in dichromatic and
trichromatic marmosets
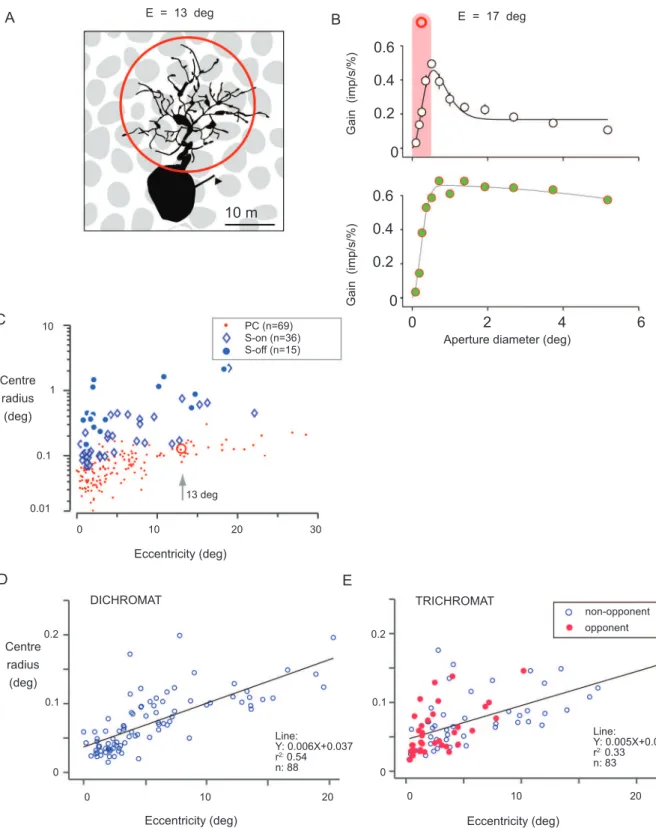
Further lines of evidence for multiplex color and acuity signals in PC pathway cells are assembled in
Figure 7. Dendritic ield diameter of a typical
midget-PC pathway ganglion cell at 13 degrees (example from Figure 3) is close to 0.25 degrees (red circle). This value is consistent with the optimum aperture for low spatial frequency luminance modulation in a typical LGN PC cell (Figure 7B, upper). In other words, the
receptive ield center diameter of PC cells outside the fovea is consistent with the dendritic ield diameter.
Responses of the same LGN PC cell to red-green chromatic modulation (Figure 7B, lower) show that as expected from the examples and population responses in Figures 5 and 6, the red-green response is dependent
on center-surround interactions (Buzás et al., 2006).
the example cell (red circle) in the population of PC cell center sizes. Here the PC cells (measured with achromatic gratings) are compared with blue/yellow opponent cells (blue-ON and blue-OFF, measured with S cone selective gratings) to show the higher resolving
capacity of PC cells (Szmajda et al., 2006). Finally, the
spatial resolving capacity of PC cells in dichromatic and trichromatic marmosets shows heavy overlap (Figure 7D,E), and in trichromatic marmosets the center radius of cells showing red-green opponent responses is indistinguishable from that of cells dominated by a single cone type (Martin et al., 2011; but see also Kilavik, Silveira, & Kremers, 2003). Thus, the PC cells in trichromats carry a red-green signal but show the same spatial acuity for luminance variation as do PC cells in dichromats.
The peripheral puzzle
The foregoing data and analysis show that on comparing dichromatic and trichromatic marmosets, red-green signals appear as an additional response dimension on spatial opponent receptive (center-surround) PC
cell receptive ields. Furthermore, the spatial resolving
capacity of the PC cell array for luminance change is not degraded by the manifestation of red-green opponent responses. The only remaining puzzle in this otherwise consistent “random wiring” model for PC
cell receptive ields is the improbably large proportion
of cells showing red-green opponent responses in peripheral retina of marmoset and macaque monkeys
(Buzás, Szmajda, Hashemi-Nezhad, Dreher, & Martin,
2008; Rodieck, 1991; Solomon et al., 2005; Zrenner & Gouras, 1983). As outlined above, in peripheral retina
Figure 6. Variability in red-green opponent response. Example tuning curves of two simultaneously recorded parvocellular (PC) cells in marmoset lateral geniculate nucleus show. (A) For luminance (L+M) modulation the frequency response of these cells is indistinguishable. They differ only in response phase (PHSTHs at low and optimum spatial frequency, indicated by vertical lines). (B) For L cone selective (Ls) gratings cell 1 (thin red lines, solid symbols) shows lowpass tuning but the cell 2 (thick grey lines, open symbols) shows bandpass tuning indicating input from L cones to center and surround. (C) Responses to M cone selective (Ms) gratings show strong M cone inputs to cell 1 surround but only feeble M cone inputs to cell 2. (D) Cell 1 shows vigorous response to red-green chromatic (M–L) gratings as result of synergistic activation of L excitation and M inhibition. Cell 2 is insensitive to the same stimulus.
purely random convergence of M and L cones to PC cell centers should yield spectral mixing and non-opponent
response properties in the vast majority of PC cells.
One possible explanation is that during development the clonal identities of midget-PC pathway cells in the retina are somehow linked to preserve the pattern of lyonization (X-chromosome inactivation) of M or L cones in the allelic array. Alternatively the correlated changes in activity among M and L cone arrays might produce neuroplastic alteration of retinal connections. However, neither of these possibilities has been tested,
and ine-scale studies of retina anatomy have as yet
revealed no sign of selective connections in the midget-PC pathway (Dacey, 1993; Goodchild et al., 1996; Jusuf et al., 2006b; Yamada, Silveira, & Perry, 1996).
Conclusion and further directions
The data support a model of color signal processing where signals from blue cones are transferred mainly through the evolutionary ancient part of the visual system called the koniocellular pathway. Red-green color signals by contrast appear as an extra response dimension of the parvocellular pathway, which likely evolved to signal
ine image details. Although the role of the magnocellular
pathway in setting the limits of spatial vision at low
contrast is established, the ubiquitous presence and ine
resolving capacity of the PC cell array in dichromatic marmosets (and, as far as can be determined, dichromatic humans) is de facto proof for a role of PC cells in spatial vision. Because the parvocellular and koniocellular pathways show distinct patterns of connections within the brain, an outstanding question is where and how the input signals are recombined to yield coherent color perception.
A
L + M
150
imp s
-1
SF (cpd) SF (cpd) SF (cpd) 0
60
40
20
0
L
L M
LS
MS
M
L – M
M
L
B C D
Figure 7. Spatial acuity of color opponent cells in marmosets. (A) Example of midget-parvocellular pathway (PC) cell in marmoset peripheral retina. The red circle encompasses the dendritic ield. (B) Aperture tuning curves for luminance (upper panel) and red-green modulation (lower panel) recorded from a PC cell in marmoset LGN. The shaded red bar shows diameter of the red circle from panel A, indicating the optimum aperture (receptive ield center) is similar to the dendritic ield diameter at similar eccentricity. Responses to red-green modulation are restricted to apertures where both center and surround are recruited. (C) Receptive ield size recovered from spatial frequency tuning curves. In comparison to blue-ON and blue-OFF cells, PC cells have relatively small receptive ields. The red circle indicates the radius of a typical midget-PC pathway dendritic tree at 13 deg. (D,E) Comparison of receptive ield radius of PC cells measured with achromatic or luminance (L+M) gratings. There is heavy overlap between PC cell acuity in dichromats and trichromats and between opponent and non-opponent cells in trichromats. Panel C modiied from Szmajda et al. (2006). Panels D and E modiied from Martin et al. (2011).
A B
C
D E
Centre radius (deg)
Centre radius (deg)
10 PC (n=69)
S-on (n=36) S-off (n=15)
13 deg 1
0.1
0.2 0.2
0.1 0.1
0 0
0.01
0 10 20 30
0 10 20 0 10 20
Eccentricity (deg) E = 13 deg
10 m
E = 17 deg
0 2 4 6
Aperture diameter (deg)
0.6
0.4
0.2
0 0.6
0.4
0.2
0
Gain (imp/s/%)
Gain (imp/s/%)
DICHROMAT TRICHROMAT
non-opponent
Line:
Y: 0.005X+0.046 r2: 0.33 n: 83 Line:
Y: 0.006X+0.037 r2: 0.54 n: 88
opponent
Likewise, the question how signals from the PC cell array are disentangled to yield information about red-green
color difference as well as ine spatial detail has not been
solved. Comparative functional analysis of cortical visual pathways in primates may in the future contribute to this big challenge for understanding color vision.
Acknowledgements
Work in the authors’ laboratories is supported by Australian NHMRC grants 1027913/632640 and Australian Research Council grant CE0561903. We
thank E.M. Blessing, P. Buzás, P.R. Jusuf, S.C. Lee, C. Puller, S.G. Solomon, B.A. Szmajda and C. Tailby
for contributing to the experiments and publications summarized here.
References
Ahmad, A., & Spear, P. D. (1993). Effects of aging on the size, density, and number of rhesus monkey lateral geniculate neurons. Journal
of Comparative Neurology, 334, 631-643.
Blessing, E. M., Solomon, S. G., Hashemi-Nezhad, M., Morris, B. J., & Martin, P. R. (2004). Chromatic and spatial properties of parvocellular cells in the lateral geniculate nucleus of the marmoset
(Callithrix jacchus). Journal of Physiology, 557, 229-245.
Boycott, B. B., & Hopkins, J. M. (1991). Cone bipolar cells and cone synapses in the primate retina. Visual Neuroscience, 7, 49-60. Boycott, B. B., & Hopkins, J. M. (1993). Cone synapses of a lat diffuse
cone bipolar cell in the primate retina. Journal of Neurocytology,
22, 765-778.
Boycott, B. B., & Wässle, H. (1991). Morphological classiication of bipolar cells of the primate retina. European Journal of
Neuroscience, 3, 1069-1088.
Buzás, P., Blessing, E. M., Szmajda, B. A., & Martin, P. R. (2006). Speciicity of M and L cone inputs to receptive ields in the parvocellular pathway: Random wiring with functional bias.
Journal of Neuroscience, 26(43), 11148-11161.
Buzás, P., Szmajda, B. A., Hashemi-Nezhad, M., Dreher, B., & Martin, P. R. (2008). Color signals in the primary visual cortex of marmosets. Journal of Vision, 8(10), 1-16.
Calkins, D. J., Tsukamoto, Y., & Sterling, P. (1996). Foveal cones form basal as well as invaginating junctions with diffuse ON bipolar cells. Vision Research, 36, 3373-3381.
Calkins, D. J., Tsukamoto, Y., & Sterling, P. (1998). Microcircuitry and mosaic of a blue-yellow ganglion cell in the primate retina.
Journal of Neuroscience, 18, 3373-3385.
Casagrande, V. A., & Norton, T. T. (1991). Lateral geniculate nucleus: A review of its physiology and function. In A. G. Leventhal (Ed.),
The neural basis of visual function (pp. 41-84). Macmillan Press.
Chan, T. L., Martin, P. R., Clunas, N., & Grünert, U. (2001). Bipolar cell diversity in the primate retina: Morphologic and immunocytochemical analysis of a New World monkey, the marmoset Callithrix jacchus.Journal of Comparative Neurology,
437, 219-239.
Chen, S., & Li, W. (2012). A color-coding amacrine cell may provide a blue-off signal in a mammalian retina. Nature Neuroscience, 15(7), 954-956.
Chichilnisky, E. J., & Baylor, D. A. (1999). Receptive-ield microstructure of blue-yellow ganglion cells in primate retina.
Nature Neuroscience, 2, 889-893.
Chun, M.-H., Grünert, U., Martin, P. R., & Wässle, H. (1996). The synaptic complex of cones in the fovea and in the periphery of the macaque monkey retina. Vision Research, 36, 3383-3395. Connolly, M., & Van Essen, D. (1984). The representation of the
visual ield in parvicellular and magnocellular layers of the lateral geniculate nucleus in the macaque monkey. Journal of Comparative
Neurology, 226, 544-564.
Conway, B. R., Chatterjee, S., Field, G. D., Horwitz, G. D., Johnson, E. N., Koida, K. et al. (2010). Advances in color science: From retina to behavior. Journal of Neuroscience, 30(45), 14955-14963.
Crook, J. D., Davenport, C. M., Peterson, B. B., Packer, O. S., Detwiler, P. B., & Dacey, D. M. (2009). Parallel ON and OFF cone bipolar inputs establish spatially coextensive receptive ield structure of blue-yellow ganglion cells in primate retina. Journal of
Neuroscience, 29(26), 8372-8387.
Crook, J. D., Manookin, M. B., Packer, O. S., & Dacey, D. M. (2011). Horizontal cell feedback without cone type-selective inhibition mediates “red-green” color opponency in midget ganglion cells of the primate retina. Journal of Neuroscience, 31(5), 1762-1772. Dacey, D. M. (1993). The mosaic of midget ganglion cells in the
human retina. Journal of Neuroscience, 13, 5334-5355.
Dacey, D. M. (1999). Primate retina: Cell types, circuits and color opponency. Progress in Retinal Research, 18, 737-763.
Dacey, D. M., & Lee, B. B. (1994). The ‘blue-on’ opponent pathway in primate retina originates from a distinct bistratiied ganglion cell type. Nature, 367, 731-735.
Dacey, D. M., & Packer, O. S. (2003). Colour coding in the primate retina: Diverse cell types and cone-speciic circuitry. Current
Opinion in Neurobiology, 13, 421-427.
Dacey, D. M., Peterson, B. B., Robinson, F. R., & Gamlin, P. D. (2003). Fireworks in the primate retina: In vitro photodynamics reveals diverse LGN-projecting ganglion cell types. Neuron, 37, 15-27.
Derrington, A. M., Krauskopf, J., & Lennie, P. (1984). Chromatic mechanisms in lateral geniculate nucleus of macaque. Journal of
Physiology, 357, 241-265.
Diller, L., Packer, O. S., Verweij, J., McMahon, M. J., Williams, D. R., & Dacey, D. M. (2004). L and M cone contributions to the midget and parasol ganglion cell receptive ields of macaque monkey retina. Journal of Neuroscience, 24, 1079-1088.
Dreher, B., Fukada, Y., & Rodieck, R. W. (1976). Identiication, classiication and anatomical segregation of cells with X-like and Y-like properties in the lateral geniculate nucleus of Old-World primates. Journal of Physiology, 258, 433-452.
Field, G. D., & Chichilnisky, E. J. (2007). Information processing in the primate retina: Circuitry and coding. Annual Review of
Neuroscience,30, 1-30.
Field, G. D., Gauthier, J. L., Sher, A., Greschner, M., Machado, T. A., Jepson, L. H. et al. (2010). Functional connectivity in the retina at the resolution of photoreceptors. Nature, 467(7316), 673-677. Field, G. D., Sher, A., Gauthier, J. L., Greschner, M., Shlens, J., Litke,
A. M., et al. (2007). Spatial properties and functional organization of small bistratiied ganglion cells in primate retina. Journal of
Neuroscience, 27(48), 13261-13272.
Gegenfurtner, K. (2003). Cortical mechanisms of colour vision.
Nature Reviews Neuroscience, 4, 563-572.
Ghosh, K. K., Martin, P. R., & Grünert, U. (1997). Morphological analysis of the blue cone pathway in the retina of a New World monkey, the marmoset Callithrix jacchus. Journal of Comparative
Neurology, 379, 211-225.
Goodchild, A. K., Ghosh, K. K., & Martin, P. R. (1996). Comparison of photoreceptor spatial density and ganglion cell morphology in the retina of human, macaque monkey, cat, and the marmoset
Callithrix jacchus. Journal of Comparative Neurology, 366,
55-75.
Haverkamp, S., Grünert, U., & Wässle, H. (2000). The cone pedicle, a complex synapse in the retina. Neuron, 27, 85-95.
Haverkamp, S., Grünert, U., & Wässle, H. (2001). The synaptic architecture of AMPA receptors at the cone pedicle of the primate retina. Journal of Neuroscience, 21, 2488-2500.
Herr, S., Klug, K. J., Sterling, P., & Schein, S. J. (2003). Inner S-cone bipolar cells provide all of the central elements for S cones in macaque retina. Journal of Comparative Neurology, 457, 185-201. Hopkins, J. M., & Boycott, B. B. (1997). The cone synapses of cone
bipolar cells of primate retina. Journal of Neurocytology, 26, 313-325.
Ingling, C. R., & Martinez, E. (1985). The spatio-temporal properties of the r-g cell channel. Vision Research, 18, 379-390.
Jacobs, G. H. (1993). The distribution and nature of colour vision among the mammals. Biological Reviews, 68, 413-471.
Joo, H. R., Peterson, B. B., Haun, T. J., & Dacey, D. M. (2011). Characterization of a novel large-ield cone bipolar cell type in the primate retina: Evidence for selective cone connections. Visual
Jusuf, P. R., Martin, P. R., & Grünert, U. (2006a). Synaptic connectivity in the midget-parvocellular pathway of primate retina. Journal of
Comparative Neurology, 494, 260-274.
Jusuf, P. R., Martin, P. R., & Grünert, U. (2006b). Random wiring in the midget pathway of primate retina. Journal of Neuroscience,
26(15), 3908-3917.
Kaplan, E., Purpura, K., & Shapley, R. M. (1987). Contrast affects the transmission of visual information through the mammalian lateral geniculate nucleus. Journal of Physiology, 391, 267-288.
Kilavik, B. E., Silveira, L. C. L., & Kremers, J. (2003). Centre and surround responses of marmoset lateral geniculate neurones at different temporal frequencies. Journal of Physiology, 546, 903-919.
Klug, K., Herr, S., Ngo, I. T., Sterling, P., & Schein, S. (2003). Macaque retina contains an S-cone OFF midget pathway. Journal
of Neuroscience, 23, 9881-9887.
Kolb, H. (1970). Organization of the outer plexiform layer of the primate retina: Electron microscopy of Golgi-impregnated cells.
Philosophical Transactions of the Royal Society of London (B),
258, 261-283.
Kolb, H., Goede, P., Roberts, S., McDermott, R., & Gouras, P. (1997). Uniqueness of the S-cone pedicle in the human retina and consequences for color processing. Journal of Comparative
Neurology, 386, 443-460.
Kolb, H., Linberg, K. A., & Fisher, S. K. (1992). Neurons of the human retina: A Golgi study. Journal of Comparative Neurology,
318, 147-187.
Kouyama, N., & Marshak, D. W. (1992). Bipolar cells speciic for blue cones in the macaque retina. Journal of Neuroscience, 12, 1233-1252.
Kouyama, N., & Marshak, D. W. (1997). The topographical relationship between two neuronal mosaics in the short wavelength-sensitive system of primate retina. Visual Neuroscience, 14, 159-167. Kremers, J., Weiss, S., & Zrenner, E. (1997). Temporal properties of
marmoset lateral geniculate cells. Vision Research, 37, 2649-2660. Kremers, J., Zrenner, E., Weiss, S., & Meierkord, S. (1998). Chromatic
processing in the lateral geniculate nucleus of the common marmoset (Callithrix jacchus). In W. Backaus, R. Kliegl, & J. S. Werner (Eds.), Color vision–perspectives from different disciplines
(pp. 89-99). Berlin: Walter de Gruyter & Co.
Lee, B. B. (1996). Receptive ield structure in the primate retina.
Vision Research, 36, 631-644.
Lee, B. B., Martin, P. R., & Grünert, U. (2010). Retinal connectivity and primate vision (review). Progress in Retinal and Eye Research,
29(6), 622-639.
Lee, B. B., Virsu, V., & Elepfandt, A. (1983). Cell responses in dorsal layers of macaque lateral geniculate nucleus as a function of intensity and wavelength. Journal of Neurophysiology, 50, 849-863.
Lee, S. C. S., & Grünert, U. (2007). Connections of diffuse bipolar cells in primate retina are biased against S-cones. Journal of
Comparative Neurology, 502(1), 126-140.
Lee, S. C. S., Jusuf, P. R., & Grünert, U. (2004). S-cone connections of the diffuse bipolar cell type DB6 in macaque monkey retina.
Journal of Comparative Neurology, 474, 353-363.
Lee, S. C. S., Telkes, I., & Grünert, U. (2005). S-cones do not contribute to the OFF-midget pathway in the retina of the marmoset, Callithrix
jacchus.European Journal of Neuroscience, 22, 437-447.
Lennie, P., Haake, P. W., & Williams, D. R. (1991). The design of chromatically opponent receptive ields. In M. S. Landy & J. A. Movshon (Eds.), Computational models of visual processing (pp. 71-82). Cambridge, MA: MIT Press.
Leventhal, A. G., Rodieck, R. W., & Dreher, B. (1981). Retinal ganglion cell classes in the Old World monkey: Morphology and central projections. Science, 213, 1139-1142.
Luo, X., Ghosh, K. K., Martin, P. R., & Grünert, U. (1999). Analysis of two types of cone bipolar cells in the retina of a New World monkey, the marmoset, Callithrix jacchus. Visual Neuroscience,
16, 707-719.
Martin, P. R., Blessing, E. M., Buzás, P., Szmajda, B. A., & Forte, J. D. (2011). Transmission of colour and acuity signals by parvocellular cells in marmoset monkeys. Journal of Physiology, 589(Pt 11), 2795-2812.
Martin, P. R., White, A. J. R., Goodchild, A. K., Wilder, H. D., & Sefton, A. E. (1997). Evidence that blue-on cells are part of the third geniculocortical pathway in primates. European Journal of
Neuroscience, 9, 1536-1541.
Mollon, J. D. (1991). Uses and evolutionary origins of primate colour vision. In J. R. Cronly-Dillon & R. L. Gregory (Eds.), Evolution of
the eye and visual system (Cronly-Dillon, S.R. ed., pp. 306-319).
London: MacMillan.
Nathans, J. (1999). The evolution and physiology of human color vision: Insights from molecular genetic studies of visual pigments.
Neuron, 24, 299-312.
Neitz, J., & Neitz, M. (2011). The genetics of normal and defective color vision. Vision Research, 51(7), 633-651.
Nelson, R., & Kolb, H. (2003). ON and OFF pathways in the vertebrate retina and visual system. In L. M. Chalupa & J. S. Werner (Eds.),
The visual neurosciences (pp. 260-278). Cambridge, MA: MIT
Press.
Nomura, A., Shigemoto, R., Nakamura, Y., Okamoto, N., Mizuno, N., & Nakanishi, S. (1994). Developmentally regulated postsynaptic localization of a metabotropic glutamate receptor in rat rod bipolar cells. Cell, 77, 361-369.
Paulus, W., & Kröger-Paulus, A. (1983). A new concept of retinal colour coding. Vision Research, 23, 529-540.
Perry, V. H., Oehler, R., & Cowey, A. (1984). Retinal ganglion cells that project to the dorsal lateral geniculate nucleus in the macaque monkey. Neuroscience, 12, 1101-1123.
Puller, C., Haverkamp, S., & Grünert, U. (2007). OFF midget bipolar cells in the retina of the marmoset, Callithrix jacchus, express AMPA receptors. Journal of Comparative Neurology, 502, 442-554.
Puthussery, T., Gayet-Primo, J., Taylor, W. R., & Haverkamp, S. (2011). Immunohistochemical identiication and synaptic inputs to the diffuse bipolar cell type DB1 in macaque retina. Journal of
Comparative Neurology, 519(18), 3640-3656.
Rodieck, R. W. (1991). Which cells code for color? In A. Valberg & B. B. Lee (Eds.), From pigments to perception: advances in
understanding visual processes (pp. 83-93). London: Plenum Press.
Rodieck, R. W., & Watanabe, M. (1993). Survey of the morphology of macaque retinal ganglion cells that project to the pretectum, superior colliculus, and parvicellular laminae of the lateral geniculate nucleus. Journal of Comparative Neurology, 338, 289-303.
Roy, S., Martin, P. R., Dreher, B., Saalmann, Y. B., Hu, D., & Vidyasagar, T. R. (2009). Segregation of short-wavelength sensitive (S) cone signals in the macaque dorsal lateral geniculate nucleus.
European Journal of Neuroscience, 30, 1517-1526.
Schein, S., Sterling, P., Ngo, I. T., Huang, T. M., & Herr, S. (2004). Evidence that each S cone in macaque fovea drives one narrow-ield and several wide-narrow-ield blue-yellow ganglion cells. Journal of
Neuroscience, 24, 8366-8378.
Schiller, P. H., & Malpeli, J. G. (1978). Functional speciicity of lateral geniculate nucleus laminae of the rhesus monkey. Journal of
Neurophysiology, 41, 788-797.
Shapley, R., & Hawken, M. J. (2011). Color in the cortex: Single- and double-opponent cells. Vision Research, 51(7), 701-717.
Shapley, R., & Perry, V. H. (1986). Cat and monkey retinal ganglion cells and their visual functional roles. Trends in Neurosciences, 9, 229-235.
Sherman, S. M., & Guillery, R. W. (2006). Exploring the thalamus
and its role in cortical function (2nd ed.). Cambridge: MIT Press.
Silveira, L. C. L., Grünert, U., Kremers, J., Lee, B. B., & Martin, P. R. (2005). Comparative anatomy and physiology of the primate retina. In J. Kremers (Ed.), The primate visual system: A comparative
approach (pp. 127-160). Hoboken, NJ: John Wiley and Sons, Ltd.
Silveira, L. C. L., Lee, B. B., Yamada, E. S., Kremers, J., & Hunt, D. M. (1998). Post-receptoral mechanisms of colour vision in New World primates. Vision Research, 38, 3329-3337.
Silveira, L. C. L., Saito, C. A., Lee, B. B., Kremers, J., daSilvaFilho, M., Kilavik, B. E. et al. (2004). Morphology and physiology of primate M- and P-cells. Progress in Brain Research, 144, 21-46. Solomon, S. G., Lee, B. B., White, A. J., Rüttiger, L., & Martin, P.
Szmajda, B. A., Buzás, P., FitzGibbon, T., & Martin, P. R. (2006). Geniculocortical relay of blue-off signals in the primate visual system. Proceedings of the National Academy of Sciences of the
United States of America, 103, 19512-19517.
Szmajda, B. A., Martin, P. R., & Grünert, U. (2008). Retinal ganglion cell inputs to the koniocellular pathway. Journal of Comparative
Neurology, 510(3), 251-268.
Tailby, C., Dobbie, W. J., Hashemi-Nezhad, M., Forte, J. D., & Martin, P. R. (2010). Receptive ield asymmetries produce color-dependent direction selectivity in primate lateral geniculate nucleus. Journal
of Vision, 10(8), 1-18.
Tailby, C., Solomon, S. G., & Lennie, P. (2008a). Functional asymmetries in visual pathways carrying S-cone signals in macaque. Journal of Neuroscience, 28(15), 4078-4087.
Tailby, C., Szmajda, B. A., Buzás, P., Lee, B. B., & Martin, P. R. (2008b). Transmission of blue (S) cone signals through the primate lateral geniculate nucleus. Journal of Physiology, 586(Pt 24), 5947-5967.
Telkes, I., Lee, S. C., Jusuf, P. R., & Grünert, U. (2008). The midget-parvocellular pathway of marmoset retina: A quantitative light microscopic study. Journal of Comparative Neurology, 510(5), 539-549.
Tovée, M. J., Bowmaker, J. K., & Mollon, J. D. (1992). The relationship between cone pigments and behavioural sensitivity in a New World monkey (Callithrix jacchus jacchus). Vision Research,
32, 867-878.
Travis, D. S., Bowmaker, J. K., & Mollon, J. D. (1988). Polymorphism of visual pigments in a callitrichid monkey. Vision Research, 28, 481-490.
Vardi, N., Duvoisin, R., Wu, G., & Sterling, P. (2000). Localization of mGluR6 to dendrites of ON bipolar cells in primate retina. Journal
of Comparative Neurology, 423(3), 402-412.
Wässle, H. (2004). Parallel processing in the mammalian retina.
Nature Reviews Neuroscience, 5(10), 747-757.
Wässle, H., & Boycott, B. B. (1991). Functional architecture of the mammalian retina. Physiological Reviews, 71, 447-480.
Wässle, H., Grünert, U., Martin, P. R., & Boycott, B. B. (1994). Immunocytochemical characterization and spatial distribution
of midget bipolar cells in the macaque monkey retina. Vision
Research, 34, 561-579.
White, A. J. R., Goodchild, A. K., Wilder, H. D., Sefton, A. E., & Martin, P. R. (1998). Segregation of receptive ield properties in the lateral geniculate nucleus of a New-World monkey, the marmoset
Callithrix jacchus. Journal of Neurophysiology, 80, 2063-2076.
Wiesel, T. N., & Hubel, D. (1966). Spatial and chromatic interactions in the lateral geniculate body of the rhesus monkey. Journal of
Neurophysiology, 29, 1115-1156.
Williams, A. J., Hunt, D. M., Bowmaker, J. K., & Mollon, J. D. (1992). The polymorphic photopigments of the marmoset: Spectral tuning and genetic basis. EMBO Journal, 11, 2039-2045.
Yamada, E. S., Silveira, L. C. L., Gomes, F. L., & Lee, B. B. (1996). The retinal ganglion cell classes of New World primates. Revista
Brasileira de Biologia, 56, 381-396.
Yamada, E. S., Silveira, L. C. L., & Perry, V. H. (1996). Morphology, dendritic ield size, somal size, density, and coverage of M and P retinal ganglion cells of dichromatic Cebus monkeys. Visual
Neuroscience, 13, 1011-1029.
Zrenner, E., & Gouras, P. (1983). Cone opponency in tonic ganglion cells and its variation with eccentricity in rhesus monkey retina. In J. D. Mollon & L. T. Sharpe (Eds.), Colour vision: Physiology and
psychophysics. (pp. 211-223). London: Academic Press.
Abbreviations
AMPA: α-amino-3-hydroxy-5-methyl-4-isoxazolepropionic acid S: short wavelength sensitive (“blue”)
M: medium wavelength sensitive (“green”) L: long wavelength sensitive (“red”) ML: medium/long wavelength sensitive LGN: lateral geniculate nucleus PC: parvocellular
MC: magnocellular K: koniocellular