Functional vision barriers: a new concept analyzed in terms
of human visual performance
Elisa M. Colombo, Beatriz M. O’Donell, Javier E. Santillán, and Luis A. Issolio
Universidad Nacional de Tucumán, San Miguel de Tucumán, TU, Argentina
Abstract
In this work we introduce a new category of barriers that we call “functional vision barriers.” This expression refers to lighting and visual elements that may complicate or hinder functional vision and may make life even more difficult for people with visual defects. These barriers appear as a consequence of certain negative effects caused by the poor design of the visual stimulus or visual environment that surrounds it in which lighting is one of the main factors. We use the term “functional vision” because this expression refers to the ability of the visual system to perform everyday tasks. We analyzed some of our previous results with regard to situations that can be considered “functional vision barriers”: (1) stimuli with low luminance contrast information in which the addition of chromatic contrast improves visual performance and (2) tasks that are performed in the presence of a glare source in the visual field, diminishing visual performance and reducing brightness perception. Keywords: functional vision, visual performance, brightness constancy, glare, color.
Received 11 July 2012; received in revised form 27 November 2012; accepted 20 December 2012. Available online 18 November 2013.
Elisa M. Colombo, Beatriz M. O’Donell, Javier E. Santillán, and Luis A. Issolio, Dpto. de Luminotecnia, Luz y Visión, Facultad de Ciencias Exactas y Tecnología, Universidad Nacional de Tucumán, Argentina, Instituto de Investigación en Luz, Ambiente y Visión, CONICET- UNT, Argentina. Correspondence regarding this article should be directed to: Elisa M. Colombo, Av. Independencia 1800 (4000) San Miguel de Tucumán, Tucumán, Argentina. Phone: 54 381 4361936. E-mail: [email protected]
Introduction
Lighting is an interdisciplinary ield that requires
the integration of knowledge from several different disciplines such as engineering, physics, psychology, and physiology. As an essential component of the environment, light permits visual perception which, in
turn, inluences human activity, improving or affecting
visual performance. Psychophysics has made important contributions to lighting design by providing standards and recommendations (Di Laura, 2011; Deutsches Institut Fur Normung, 2007).
The quality of a lighted environment is determined by how this ambience allows for activities based on visual perception and how it affects it. Relevant research requires the analysis of stimulus characteristics together with the visual environment to prevent or minimize any condition that results from interactions between light and the elements of the visual scene that could affect functional vision. Functional vision (Ginsburg, 2003) refers to the ability of the visual system to perform everyday tasks when faced with stimuli under suprathreshold conditions. Different visual tasks in our everyday lives use different capabilities of our visual
system. A person may be classiied as suffering from
a disability because of his inability to act in the world as it is designed today (Caplan, 1992). This has led to the introduction of the concept of “barriers,” regardless
of the origin of the deicits presented by the individual,
which can be sensorial, motor, or both.
In this work we introduce a new category of barriers that we call “functional vision barriers.” This expression refers to lighting design and visual elements produced by poor design, a visual stimulus, or the visual environment that surrounds it that complicate or hinder
functional vision and may make life even more dificult
for people with visual defects.
Statistics from the United Nations Population Ageing and Development Population Division, Department of Economic and Social Affairs, show that the average life expectancy will steadily increase in the coming decades (www.un.org; accessed June 16, 2013), which could mean an increase in the number of individuals who have
dificulty adapting to and acting in an artiicially lighted
environment. This makes the study of functional vision barriers a relevant issue (Kashara, Okabe, Nakasato, & Ohno, 2007; Turano, Broman, Bandeen-Roche, Munoz, Rubin, & West, 2004; Lord, 2006; Harwood, 2001).
al., 2010). Our previous works identiied the following
examples of functional vision barriers: stimuli with low luminance contrast (O’Donell, Barraza, & Colombo, 2010; O’Donell, Colombo, & Boyce, 2011b), the presence of a glare source presented at the foveal and peripheral visual
ields under mesopic adaptation (Issolio & Colombo, 2006;
Aguirre, Colombo, & Barraza, 2008; Aguirre, Barraza, & Colombo, 2011), transitional spaces with high luminance variations (Lasagno, Pattini, Rodríguez, & Colombo, 2011), and illuminated spaces where luminous radiation
exhibits visible or non-visible licker (Jaen, Colombo, &
Kirschbaum, 2011). Based on these published results, we present only three of these cited studies: (1) stimuli with low luminance contrast information in which the addition of chromatic contrast improves visual performance (O’Donell et al., 2010, 2011b), (2) tasks foveally or peripherally presented in the presence of a glare source in
the visual ield that reduce visual performance (Aguirre et
al., 2008, 2011), and (3) instances in which the presence of a peripheral glare source reduces brightness perception
(Issolio & Colombo, 2006). The irst and second examples
consist of measures of visual performance determined by the reaction time (RT) paradigm, and the third example consists of another approximation based on the comparison of brightness perception.
With the presentation of these cases, the following sections will attempt to establish the logical nexus between vision research and lighting practices to establish a link between visual psychophysics results and their application to interior and exterior lighting designs. In addition to providing examples of functional vision barriers, we present possible ways of overcoming them.
Improving visual performance with color
Stimuli with low contrast in a scenario in which a person must perform a task constitute real functional vision barriers or impediments to the task to be performed. Adding chromatic information may improve this situation.Color plays an important role in the way visual information is processed, improving visual performance when the luminance contrast is equal to zero or detecting the stimulus against the background when luminance
contrast is insuficient. Although situations in which luminance contrast is near zero are rare in the ofice setting
(Dillon, Passini, & Rea, 1987), they do occur in industrial manufacturing and inspection or emergency lighting (Eklund, 1999). A reduction of the effective luminance contrast may also occur because of the presence of a glare source (glare will be discussed in the following section).
Reaction time provides a means of assessing the effectiveness of suprathreshold stimulus variables such as luminance and chromatic contrast (Plainis & Murray, 2000; McKeefry, Parry, & Murray, 2003; O’Donell & Colombo, 2008; O’Donell et al., 2010), size (Rea & Ouellette, 1988; Diaz et al., 2001; Parry, Plainis, Murray, & McKeefry, 2004), adaptation luminance (Rea & Ouellette 1988), eccentricity (Parry et al., 2004;
Aguirre et al., 2011), and contrast polarity and glare (Aguirre et al., 2008; Lingard & Rea, 2002).
Rea & Ouellette (1988) used simple RTs and developed a quantitative model of relative visual performance (RVP) expressed as percentage as a function of luminance contrast, size, and retinal illuminance. These authors showed that RVP improves with increases in target size, luminance contrast, and retinal illuminance. These results provided the basis for recommendations on the optimal conditions that a stimulus should have to be detected as quickly as possible (Di Laura, 2011).
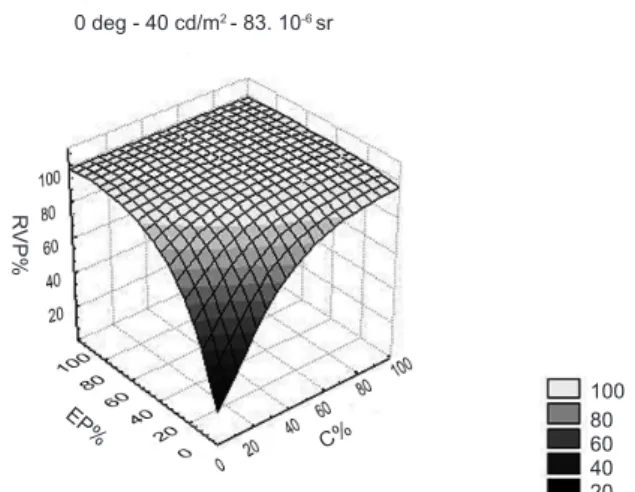
O’Donell et al. (2010) developed a similar model that includes stimuli for different chromaticities (reddish, 0 degrees; greenish-blue, 180 degrees; violet, 90 degrees; lime, 270 degrees; magenta, 53 degrees; greenish-yellow, 233 degrees; orange, 310 degrees). The different chromaticities are expressed as the angular azimuth in degrees in the MBDKL color space (MacLeod & Boynton, 1979; for experimental details, see O’Donell et al., 2010). These works were performed for different sizes (0.129, 0.258, 0.522, and 1.045 degrees), background luminance (5 and 40 cd/ m2), and luminance contrast (from isoluminance up to
±40%). From this model, we can conclude that when the luminance contrast is small, visual performance is determined by the chromaticity of the stimulus. If this color information is unavailable, then RVP% would tend to be zero. At the other end of the luminance contrast range, RVP% reaches values close to 100% regardless of the chromaticity of the stimulus. Figure 1 only shows one possible case (i.e., stimuli with a reddish appearance, 40 cd/m2, and 83 µstr size), but
the tendency is similar in all of the cases considered in which RVP improves by increasing both the luminance contrast and excitation purity (O’Donell et al., 2010).
Figure 1. Relative Visual PerformanceRVP %as a function of Weber luminance contrastC %and excitation purityEP %for the stimulus of 0 deg (reddish appearance). Stimulus size of 83 msr, background luminance of 40 cd/m2 and one observer (BO). This curve shows a similar pattern for other observers, chromatic direction, size and background luminance. (Figure taken from O’Donell et al., 2011) 99 x 99 mm (300 x 300 DPI).
0 deg - 40 cd/m2 - 83. 10-6 sr
100 80 60 40 20
R
VP%
EP%
The shape of visual performance is commonly described as a plateau and an escarpment (Boyce & Rea, 1987). Because the change from a plateau to an escarpment is not abrupt and because where this
division occurs has not been formally identiied,
ascertaining which minimum RVP value is considered acceptable becomes necessary. In this case, we adopted
RVP% convention values ≥90% (P. Boyce, personal
communication, May 17, 2010) near the escarpment. These RVP values depend on the combined effect of the luminance and chromatic information available for each chromatic axis.
According to this criterion, O’Donell et al. (2011b)
determined the minimum excitation purity (x,y) deined
on the CIE 1931 chromaticity diagram that is required to
achieve a visual performance value ≥90%.
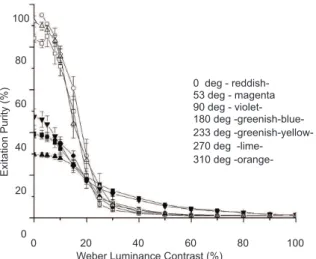
Figure 2 compares the relationship between excitation purity and luminance contrast along different
chromatic axes to obtain an RVP ≥90%. Each point
represents the mean for all observers, stimulus sizes, and background luminance. Figure 2 shows a similar qualitative pattern for all of the chromatic axes with regard to luminance contrast.
Figure 2. Combinations of excitation purity and luminance contrast to achieve an RVP of 90% for each chromatic direction. Each point represents the mean for all observers, sizes of the stimuli and background luminance. 99 x 99 mm (300 x 300 DPI).
Functional vision barriers that result from a chromatic stimulus with low contrast can be minimized, improving the performance of the visual task by modifying the luminance contrast of the stimulus, its chromaticity, or both, reaching values as high as 90%.
If the luminance contrast is low (<20%), then a high RVP value can be achieved with a mean excitation purity of ∼30% for stimuli with a reddish, magenta, violet, and blue appearance and >80% for lime, greenish-yellow, and orange. Stimuli with higher mean excitation purity are required to reach the same RVP level because these chromatic axes correspond to perceptually less saturated stimuli.
If the luminance contrast is >60%, then information about the color is no longer relevant to detect a stimulus, and RVP is determined by the luminance information alone for a given size and background luminance. At the intermediate range, only excitation purity of 10% is necessary to improve RVP for all chromatic axes.
The results of a similar experiment (O’Donell, Bonci, Oliveira, Ventura, & Colombo, 2011a) showed how this
functional barrier affects subjects with color deiciencies.
The relationship between RT values with excitation purity is reversed compared with normal observers. Reaction times along deutan or protan confusion lines shift toward higher excitation purity because of higher discrimination threshold values. According to these results, the recommended values would be greater than those that correspond to normal subjects.
Glare reduces visual performance and
brightness perception
In this section we present another case of a functional vision barrier, which is the effect of glare. A good lighting design should avoid the presence of
strong sources of light in the visual ield because a glaring effect negatively inluences visual performance.
Research on the effects of glare becomes interesting because of its relevance in tasks such as driving at night (Sturgis & Osgood, 1982; Olson & Sivak, 1984).
One of the most important types of studies on the effect
of bright light in a visual ield quantiies the reduction of
visibility in terms of an equivalent veiling luminance (Lv) that produces the same masking effect as scattered light in the ocular media (for review, see Vos, 1984):
Lv = 10 EG 1°< θ < 30° (1) θ2
EG is the illuminance on the eye produced by a
peripheral glare source at an angle θ with respect to
the line of vision. A complete equation was published by the Commission Internationale de l´Eclairage by considering the effect of age, ocular pigmentation, and a complete range of angles (Commission Internationale de l´Eclairage, 2002).
The reduction of contrast that is produced by glare depends on the ratio between the veiling luminance Lv and background luminance Lb:
+
=
b v r
L
L
C
C
1
(2)
C is the physical contrast, and Cr is the contrast diminished by the effect of veiling luminance.
Glare reduces visual performance
Several authors have studied visual mechanisms by measuring the RT to sinusoidal gratings for a wide range 0 deg -
reddish-53 deg - magenta 90 deg - violet-180 deg -greenish-blue-233 deg -greenish-yellow-270 deg
-lime-310 deg
-orange-0 2-orange-0 4-orange-0 6-orange-0 8-orange-0 1-orange-0-orange-0 Weber Luminance Contrast (%)
100
80
60
40
20
0
of spatial frequencies, contrast (Harwerth & Levi, 1978; Murray & Plainis, 2003), and adaptation luminance (Plainis & Murray, 2000; Walkey, Harlow, & Barbur, 2006). These studies showed that RT increases linearly when it is plotted against the reciprocal of contrast (Plainis & Murray, 2000), and this can be modeled using the well-known Pièron equation:
RT
=
RT
0
+
k
1
C
(3)
C is the contrast, k is the slope, and RT0 is the irreducible minimum RT that can be reached in a given condition. The slope is a measure of contrast gain, and a larger spatial frequency or smaller luminance is associated with a larger slope (Murray & Plainis, 2003; Plainis & Murray, 2000).
We performed experiments with horizontal achromatic sinusoidal gratings (1, 2, 4, and 8 c/deg), with a Michelson contrast range from 0.02 to 0.5. The mean luminance of the stimulus and surround was 0.14 cd/m2. The stimulus was viewed in a circular patch that
subtended 6.7 deg at a distance of 1.5 m foveally (0 deg) for different eccentricities (0, 7, 14, and 23 deg). The glare source was located 10 deg away from the line of sight at the same height as the stimulus. Glare intensity was 15 and 60 lux (for details, see Aguirre et al., 2008).
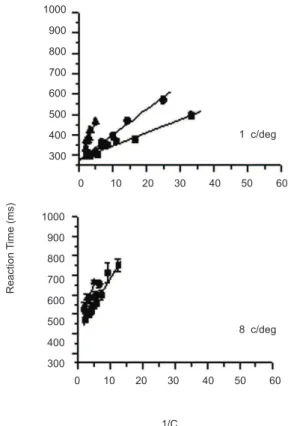
Figure 3 provides representative examples of the RT results as a function of the reciprocal contrast (1/C) without glare and with two different levels of glare (15 and 60 lux). The results showed that in the mesopic range, for both the fovea (Aguirre et al., 2008) and periphery (Aguirre et al., 2011) for each experimental condition (i.e., spatial frequency and glare and for all the observers), RT follows a linear relationship with the reciprocal of luminance contrast. The slope k increases with the level of glare for all spatial frequencies, and the magnitude of these changes depends on the spatial frequency (Issolio & Colombo, 2003).
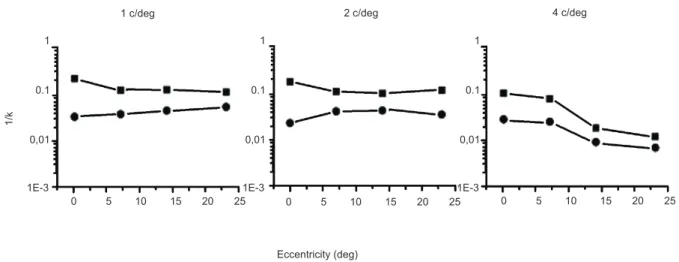
The behavior of slope k with eccentricity (not shown) shows similar behavior. The contrast gain (1/k) as a function of eccentricity for the non-glare condition and with a glaring source of 60 lux for three values of spatial frequency (1, 2, and 4 c/deg) shown in Figure 4 (Aguirre et al., 2011) shows similar behavior to that found by Murray & Plainis (2003) in the mesopic range: 1/k remains approximately constant throughout the range of eccentricity for 1 and 2 c/deg and only decreases for 4 c/deg. Our results also showed that glare decreased1/k quite homogeneously along the entire range of eccentricity. The curves in all of the panels of Figure 4 are nearly parallel.
By combining our results on the effect of glare over k (Figure 3) with the results of Plainis & Murray (2000) with regard to the effect of adaptation luminance over k, correspondence can be found between the decrease in luminance (i.e., loss of equivalent luminance) and
Figure 3. RT as a function of the reciprocal of contrast (1/C)
for the three levels of glare (EG=0 (<), 15(=)y 60(ı) lux) for
one observer (RA), two spatial frequencies (1 and 8 c/deg) and foveal vision. Each data point represents the mean of 30 measurements and the error bars are ±1 SE. (Figure taken from Aguirre et al., 2008) 83 x 101 mm (300 x 300 DPI).
increase in glare that would produce the same decrease in visual performance.
With regard to lighting barriers, if glare is the cause for a reduction of visual performance, then its effects are equivalent to a reduction of the adaptation luminance. For example, in night-driving situations, luminance adaptation is reduced 10 times with a glare of 60 lux.
Glare reduces brightness perception
Glare can also be a functional vision barrier in terms of a darkening effect. We designed an alternative experiment to measure the effect of glare on the brightness of a test considering suprathreshold contrasts.
Fry & Alpern (1953) were the irst to show that
the presence of a glare source reduced brightness in a test. Their experimental results derived a model of Lv that was similar to the one presented in Equation 1. The results of Fry & Alpern (1953) were obtained under steady conditions of glare. Many years later, Colombo, Barraza, & Issolio (2000) determined the reduction of brightness under transient conditions. Although they found behavior that was qualitatively similar to the behavior observed by Fry & Alpern (1953), the results were quantitatively larger because of the typical initial loss of sensitivity after an abrupt change in retinal stimulation until the activation of mechanisms that adapt to light (Crawford, 1947; Bichao, Yager, & Meng, 1995).
1000
900
800
700
600
500
400
300 1000
900
800
700
600
500
400
300
0 10 20 30 40 50 60
0 10 20 30 40 50 60 1 c/deg
1/C
8 c/deg
Reaction
T
ime
Figure 4. -1/k as a function of eccentricity considering EG = 60 (•) and no-glare condition (▪) for one observer and for different
spatial frequencies (1, 2 and 4 c/deg) respectively. (Figure taken from Aguirre et al., 2011) 199 x 99 mm (300 x 300 DPI).
The relevance of the results obtained by Colombo et al. (2000) relies on the fact that the reduction of brightness was measured by considering the mesopic conditions on the stimuli (0.5, 1, and 2 cd/m2), a source of glare with
5-60 lux luminance, and a 10 deg angle measured from the visual axis that corresponded to the angles present in night driving when facing a vehicle that is approaching in the opposite direction. Additionally, the transitory condition of this glare source (300 ms) also corresponded to the critical situation when the loss of visibility and reduction of brightness are at their maximum level and, therefore, correspond to a situation of higher risk than that faced by someone who is driving at night.
The results of this experiment are presented in Figure 5.The Lm/Lstd ratio is presented as a function of the different levels of glare illuminance that were used and for two observers for a surround of 0.01cd/m2 (for
details, see Colombo et al., 2000).
The results were itted to a function that is similar to
the one used by Fry & Alpern (1953):
n std
m
E
k
L
L
⋅
+
=
1
1
(4)
k and n are parameters that provide information about visual processing. The n values obtained in both studies were similar (0.8 and 0.6 for steady and transient conditions, respectively), indicating that both sets of data represent the same phenomenon. At the same time, k is different by more than two orders of magnitude (0.06 and 0.28 for steady and transient conditions,
respectively), relecting the transient effect mentioned
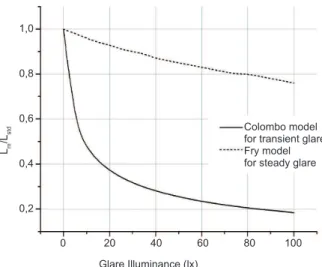
above (Figure 6). This result suggests the importance of considering the transient effects of glare. In visual tasks in the mesopic range and with very low levels of surround luminance within the scotopic range, brightness can be as low as 20% of the brightness that would be perceived if there was no glare.
Figure 5. Lm/Lstd ratio as a function of glare illuminance. Data obtained from two observers (JB and LI) with three values of Lstd (0.5 cd/m2, 1 cd/m2 and 2 cd/m2). Background
luminance = 0.01 cd/m2. (Figure taken from Colombo et al.,
2000) 99 x 99 mm (300 x 300 DPI).
The importance of surround luminance
Mean luminance is a typical variable that is used to characterize a lighting installation in the engineering
ield. If we consider which type of space is lit, the visual
requirements of the tasks that people develop in that space, and the existing regulations, then determining the level of mean luminance needed for an installation is possible. Many of these values arise from a compromise between the visual performance that is suitable for the task and the economic factors that the installation requires such as the cost of appliances, lamps, energy, and maintenance.
In the case of ixed lighting systems on streets or
highways, the recommended levels are between 0.5 and 2 cd/m2, depending on the low of trafic, which
are within the range of mesopic visual adaptation (Commission Internationale de l´Eclairage, 2010a,b). 1
0.1
0,01
1E-3
1
0.1
0,01
1E-3
1
0.1
0,01
1E-3
1/k
Lm
/Lstd 0 5 10 15 20 25
Glare Illuminance (lx)
0 5 10 15 20 25 0 5 10 15 20 25
1 c/deg 2 c/deg
Eccentricity (deg)
4 c/deg
JB 0.5 cd/m2 JB 1 cd/m2 LI 0.5 cd/m2 LI 1 cd/m2 L1 2 cd/m2
1,0
0,8
0,6
0,4
0,2
0,0
Based on our own measurements on roads without ixed
lighting systems, we obtained levels of illumination of 0.1 to 1 cd/m2 given off by car lights. Although some
overlap between the ranges exists, the lighting conditions provided by a car are restricted to a reduced area and do
not have the same uniformity of ixed lighting systems.
Additionally, the surroundings of that illuminated area can be very dark, reaching scotopic levels.
Our purpose was to study how the brightness
perception of a night driver is modiied under conditions
of transient glare for different levels of light in the surroundings of the visual scene. For this purpose, matching luminance was determined for a test with a mesopic luminance of 0.5 cd/m2, which remained
invariable for different conditions of surround lighting, from low mesopic levels (0.01 cd/m2) to high mesopic
levels (2 cd/m2; for details, see Issolio & Colombo,
2006).
A change in surrounding luminance Ls permitted the evaluation of both incremental and decremental stimuli. Figure 7 shows that for increments, the matching luminance Lm grows from very low levels until it reaches the value of Lt. Decrements behave very differently, remaining approximately constant for all levels of surrounding luminance that were considered.
These results revealed that the reduction of brightness caused by glare cannot be generalized and strongly depends on the surrounding luminance. Barrionuevo, Colombo, & Issolio (2010) developed a satisfactory model that considers the different processes of adaptation that occur in the retina such as the saturation of photoreceptors, the multiplying mechanism, the subtractive mechanism, and the contrast gain. This type of brightness reduction is also very pronounced when the peripheral zone is not stimulated. This is consistent with the results of studies on cone-rod interactions (Goldberg, Frumkes, & Nygaard, 1983; Alexander &
Fishman, 1984; Coletta & Adams, 1984) that showed how the so-called suppressive rod-cone interaction produces an increase in the sensitivity of a test when the stimulation of the peripheral rods is increased.
From the perspective of lighting engineering, the results of this experiment showed how obtaining important improvements in the evaluation of brightness is possible with small increases in the surrounding light, even when the levels are lower than those recommended for road lighting. This conclusion coincides with other authors (Pokorny & Cao, 2010) in which the lighting of the surrounding areas of the scene that are governed by rods is a way to improve people’s visual conditions.
Conclusions
Even under suprathreshold conditions and with healthy vision, some situations can become functional vision barriers. This can be aggravated if a person’s vision is diminished, presenting real challenges including potential threats to the person’s integrity and the possibility of accidents. To address this issue, considering the capabilities of the visual system, how they depend on the lighting and stimulus, and what changes affect them is important. The results presented herein were based on psychophysical vision experiments and considered relevant variables such as luminance contrast, the chromaticity of the stimuli, the effect of glare on visual function, and the state of adaptation of the visual system. Although age was not considered in these cases, the measured effects of glare become more
signiicant as time passes because of the clouding of the
crystalline that can, in some cases, lead to the formation of cataracts. Because of these changes, older people may show greater sensitivity to glare than younger people, making the control of lighting systems even more important to obtain better quality of the lighting environment.
Figure 7. Lm as a function of surround luminance. Increments and decrements data are located to the left (increments) and to the right (decrements) of the line corresponding to Lstd equal to 0.5 cd/m2. Data were obtained with three observers. (Figure
taken from Issolio et al., 2006) 99 x 99 mm (300 x 300 DPI).
Figure 6. Lm/Lstd ratio as a function of glare illuminance determined by the Issolio & Colombo model (2006) for transient glare and by the Fry model for steady glare. 99 x 99 mm (300 x 300 DPI).
Lm
/Lstd Lm
/(cd/m
2
Glare Illuminance (lx)
Surround Illuminance (cd/m2)
Colombo model for transient glare Fry model for steady glare
LI MIM RA
Surround Luminance Increments Decrements
1,0
0,8
0,6
0,4
0,2
1,0
0,5
0,0
For functional vision barriers such as chromatic stimuli with low contrast luminance (<20%), we found that an increase in purity excitation can compensate for
this deicit and yield a similar or equal visual response (≥90%) as the one that corresponds to an achromatic
stimulus with high contrast (>60%). This conclusion suggests that the guidance presented herein should be valuable to anyone who seeks to understand where and how color can be used to improve visual performance.
Another functional visual barrier is the effect of glare on visual performance. We found that an increase in glare produces an effect that is equivalent to a reduction of adaptation luminance. We found a correlation that could be an important tool for estimating the effect that is produced by a glare situation in terms of a decrease in luminance because it is the variable that determines the state of adaptation of the visual system.
Finally, glare may also affect brightness perception.
The signiicant effect of a dark surround on the
brightness of a test would indicate the importance of
having ixed lighting systems for all types of roads. Such
systems would offer a minimum frame of brightness that increases the general level of illumination of the setting. Irikura, Toyofuku, & Yoshiro (1999) suggested that minimum levels of illumination could be considered for some busy portions of motorways to provide greater security for drivers. They explained that these values should be lower than the recommended levels, which would not be acceptable from an economic point of view when considering very long stretches of road
that may have very little trafic. Another alternative
in some designs would be to moderately increase the
relectance of different elements that make up the visual
scene. For example, certain types of materials could be incorporated into the paving mixture that would result in higher levels of luminance when the vehicle uses only its own lighting system.
The data presented herein provide relevant information to avoid functional vision barriers to achieve good quality designs with regard to both the visual environment and lighting systems. This is consistent with the goal of shifting from a lighting design that is based only on the amount of light to another design that is centered on lighting quality, which would have a direct effect on the quality of people’s lives.
Acknowledgements
This study was supported by the National Research Board (Consejo Nacional de Investigaciones
Cientíicas y Técnicas), National Agency of Science and Technology (Agencia Nacional de Promoción Cientíica
y Tecnológica), and National University of Tucumán (Universidad Nacional de Tucumán).
References
Aguirre, R. C., Colombo, E. M., & Barraza, J. F. (2008). Effect of glare on simple reaction time. Journal of the Optical Society of America: A. Optics, Image Science, and Vision, 25, 1790-1798. Aguirre R. C., Colombo E. M., & Barraza J. F. (2011). Effect of
glare on reaction time for peripheral vision at mesopic adaptation.
Journal of the Optical Society of America: A. Optics, Image Science, and Vision, 28, 2187-2191.
Akashi, Y., & Rea, M. (2002). Peripheral detection while driving under a mesopic level. Journal of the Illuminating Engineering Society Winter, 85-93.
Alexander, K. R., & Fishman, G. A. (1984). Rod-cone interaction in licker perimetry. British Medical Journal, 68, 303-309.
Aparicio, J. A., Arranz, I., Matesanz, B. M., Vizmanos, J. G., Padierna, L., González, V., … Issolio, L. (2010). Quantitative and functional inluence of surround luminance on the letter contrast sensitivity function. Ophthalmic and Physiological Optics, 30, 188-199. Barrionuevo, P., Colombo, E., & Issolio, L. (2010). Modelling glare
effects on brightness perception. Perception, 39 (ECVP Abstract Suppl), 167.
Bichao, I. C., Yager, D., & Meng, J. (1995). Disability glare: Effects of temporal characteristics of the glare source and of the visual-ield location of the test stimulus. Journal of the Optical Society of America: A. Optics, Image Science, and Vision, 12, 2252-2258. Boyce, P. R., & Rea, M. S. (1987) Plateau and escarpment: The shape
of visual performance. Proceedings of the 21st Session of the CIE, Vienna.
Brunnström, G., Sörensen, S, Alsterstad, K., & Sjöstrand, J. (2004). Quality of light and quality of life: The effect of lighting adaptation among people with low vision. Ophthalmic and Physiological Optics, 24, 274-280.
Caplan, R. (1992). Disabled by design. Interior Design, 63, 88-91. Charman, W. (1996). Night myopia and driving. Ophthalmic and
Physiological Optics, 16, 474-485.
Commission Internationale de l´Eclairage (2002). CIE collection on glare (Report no. 146). Vienna: Commission Internationale de l´Eclairage.
Commission Internationale de l´Eclairage (2010a). Lighting of
roads for motor and pedestrian trafic (Report no. 115). Vienna: Commission Internationale de l´Eclairage.TC 4-44.
Commission Internationale de l´Eclairage (2010b). Recommended system for mesopic photometry based on visual performance (Report no. 191). Vienna: Commission Internationale de l´Eclairage. Coletta, N. J., & Adams, A. J. (1984). Rod-cone interaction in licker
detection. Vision Research, 24, 1333-1340.
Colombo, E., Barraza, J., & Issolio, L. (2000). Effect of a brief exposure on brightness perception in the scotopic-mesopic range. Lighting Research and Technology, 32, 65-69.
Crawford, B. H. (1947). Visual adaptation in relation to brief conditioning stimuli. Proceedings of the Royal Society of London: Series B. Biology, 134, 283-302.
Di Laura, D. (2011). IESNA lighting handbook: Reference and application, 10th edition. New York: Illuminating Engineering Society of North America.
Dillon, R., Pasini, I., & Rea, M. S. (1987). Survey of visual contrast in ofice forms. Proceedings of the 21st Session of the Commission
Internationale de l´Eclairage, Vienna.
Deutsches Institut Fur Normung (2007). DIN 5035-8 Artiicial lighting: Part 8. Workplace luminaries: Requirements, recommendations and prooing, Berlin: Deutsches Institut Fur Normung.
Diaz, J. A., del Barco, J., Jimenez, J. R., & Hita, E. (2001) Simple reaction time to chromatic changes along L&M-constant and S-constant axes. Colour Research and Application, 26, 223–233. Eklund, N. (1999). Exit sign recognition for color normal and color
deicient observers. Journal of the Illuminating Engineering Society, 28 (1), 71-81.
Fotios, S., & Boyce, P. (2005). Light source spectrum, brightness perception and visual performance in pedestrian environments: A review. Lighting Research and Technology, 37, 271-294.
Fotios, S., & Cheal, C. (2007). Lighting for subsidiary streets: Investigation of lamps of different SPD: Part 1. Visual performance.
Lighting Research and Technology, 39, 215-232.
Fotios, S., & Cheal, C. (2011). Predicting lamp spectrum effects at mesopic levels: Part 2. Preferred appearance and visual acuity.
Lighting Research and Technology, 43, 159-172.
Fry, G. A., & Alpern, M. (1953). The effect on foveal vision produced by a spot of light on the sclera near the margin of the retina. Journal of the Optical Society of America, 43, 187-188.
(series title: International ophthalmology clinics, vol. 43) (pp. 5-15). Philadelphia: Lippincott Williams & Wilkins.
Goldberg, S. H., Frumkes, T. E., & Nygaard, R. W. (1983). Inhibitory inluence of unstimulated rods in the human retina: Evidence provided by examining cone licker.Science, 221,180-182. Harwerth, R. S., & Levi, D. M. (1978). Reaction times as a measure of
suprathreshold grating detection. Vision Research, 18, 1579-1586. Harwood, R. (2001). Visual problems and falls. Age and Aging,
30(Suppl. 4), 13-18.
Irikura, T., Toyofuku, Y., & Yoshiro, A. (1999). Recovery time of visual acuity after exposure to a glare source. Lighting Research and Technology, 31, 57-61.
Issolio, L., & Colombo, E. M. (2006). Brightness for different surround conditions: The effect of transient glare. Perception and Psychophysics, 68, 702-709.
Jaén, E. M., Colombo, E. M., & Kirschbaum, C. F. (2011). A simple visual task to assess licker effects on visual performance, Lighting Research and Technology, 43, 457-471.
Kashara, S., Okabe, S., Nakasato, N., & Ohno, Y. (2007). Eye movement patterns of the elderly during stair descent: Effect of illumination. Journal of Light and Visual Environment, 31, 134-145. Lasagno, C., Pattini, A., Rodríguez, R., & Colombo, E. M. (2011).
Developing a modelling factor index for transition spaces: A case study approach. Architectural Science Review, 54(4), 215-224. Lingard, R., & Rea, M. (2002). Off-axis detection at mesopic light
levels in a driving context. Journal of the Illuminating Engineering Society, Winter, 33-39.
Lord, S. R. (2006). Visual risk factors for falls in older people. Age and Aging, 35(Suppl. 2),ii42-ii45.
MacLeod, D. I., & Boynton, R. M. (1979). Chromaticity diagram showing cone excitation by stimuli of equal luminance. Journal of the Optical Society of America, 69, 1183-1186.
McKeefry, D. J., Parry, N. R., & Murray, I. J. (2003). Simple reaction times in color space: The inluence of chromaticity, contrast, and cone opponency. Investigative Ophthalmology and Visual Science,
44, 2267-2276.
Murray, I. J., & Plainis, S. (2003). Contrast coding and magno/parvo segregation revealed in reaction time studies. Vision Research, 43, 2707-2719.
O’Donell, B., Colombo, E. M. (2008). Simple reaction times to chromatic stimuli: Luminance and chromatic contrast. Journal of Lighting Research and Technology, 40(4), 359-371.
O’Donell, B., Barraza, J. F., & Colombo, E. M. (2010). The effect of chromatic and luminance information on reaction times. Visual Neuroscience, 27, 119-129.
O’Donell, B. M., Bonci, D., Oliveira, M., Ventura, D. F., & Colombo, E. (2011). Reaction times for human color-vision deiciency. 21st Symposium of the International Colour Vision Society, July 1-5, 2011, Kongsberg, Norway.
O’Donell, B. M., Colombo, E. M., & Boyce, P. R. (2011).. Colour
information improves relative visual performance. Lighting Research and Technology, 23, 423-438.
Olson, P. L., & Sivak, M. (1984). Glare from automobile rear-vision mirrors. Human Factors, 26, 269-282.
Owsley, C., Stalvey, B. T., Wells, J., Sioane, M. E., & McGwin, G., Jr. (2001). Visual risk factors for crash involvement in older drivers with cataract. Archives of Ophthalmology, 119, 881-887.
Parry, N. R. A., Plainis, S., Murray, I. J., & McKeefry, D. J. (2004). Effect of foveal tritanopia on reaction times to chromatic stimuli. Visual Neuroscience, 21, 237-242.
Plainis, S., & Murray, I. J. (2000). Neurophysiological interpretation of human visual reaction times: Effect of contrast, spatial frequency and luminance. Neuropsychologia, 38, 1555-1564.
Pokorny, J., & Cao, D. (2010). Rod and cone contributions to mesopic vision. Proceedings of Commission Internationale de l´Eclairage 2010, Lighting Quality and Energy Eficiency. X035, 9-20.
Rea, M. S., & Ouellette, M. J. (1988). Visual reaction times using reaction times. Lighting Research and Technology, 40, 139-153. Regan, D., & Neima, D. (1983). Low-contrast letter charts as a test of
visual function. Ophthalmology, 90, 1192-1200.
Sturgis, S. P., & Osgood, D. J. (1982). Effects of glare and background luminance on visual acuity and contrast sensitivity: Implications for driver night vision testing. Human Factors, 24, 347-360. Turano, K. A., Broman, A. T., Bandeen-Roche, K., Munoz, B.,
Rubin, G. S., & West, S. (2004). Association of visual ield loss and mobility performance in older adults: Salisbury Eye Evaluation Study. Optometry and Vision Science, 81, 298-307.
Vos, J. J. (1984). Disability glare: A state of the art report. CIE Journal, 3, 39-53.