Article
Printed in Brazil - ©2015 Sociedade Brasileira de Química0103 - 5053 $6.00+0.00A
*e-mail: [email protected], [email protected]
A Fast Chromatographic Method for Determination of Daidzein and Genistein in
Spiked Water River Samples Using Multivariate Curve Resolution
Edilene D. T. Moreira,a Licarion Pinto,a Adriano A. Gomes,a Héctor C. Goicoechea*,b
and Mário C. U. Araújo*,a
aLaboratório de Automação e Instrumentação em Química Analítica e Quimiometria (LAQA),
Departamento de Química, Universidade Federal da Paraíba, CCEN, CP 5093, 58051-970 João Pessoa-PB, Brazil
bLaboratorio de Desarrollo Analítico y Quimiometría (LADAQ), Cátedra de Química Analítica
I, Facultad de Bioquímica y Ciencias Biológicas, Universidad Nacional del Litoral-CONICET, Ciudad Universitaria, 3000 Santa Fe, Argentina
This work reports the development of a fast chromatographic methodology for quantitation of two phytoestrogens: daidzein (DAI), and genistein (GEN), in river water samples. The proposed method is based on high performance liquid chromatography-diode array detection (HPLC-DAD) data, and multivariate curve resolution-alternative least square (MCR-ALS) second-order calibration. Initially, the method was evaluated analyzing a synthetic validation set; prepared based on a Taguchi design. Subsequently, the method was applied to predict the concentration of the phytoestrogens in spiked river water samples, previously pre-processed by solid phase extraction (SPE). By implementation of the present chromatographic methodology, a 50% reduction in operation time was achieved (from 7.00 to 3.25 min) when compared with previous work in the literature. Precision was achieved even in the presence of non-modeled constituents and strong background. Thus, the proposed method is a rapid and robust alternative for the quantitation of studied phytoestrogens.
Keywords: emerging contaminants, liquid chromatography, multiway calibration, second order advantage
Introduction
As a result of human activities, an increased production of waste has been noted, particularly in natural waters. Consequently, the level of pollutants such as heavy metals, (well known for their toxic effects on living beings), has also
increased.1,2 However, little is known about the impact of a
class of compounds called emerging contaminants. These compounds are also released to the environment, and have
recently become the object of a wide variety of studies.3,4
Within this latter group of contaminants, phytohormones have great importance, since it is known that this class of
compounds is bioactive even at low concentrations.5 Some
phytohormones have been detected in environmental waters at alarming levels, as is the case of daidzein (DAI) and
genistein (GEN).6,7
Phytohormones are non-steroidal polyphenolic
metabolites produced by plants,8 which can chemically
bind to specific intracellular estrogenic receptors causing variations of endocrine signals in animals and humans,
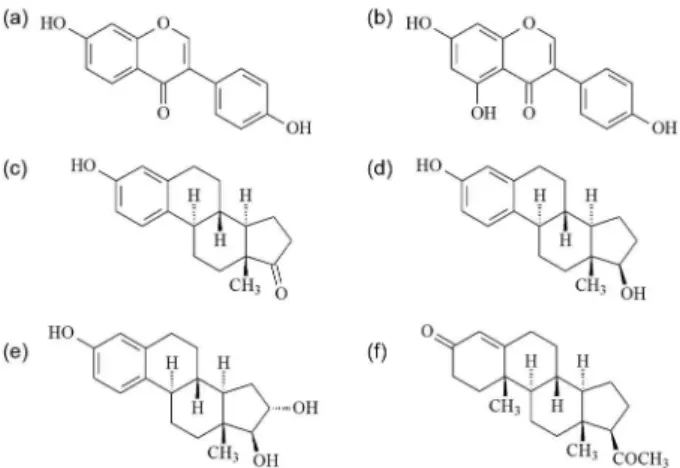
thus their characterization as phytoestrogens.9 In Figure 1
the structural similarity between the phytoestrogens DAI and GEN, to basic estrogen structures is shown. Recent results have shown that fish exposed to phytoestrogens may become more aggressive, due to testosterone reduction, and
to immunosuppression.10,11
Phytoestrogens originating in the soy-processing industries, (field grain cultivation, and the food industry)
contaminate both rivers and lakes.12,13 Research shows
that after consumption, phytoestrogens undergo numerous metabolic conversions. Both their metabolites, and their precursor compounds may be absorbed into the
bloodstream, and then excreted in urine.14,15 The increased
production of soybeans and their derivatives for both eastern and western diets has been associated with a higher
incidence of cancer in women.16
A well-documented phytoestrogens excretion in human
surface waters and domestic sewage.18-20 A lack of proper
water treatment implies that phytoestrogens (among other contaminants) reach the population.
Several methodologies have been proposed to quantify phytoestrogens, being that liquid (LC) or gas (GC)
chromatography, coupled with mass spectrometry (MS),21,22
are the most used methods. Other approaches have also
been presented in the literature,21 like LC and capillary
electrophoresis (CE) combined with absorbance (diode
array detector, DAD),23,24 fluorescence and electrochemical
detection,25,26 immunoassays,27 and voltammetry.28
The use of multiway data modeling with appropriate algorithms has been quite successful in quantifying a wide
variety of chemical compounds in complex matrices.29-31
Multiway data can be easily generated with the modern instrumentation available in research and/or industrial laboratories, as examples; LC-DAD, GC combined with mass spectroscopy (GC-MS), CE-DAD systems (which are known as hyphenated techniques), or even simple excitation
emission matrices (EEM).32 In terms of modeling multiway
data, in the specific case of LC-DAD systems, multivariate curve resolution-alternative least square (MCR-ALS) is an
appropriate algorithm.33
The development and validation of chromatographic analytical methods involves several steps, among them, analysis of interferences, which involves costs and time consuming. The composition of real samples tends to be complex, and may vary from sample to sample. An interferent (unexpected) can arise at any time. This requires that the method be modified and validated. The second order advantage can ensure that a chromatographic method continues to work well in scenarios where conventional strategies have failed. Another aspect is that there is no need for full chromatographic resolution of the analytes, which allows the use of shorter runs with fewer solvent consuming.
Determinations of drugs and pesticides in blood, water, and/or food and drinks are examples of multiway
calibration applications.34-36 These applications have the
great advantage of being able to circumvent the presence of unexpected constituents in a single sample; this feature
is known as the second-order advantage.32 Thus, steps for
the removal of interferents are not required, thus permitting
less costly methods to be developed.37
This paper presents a method based on high performance liquid chromatography (HPLC) with molecular absorption detection in ultraviolet-visible region (UV-Vis) for simultaneous quantitation of two phytoestrogens in spiked river water samples (DAI and GEN), using multivariate curve resolution with alternating least squares. The predictive ability of the calibration models built, using pure standards of both analytes were
evaluated for: (i) validation samples consisting of mixtures
of DAI and GEN standards plus another phytoestrogen equol (EQL), which was added as a potential interferent,
and (ii) river water samples. In addition, an isocratic
elution mode was employed, with a run time of less than three and a half minutes, contributing to the development of green analytical methods.
Experimental
Reagents and solutions
All reagents used in this work were of high-purity
(≥ 99%). Daidzein, Genistein and Equol were purchased
from Sigma-Aldrich Co. Acetonitrile and water (both HPLC grade) were filtered through a cellulose filter of
0.45 µm. All stock solutions of DAI (100.0 mg L-1), GEN
(200.0 mg L-1) and EQL (100.0 mg L-1) were prepared in
volumetric flasks by dissolving appropriate amounts in acetonitrile.
Apparatus and HPLC procedure
The LC-DAD matrices were recorded in an Ultimate 3000 Dionex liquid chromatograph, equipped with a manual injector and a fixed loop of 20 µL. Detection was carried out with a diode array detector in the range of 229 to 349 nm with resolution of 1 nm. A C18 column (AcclaimTM120) of 150 mm × 4.6 mm, 5 µm particle size and pore size 120 Å was used. The LC-DAD matrices were recorded employing the Chromeleon 6.1 software (DIONEX CA). The elution of standards and samples was performed in isocratic mode with an acetonitrile:water (70:30, v/v) mixture at a flow rate
of 1.0 mL min-1 while maintaining the temperature of the
column constant at 30 °C. Figure 1. Molecular structure of (a) daidzein; (b) genistein; (c) estrone;
Calibration and validation sets
The calibration set consists of nine pure standards in triplicate for each analyte in the range of 1000 to
5000 ng mL-1, with equally spaced increments of
500 ng mL-1. All calibration standards were prepared by
dilution of an appropriate aliquot of the stock solution. The validation set was designed to assess the predictive ability of the calibration models, and to exploit the second order advantage. To achieve this goal, the validation set consisted in sixteen mixtures (in triplicate) of DAI,
GEN and EQL generated according to a Taguchi design38
with three factors at four levels (1300, 2300, 3300, and
4300 ng mL-1), whose concentrations for each of the sixteen
validation mixtures are shown in Table 1.
DAI and GEN are the analytes quantified in this work, and EQL was added to the validation mixtures to simulate a potential interferent in the quantification of DAI and GEN by the proposed methodology. EQL was selected because it co-elutes with DAI and GEN in the chromatographic conditions used in this work. Nevertheless, the latter compound is also detected in real water samples.
River water samples
Eight river water samples were collected at different points along the Cuiá River in Paraíba, Brazil. Each sample was stored in a 1 L amber bottle, and acidified to pH 3 with acetic acid. The samples were subsequently processed
in triplicate, as explained in the solid phase extraction procedure section.
Recovery
To evaluate the accuracy of the method, the river water samples were spiked with appropriate amounts of each
analyte, generating samples at a concentration of 1 ng mL-1.
The spiked samples were also processed by solid phase extraction.
Solid phase extraction procedure
The samples (1.00 L spiked and non-spiked) were loaded on the C18 phase cartridge, pre-conditioned with 6 mL of the acetonitrile and 6 mL of water (both HPLC
grade), at a flow rate of 3 mL min-1. The elution was
collected and dried under a gentle stream of nitrogen gas. The residues were dissolved with 500 µL of acetonitrile in order to achieve an enrichment factor of 2000. After this process, the samples were stored in vials for further analysis.
Software and chemometric analysis
The data modeling by MCR-ALS was carried out in environmental MatLab® using the graphical interface
MVC2 developed by Olivieri et al.,39 and available on line.40
Briefly, MCR is a bilinear decomposition method which assumes that the responses of each constituent of the system
are additive37 as shown in equation 1.
D = C × ST + E (1)
where D contains information collected experimentally
as dimensions J × K. The information contained in D is
the signal recorded in a system LC-DAD, E (J × K) is
the residue matrix,41 where J represents the elution times
recorded at K wavelengths. C and ST are matrices truncated
to N factors. For well-behaved systems, N is the number of chemical compounds which contain information on the pure concentration and spectral profiles.
Initially, it is necessary to know N, which may come from prior knowledge of the samples, or by use of principal
component analysis (PCA).42 Here the N value was
accessed by inspection of the explained variance by each PCA component.
Starting from an initial estimative of C or ST, available
by evolving factor analysis,43 or by determination of the
purest variables;44C (J × N), and ST (N × K) are estimated
and optimized using alternating least squares.33 In this work,
Table 1. Validation set built according to a Taguchi design
Sample Daidzein / (ng mL-1) Genistein / (ng mL-1) (ng mLEquol / -1)
1 1300 1300 1300
2 1300 2300 2300
3 1300 3300 3300
4 1300 4300 4300
5 2300 1300 2300
6 2300 2300 1300
7 2300 3300 4300
8 2300 4300 3300
9 3300 1300 3300
10 3300 2300 4300
11 3300 3300 1300
12 3300 4300 2300
13 4300 1300 4300
14 4300 2300 3300
15 4300 3300 2300
for all cases were used initial estimative of the spectral profile obtained by the method SIMPLISMA with 10% noise.
The bilinear decomposition described in equation 1 suffers from rotational freedom, i.e., there are many
possible solutions for C and ST. However, the desirable
solution is the “chemical solution”, in this case pure chromatograms and spectra. Fortunately, the drawback of rotational freedom can be circumvented by applying
restrictions for the solutions (C and ST), obtained in each
ALS iteration. Non-negativity, and uni-modality are the
most common restrictions.32
In the case of I samples being analyzed on the LC-DAD
system, I matrices (J × K) are generated. When using
traditional algorithms for multiway data (like parallel factor analysis; PARAFAC), the data are arranged in a
cube structure (I × J × K). Such methods are based on
the principle of trilinearity,32 commonly not obeyed by
LC-DAD data, wherein elution time can be shifted for analytes from sample to sample.
The MCR-ALS algorithm is capable of handling
tri-linear data deviation. The three way array (I × J × K) is
arranged in the form of an augmented matrix (Daug) of size
(IJ × K) (column-wise augmented matrix), or size (IK × J)
(row-wise augmented matrix). It is recommended that the augmented way is the same as that which breaks the tri-linearity. The decomposition presented in equation 1 can
be applied on Daug, generating the matricesCaug, ST, and
Eaug for the case of the column-wise augmented matrix.32
Finally, the scores obtained for the sum of the elements of the corresponding profile for each of the sub-matrices of Caug is used to construct a pseudo-univariate model in function of the concentrations of the calibration standards. The analyte concentration n is obtained by interpolation in
the pseudo-univariate calibration line.32
Results and Discussion
Calibration set: general considerations
Figure 2 displays the chromatograms obtained for each of the calibration standards with absorbance recorded at 280 nm. A partial separation of the analytes (DAI and GEN) can be observed, although the resolution is less than one. Another interesting observation can be made by visual inspection of Figure 2; significant peak shifts are produced with different runs. This problem can be exacerbated by the presence of interferents (in real samples), which typically vary from sample to sample, making the use of peak alignment algorithms unfeasible, as was reported by
Boeris et al.45 Given the above, MCR-ALS was chosen
for modeling the data, because of its advantages, as was discussed in the introduction. A previous analysis carried out with the calibration matrices for a single analyte using extended MCR-ALS showed that two contributions (analyte and background profile) were retrieved.
Validation set
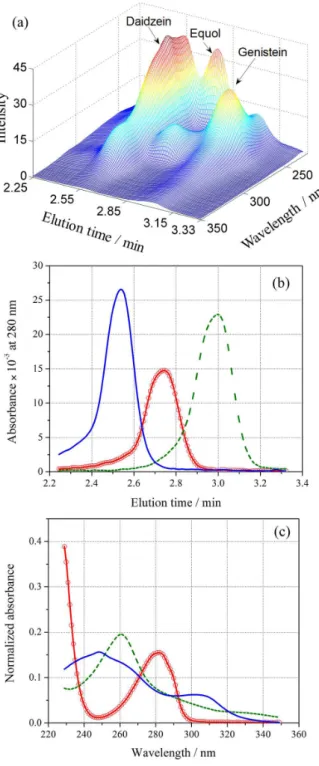
MCR-ALS was applied to predict concentration for the validation set composed of sixteen mixtures of DAI and GEN in the presence of EQL (un-modeled). As an example of the modeled data, Figure 3a presents a typical LC-DAD surface for the samples validation set (sample No. 1, see Table 1).
On inspection of Figure 3a, it is possible to visualize the strong overlapping among the analyte signals, as well as the one corresponding to the interferent. EQL shows a retention time between that of DAI and GEN, overlapping simultaneously the signals of both analytes in both instrumental modes. It is important to remember that for traditional chromatographic methods, with complete resolution of all peaks, an unexpected constituent in a single sample co-eluting with the analytes requires revalidation of the method, a highly time consuming and laborious task. Figures 3b and 3c show the chromatograms and spectra corresponding to the pure standards of both analytes, and
the interfering compound (all of them at 5000 ng mL-1).
In these figures, the high degree of overlapping among the signals in both modes is evident.
the validation mixtures, in this case three. However, sometimes a larger N value should be considered for better model fit. The increased number of components can be attributed to the complexity of the mixture, and to the presence of a strong background, which can lead to models with rank deficiency, as has been well discussed
elsewhere.46 In this study, analysis of the augmented
matrices was carried out by PCA, and the explained variance by each PC for the calibration and validation sets is shown in Table 2.
As can be seen, the analysis of PCA suggests two factors for both calibration sets, and four factors for the validation set, this amount of factors was used in the decomposition of data by MCR.
The initial estimatives of the pure spectral profiles was conducted using a method based on detection of pure variables (SIMPLISMA) with 10% noise. The estimated initial profiles retrieved for the validation samples can be assigned to DAI, GEN, the interferent EQL, and to the background.
The column-wise augmented matrix was then subjected to MCR-ALS decomposition, applying the non-negativity constraint in both modes and uni-modality in the time mode, except for background profile. In all cases ALS converged with a number of iterations less than or equal to thirty, and a residual fit of less than 0.51, which is in agreement with the typical noise of a DAD detector.
Figure 4 displays the optimized spectral and concentration profiles retrieved by MCR-ALS for the validation set samples. In this figure we observe a very close resemblance between the experimental profiles of both instrumental modes (see Figures 3a and 3b).
Beyond simple visual comparison of the spectra recovered by MCR, they may also be evaluated for degree
of overlap (S12) between the experimental normalized pure
spectrum (s1), and the retrieved spectrum (s2).47 The S12
value is calculated according to equation 2.
12 T 1 2
||s s || S
1 2
||s||||s||
= (2)
Figure 3. (a) Landscape obtained by LC-DAD for validation sample number 1; (b) chromatograms registered at 280 nm for pure standard solutions of (solid line) DAI, (dashed line) GEN and (circle line) EQL, all of them at 5000 ng L-1 and (c) the corresponding spectra of the latter compounds.
Table 2. Explained variance in PCA for calibration and validation sets
PCA Calibration set Validation set
DAI GEN
1 99.8146 99.7355 99.5669
2 0.1775 0.2453 0.3467
3 0.0042 0.0115 0.0486
4 0.0016 0.0045 0.0283
5 0.0005 0.0014 0.0043
6 0.0005 0.0006 0.0031
7 0.0001 0.0002 0.001
8 0.0001 0.0001 0.0002
9 0.0001 0.0001 0.0001
10 0.0001 0.0001 0.0001
The S12 value can vary in a range from 0 to 1, indicating
extreme conditions, wherein 1 represents complete overlap between the real and retrieved profiles. On the other hand, 0 indicates that the profiles are very different. By
applying equation 2 for S12, values of 1.0000 and 0.9998
were respectively obtained for DAI and GEN, indicating a satisfactory fit, and a high similarity for each spectrum and profile couple.
After the fitting, a pseudo-univariate calibration line was constructed through linear regression by ordinary least squares, between the value of the concentration of the
calibration standards and the MCR scores. The concentration of the test samples was calculated according to equation 3.
, 0
1
ccn test n n
n
a b
b
= (3)
where atest,n is the area under the concentration profile for
the analyte n of a matrix test sample; b1 and b0 are the slope
and intercept of the pseudo-univariate curve, respectively;
and cn is the concentration of the analyte n in the test sample
obtained by interpolation of the curve. The statistical parameters corresponding to the validation of the MCR models for DAI and GEN quantification are summarized in Table 3. In the latter table, observes that the MCR models were able to predict the concentration of GEN and DAI in validation samples, even in the presence of the interferent EQL. Root mean square error validation (RMSEV)
(equation 4) values of 177 (DAI) and 144 ng mL-1 (GEN),
and relative error prediction (REP) (equation 5) values of 5.9 (DAI) and 4.8% (GEN) were obtained.
I 2
pred nom i 1=(y y ) RMSEV
I −
=
∑
(4)cal
RMSEV
REP = 100 y (5)
where ypred is the concentration predicted by the MCR
model for the ith validation sample, ynom is the nominal
concentration, I is the number of validation samples. In
equation 5, ycal is the average of the nominal concentration
values of the calibration set samples.
Table 3 also presents several figures of merit: selectivity
(SEL), analytical sensitivity (γ), limit of detection (LOD),
and limit of quantitation (LOQ), which were calculated
according to Bauza et al.,48 and which complement the
validation of the MCR models. As can be seen, the analytical sensitivity and selectivity achieved is high enough to make the method even more attractive, considering the values of LOD and LOQ which were reached, computing them
through the formulas presented by Olivieri.49 Although the
proposed method achieved a LOD in parts per billion, for
real samples a pre-concentration step is needed. Figure 4. Profiles retrieved by MCR-ALS: (a) concentration, and
(b) spectral. Daizein (solid line), Genistein (dashed line), Equol (circle line) and background (diamond line).
Table 3. Summary of the figures of merit obtained when analyzing the validation set samples
Analyte RMSEV /
(ng mL-1) REP / %
γ /
(mL ng-1) SEL
LOD / (ng mL-1)
LOQ / (ng mL-1)
DAI 177 5.9 0.089 0.2 150 450
GEN 144 4.8 0.120 0.24 170 520
RMSEV: root mean square error validation; REP: relative error prediction; γ: analytical sensitivity; SEL: selectivity; LOD: limit of detection; LOQ: limit
Real samples
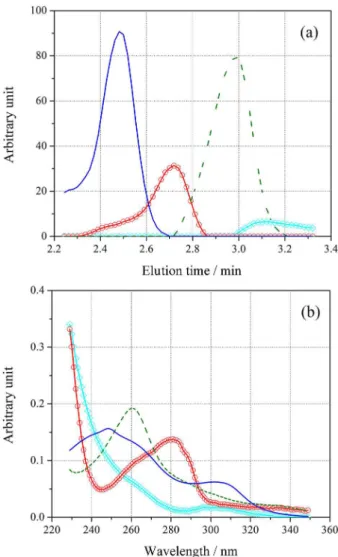
The eight river water samples were processed in triplicate using solid phase extraction, and run in an HPLC-DAD system under the same calibration conditions and validation set. The typical LC-DAD landscape sample
(No. 1)being representative, is shown in Figure 5a. For all
real samples, only one peak 1 was observed with an elution time around 2.60 min. We observed significant background presence (peak 2). The real samples data were analyzed similarly to the validation set samples by MCR-ALS, and for both analytes the concentration was below the limit of detection of the propose method. The real samples were
then spiked as indicated in the recoverysection.The surface
landscape, corresponding to a typical sample (No. 1) LC-DAD matrix registered for a river water sample, and spiked with DAI and GEN is presented in Figure 5b. In this figure, the complexity of the analytical problem involved can be appreciated: the presence of a heavy organic load in
samples of river water generates an extremely overlapped signal. The analyte signals are identified by the numbers 3 and 4. Behavior similar to that which is commented for the first real sample (No. 1), in Table 3, was observed for all samples.
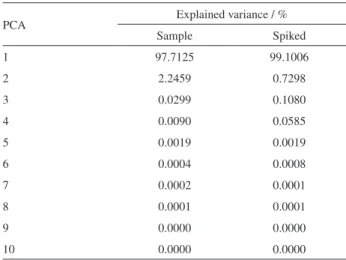
Four factors were suggested from the PCA results for the LC-DAD data of the spiked real samples. A number of factors were chosen based on the results of Table 4.
The second column of Table 4 shows the explained variance for the first 10 principal components for non-spiked samples. After the second factor there were no appreciable variations in the explained variance. After the samples were spiked with DAI and GEN, PCA analysis indicated four factors (see third column of Table 4).
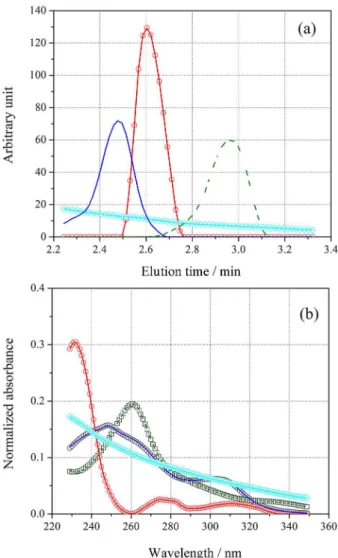
MCR was conducted using initial estimatives of the spectra (by SIMPLISMA with 10% noise), under the non-negativity restriction in both modes, and mean unimodality only in the chromatographic mode. Unimodality was not applied to the background profile. In Figure 6a (concentration profile), and Figure 6b (spectral profile), the profiles retrieved by MCR-ALS (using four factors) are shown. The profiles corresponding to DAI and GEN are displayed as solid blue and dashed green lines, respectively, and show good agreement with the experimentally recorded spectra (both shown with black circles and squares in Figure 6b), suggesting a good model fit with four factors.
Regarding Figure 6, the recovered profile can be also seen corresponding to the contribution of the interfering (circle red line). The concentration profile (Figure 6a) shows a wide peak, suggesting co-elution of an organic load signal, superimposed with both analytes. The spectral profile (Figure 6b) displays a spectrum with a maximum around 235 nm. It should be noted that in Figure 5. (a) Typical LC-DAD landscape after SPE for river water sample
and (b) landscape obtained for the typical (No. 1) real spiked water river sample with 1.0 ng mL-1 for both analytes.
Table 4. Explained variance in PCA for test set
PCA Explained variance / %
Sample Spiked
1 97.7125 99.1006
2 2.2459 0.7298
3 0.0299 0.1080
4 0.0090 0.0585
5 0.0019 0.0019
6 0.0004 0.0008
7 0.0002 0.0001
8 0.0001 0.0001
9 0.0000 0.0000
10 0.0000 0.0000
conventional chromatographic method, co-elution may require revalidation of the method. However, the use of mathematic signal separation overcomes this type of drawback in the analysis of complex samples. The background profile (diamond line), recorded for real samples appears much more intense than in the validation samples (see Figure 4).
Finally, concentration values of GEN and DAI were estimated by interpolation of the MCR areas of the test samples in the pseudo univariate calibration curve (the typical linear fit is displayed in the Figure 7). The pseudo univariate calibration curve was obtained by linear fit
of the MCR areas for calibration samples vs. nominal
concentration.
The results obtained are presented in Table 5. It is important to notice that the results for the DAI and GEN quantitations refer to real sample concentrations before the SPE step; in other words the figures of merit take into
account the enrichment factor of the samples. Thus, a different magnitude in values can be seen when comparing the later values with those presented in Table 3 (validation set).
As can be seen, the proposed method was able to predict the concentration of both analytes in spiked river water samples even in the presence of interferents and a strong background. This was achieved with an acceptable accuracy, which was verified through the recovery values that ranged between 99 and 125 for DAI, and from 77 to 111 for GEN, with REP% values of 9.38 and 8.51.
Comparing the method reported in this work with the
one published by Wang et al.,23 in which the quantitation
of DAI and GEN in river water samples using HPLC-DAD is reported, we noted a 50% reduction in the running time. The REP values obtained by application of both methods are quite similar. However, the new method shows higher
sensitivity, with 0.17 ng mL-1 of LOD for DAI, and 0.20
for GEN. Moreover, the proposed method makes use of the second order advantage, making it more robust when unexpected constituents occur in the sample, thus avoiding re-validations.
Figure 6. Representative profiles retrieved by MCR-ALS (from sample No. 1) (a) concentration and (b) spectral. Daizein (solid line), Genistein (dashed line), unknown (circle line), and background (diamond line).
Figure 7. Representative pseudo univariate calibration curve for (a) DAI
Conclusions
In this work a rapid method using high performance liquid chromatography with molecular absorption in the ultraviolet-visible region of detection for simultaneous quantification of daidzein, and genistein, (two potential emerging water contaminants) was presented. The strategy successfully models higher order data with MCR-ALS to overcome the disadvantages of a complex matrix which has a wide variety of interferents, which change from sample to sample. The proposed methodology was first evaluated for a synthetic validation set and then in spiked real water samples from the Cuiá River in João Pessoa, Brazil. Both cases showed good results.
Acknowledgements
The authors are grateful to CNPq, CAPES and INCTAA for scholarships and financial support. Hector C. Goicoechea thanks UNL, CONICET, and ANPCyT for financial support.
Reference
1. Pesavento, M.; Alberti, G.; Biesuz, R.; Anal. Chim. Acta2009, 631, 129.
2. Stankovic, S.; Kalaba, P.; Stankovic, A. R.; Environ. Chem. Lett. 2014, 12, 63.
3. Manciocco, A.; Calamandrei, G.; Alleva, E.; Chemosphere2014, 100, 1.
4. Pal, A.; He, Y.; Jekel, M.; Reinhard, M.; Gin, K. Y. H.; Environ. Int.2014, 71, 46.
5. Jefferson, W. N.; Padilla-Banks, E.; Newbold, R. R.; Reprod. Toxicol. 2007, 23, 308.
6. Kiparissis, Y.; Hughes, R.; Metcalfe, C.; Ternes, T.; Environ. Sci. Technol. 2001, 35, 2423.
7. Lundgren, M. S.; Novak, P. J.; Environ. Toxicol. Chem. 2009, 28, 2318.
8. Bednarek, P.; Franski, R.; Kerhoas, L.; Einhorn, J.; Wojtaszek, P.; Stobiecki, M.; Phytochemistry2001, 56, 77.
9. Coldham, N. G.; Sauer, M. J.; Food Chem. Toxicol. 2001, 39,
1211.
10. Zhang, L.; Khan, I. A.; Foran, C. M.; Comp. Biochem. Physiol., Part C: Toxicol. Pharmacol.2002, 132, 203.
11. Clotfelter, E. D.; Rodriguez, A. C.; Environ. Pollut.2006, 144,
833.
12. Kelly, M. M.; Arnold, W. A.; Environ. Sci. Technol. 2012, 46,
5396.
13. Kawanishi, M.; Takamura-Enya, T.; Ermawati, R.; Shimohara, C.; Sakamoto, M.; Matsukawa, K.; Matsuda, T.; Murahashi, T.; Matsui, S.; Wakabayashi, K.; Environ. Sci. Technol. 2004, 38, 6424.
Table 5. Summary of the results for application of the validated for MCR-ALS models in analysis of the spiked (1 ng mL-1) real river water samples
Sample DAI GEN
Nominal Predicted Recovery / % Nominal Predicted Recovery / %
1 1.00 1.18 ± 0.13 118 1.00 1.11 ± 0.10 111
2 1.00 0.99 ± 0.11 99 1.00 0.82 ± 0.13 82
3 1.00 1.07 ± 0.10 107 1.00 1.13 ± 0.06 113
4 1.00 1.18 ± 0.14 118 1.00 0.98 ± 0.08 98
5 1.00 1.25 ± 0.09 125 1.00 0.88 ± 0.04 88
6 1.00 1.03 ± 0.20 103 1.00 0.77 ± 0.16 77
7 1.00 1.15 ± 0.18 115 1.00 1.05 ± 0.06 105
8 1.00 1.06 ± 0.22 106 1.00 1.00 ± 0.17 100
RMSEP / (ng mL-1) 0.14 0.13
REP 9.38 8.51
Average recovery 111 97
SEL 0.22 0.36
γ / (mL ng-1) 36 26
LOD / (ng mL-1) 0.17 0.20
LOQ / (ng mL-1) 0.50 0.60
DAI: daidzein; GEN: genistein; RMSEV: root mean square error validation; REP: relative error prediction; SEL: selectivity; γ: analytical sensitivity;
14. Bustamante-Rangel, M.; Delgado-Zamarreño, M. M.; Carabias-Martínez, R.; Domínguez-Álvarez, J.; Anal. Chim. Acta2012,709, 113.
15. Dai, Q.; Franke, A. A.; Jin, F.; Shu, X. O.; Hebert, J. R.; Custer, L. J.; Cheng, J. R.; Gao, Y. T.; Zheng, W.; Cancer Epidem. Biomar.2002, 11, 815.
16. He, F. J.; Chen, J. Q.; Food Sci. Hum. Wellness2013, 2, 146. 17. Tekel, J.; Daeseleire, A.; Heeremans, E.; van Peteghem, C.;
J. Agric. Food Chem. 1999, 47, 3489.
18. Laganà, A.; Bacaloni, A.; De Leva, I.; Faberi, A.; Fago, G.; Marino, A.; Anal. Chim. Acta2004, 501, 79.
19. Kuster, M.; Azevedo, D. A.; Alda, M. J. L.; Aquino Neto, F. R.; Barceló, D.; Environ. Int.2009, 35, 997.
20. Comber, M. H. I.; Williams, T. D.; Stewart, K. M.; Water Res. 1993, 27, 273.
21. Wang, C.; Prasain, J. K.; Barnes, S.; J. Chromatogr. B2002, 777, 3.
22. Bai, Y.; Du, F.; Bai, Y.; Liu, H.; Anal. Methods2010, 2, 1867.
23. Wang, C.; Wang, L.; Zhao, Q.; Chen, J.; Zheng, L.; Zheng, M.; Zhang, R.; Wang, Z.; Anal. Methods2013, 5, 3688.
24. Shihabi, Z. K.; Kute, T.; Garcia, L. L.; Hinsdale, M.;
J. Chromatogr. A1994, 680, 181.
25. Wang, G.; Kuan, S. S.; Francis, O. J.; Ware, G. M.; Carman, A. S.; J. Agric. Food Chem. 1990, 38, 185.
26. Chen, G.; Zhang, J.; Ye, J.; J. Chromatogr. A2001, 923, 255. 27. Lapcik, O.; Hampl, R.; Hill, M.; Wahala, K.; Al-Maharik, N.;
Adlercreutz, H.; J. Steroid Biochem.1998, 64, 261.
28. Fogliatto, D. K.; Barbosa, A. M. J.; Ferreira, V. S.; Colloids Surf., B2010,78, 243.
29. Shenone, A. V.; Culzoni, M. J.; Marsili, N. R.; Goicoechea, H. C.; Food Chem.2013, 138, 1928.
30. Borraccetti, M. D.; Damiani, P. C.; Olivieri, A. C.; Analyst2009, 134, 1682.
31. Elcoroaristizabal, S.; Juan, A.; García, J. A.; Durana, N.; Alonso, L.; Chemom. Intell. Lab. Syst. 2014, 132, 63.
32. Escandar, G. M.; Goicoechea, H. C.; de la Peña, A. M.; Olivieri, A. C.; Anal. Chim. Acta2014, 806, 8.
33. Jaumot, J.; Gargallo, R.; Juan, A.; Tauler, R.; Chemom. Intell. Lab. Syst. 2005, 76, 101.
34. Lozano, V. A.; Escandar, G. M.; Anal. Chim. Acta2013, 782, 37. 35. Alcaráz, M. R.; Shenone, A. V.; Culzoni, M. J.; Goicoechea,
H. C.; Microchem. J. 2014, 112, 25.
36. Culzoni, M. J.; Goicoechea, H. C.; Pagani, A. P.; Cabezon, M. A.; Olivier, A. C.; Analyst2006, 131, 718.
37. Arancibia, J. A.; Damiani, P. C.; Escandar, G. M.; Ibañez, G. A.; Olivieri, A. C.; J. Chromatogr. B2012, 910, 22.
38. Wang, J.; Wa, W.; Int.J. Hydrogen Energy2009, 34, 235.
39. Olivieri, A. C.; Wu, H.; Yu, R.; Chemom. Intell. Lab. Syst.2009,
96, 246.
40. http://www.iquir-conicet.gov.ar/descargas/mvc2.rar accessed on May 03, 2015.
41. Tauler, R.; Chemom. Intell. Lab. Syst.1995, 30, 133. 42. Maeder, M.; Zilian, A.; Chemom. Intell. Lab. Syst. 1998, 3, 205.
43. Maeder, M.; Anal. Chem.1987, 57, 527.
44. Windig, W.; Guilment, J.; Anal. Chem.1991, 63, 1425.
45. Boeris, V.; Arancibia, J. A.; Olivieri, A. C.; Anal. Chim. Acta 2014, 814, 23.
46. Amrhein, M.; Srinivasan, B.; Bonvin, D.; Schumacher, M. M.;
Chemom. Intell. Lab. Syst.1996, 33, 17.
47. Culzoni, M. J.; Goicoechea, H. C.; Ibañez, G. A.; Lozano, V. A.; Marsili, N. R.; Olivieri, A. C.; Pagani, A. P.; Anal. Chim. Acta 2008, 614, 46.
48. Bauza, M. C.; Ibañez, G. A.; Tauler, R.; Olivieri, A. C.; Anal. Chem. 2012, 84, 8697.
49. Olivieri, A. C.; Chem. Rev.2014,114, 5358.
Submitted: March 3, 2015