Article
J. Braz. Chem. Soc., Vol. 26, No. 8, 1565-1572, 2015. Printed in Brazil - ©2015 Sociedade Brasileira de Química 0103 - 5053 $6.00+0.00
A
*e-mail: [email protected]
New
Terpenoids from
Croton limae
(Euphorbiaceae)
Antonio H. Sousa,a José N. Silva Junior,a Maria L. S. Guedes,b Raimundo Braz-Filho,c,d
Letícia V. Costa-Lotufo,e Ana J. Araújo,e Edilberto R. Silveiraa and Mary A. S. Lima*,a
aDepartamento de Química Orgânica e Inorgânica, Centro de Ciências,
Universidade Federal do Ceará, CP 12.200, 60021-940 Fortaleza-CE, Brazil
bDepartamento de Botânica, Instituto de Biologia, Universidade Federal da Bahia,
Campus Universitário de Ondina, 40170-290 Salvador-BA, Brazil
cLaboratório de Ciências Químicas, Universidade Estadual do Norte Fluminense Darcy Ribeiro,
28013-602 Campos dos Goytacazes-RJ, Brazil
dDepartamento de Química, Universidade Federal Rural do Rio de Janeiro,
23890-000 Seropédica-RJ, Brazil
eDepartamento de Farmacologia e Fisiologia, Centro de Ciências da Saúde,
Universidade Federal do Ceará, CP 12.200, 60430-270 Fortaleza-CE, Brazil
An asymmetrical dimer of kaurane diterpene and monoterpene and four novel diterpenes were isolated from the roots of Croton limae, along with kaempferol-3-O-glucoside, ombuin-3-O-rutinoside and acetyl aleuritolic acid. The cytotoxic activity of the kaurane diterpene was evaluated against colorectal adenocarcinoma (HCT-116), ovarian carcinoma (OVCAR-8) and glioma (SF-295) cell lines, exhibiting IC50 values of 7.14, 8.19 and > 10 µg mL−
1,
respectively.
Keywords: Croton limae, diterpenes, terpenoid adduct, cytotoxic activity
Introduction
Croton is the second largest genus of the Euphorbiaceae
family with around 1250 species dividided in 40 sections.
The Croton section Argyroglossum comprises about 15
species characterized as shrubs and trees in the neotropics. In South America, there are ten reported species, six of which occurring in the Northeast of Brazil. Croton limae
is endemic of this region and was often confused with the most related species C. argyrophyllus and C. tricolor, however, it was recently described by Gomes et al.1 as a
new species belonging to this section.
Previous studies with northeastern Croton species have reported the occurrence of several classes of diterpenes with complex structures and interesting biological activities, including trachylobane, kaurane, crotofolane and casbane classes.2-4 The phytochemical
study of C. limae here presented afforded an asymmetrical dimer (1), in addition to four new clerodanes including a
glycosyde derivative (2-5) (Figure 1), kaempferol-3-O -glucoside,5 ombuin-3-O-rutinoside6 and acetyl aleuritolic
1
2 R1= R2= O, R3= H, R4= OH, R5= H
3 R1= H, R2= OH, R3= H, R4= OH, R5= H
5 R1= R2= O, R3= OGlu, R4= R5= O
4 HO
HO HO
OH
H
H
H
1
2
3 4
5
6 7 8 9 10
11 12 13 14 15
16
17
18 19
20
18 19
9 20
R3
6
R4 O
HO
R5
H
R2
R1
1 2
3
4
5 7
8 9 10
11 12
13 14
15
16
17 20
19 18 1
2
3
4 5
6 7 8 10
11 12
13
14
15 16
17
10' 2'
3' 4'
5'
6'
7'
1' 8'
9'
HO2C
O H
H
acid.7 In addition, the cytotoxicity of compound 1 was
evaluated against colorectal adenocarcinoma (HCT-116), ovarian carcinoma (OVCAR-8) and glioma (SF-295) cell lines.
Experimental
General experimental procedures
Infrared (IR) spectra were recorded on a Perkin-Elmer FTIR 1000 spectrometer (Waltham, USA), using NaCl disc. The nuclear magnetic resonance (NMR) spectra were performed on Bruker Avance DRX 500 or DPX 300 instruments, equipped with an inverse detection probe head and z-gradient accessory. All pulse sequences were standard in the Bruker XWIN-NMR software, and all experiments were conducted at room temperature. The
1H and 13C chemical shifts are expressed in the dscale
and were referenced to tetramethylsilane (TMS) through the residual solvent. High resolution mass spectra were recorded on an UltrOTOF-Q mass spectrometer (LC-IP-TOF model 225-07100-34, Shimadzu) either by positive or negative ionization modes of the ESI source. Optical rotations were obtained on a Perkin-Elmer Q-2000 polarimeter, at 589 nm and 25 °C. Column chromatography was performed over silica gel 60 (Vetec, 70-230 and 40-63 mesh), Sephadex LH-20 (Pharmacia) and cartridge SPE C18 (Phenomenex). Thin layer chromatography (TLC) was performed on precoated silica gel aluminum sheets (Merck) and the compounds were visualized by UV detection and by spraying with vanillin/perchloric acid/EtOH solution, followed by heating. The tested compounds were analysed using the 3-(4,5-dimethyl-2-thiazolyl)-2,5-diphenyl-2H-tetrazolium bromide (MTT) purchased by Sigma Aldrich Co. and high-throughput screening (HTS), Biomek 3000-Beckman Coulter (Inc. Fullerton, California, USA). Absorbance was measured on a DTX 880 Multimode Detector, Beckman Coulter, Inc. Fullerton, CA, USA.
Plant material
Croton limae A. P. Gomes, M. F. Sales & P. E. Berry
was collected at Andaraí county, Bahia State, Northeast of Brazil, in December 2009. The specimen was authenticated by Prof Maria Lenise S. Guedes, from the Instituto de Biologia, Departamento de Botânica, Universidade Federal da Bahia (UFBA), Bahia, Brazil, and a voucher specimen (92958) was deposited at the Herbário Alexandre Leal Costa (ALCB), Universidade Federal da Bahia, Bahia, Brazil.
Extraction and isolation
Roots (1.7 kg) of C. limae were pulverized and extracted with hexane at room temperature. The solvent was removed under reduced pressure to yield a residue (40.2 g), which was then extracted with EtOH to yield the correspondent extract (32.1 g).
The hexane extract (40.2 g) was coarsely chromato-graphed over silica gel column yielding six fractions by elution with hexane (F-1), hexane:CHCl3 1:1 (F-2),
CHCl3 (F-3), CHCl3:EtOAc 1:1 (F-4), EtOAc (F-5)
and MeOH (F-6). Successive flash chromatography of fraction F-2 (12.1 g) using CHCl3:EtOAc 8:2,
CHCl3:EtOAC 7:3, CHCl3:EtOAc 1:1, EtOAc and MeOH,
afforded compound 1 (48.2 mg) and acetyl aleuritolic acid (95.0 mg). Fraction F-3 (10.4 g) was purified over Sephadex LH-20 by elution with MeOH to afford three fractions. Successive chromatography over Si gel of sub-fraction F-3(2) (3.75 g) using hexane:EtOAc 7:3 as an isocratic eluting mixture, yielded compound 3
(13.8 mg). Silica gel column chromatography of the sub-fraction F-3(3) (1.54 g) using CH2Cl2:EtOAc 8:2,
CH2Cl2:EtOAc 7:3, CH2Cl2:EtOAc 1:1, EtOAc and MeOH,
yielded compound 2 (22.4 mg).
The EtOH extract (32.1 g) was suspended in a mixture of MeOH:H2O 1:1 and submitted to partition with hexane,
CHCl3, and EtOAc. The EtOAc fraction (3.6 g) was further
purified over Sephadex LH-20 by elution with MeOH to afford five fractions. Fraction F-3 (1.10 g) was fractionated on a SPE C18 cartridge by elution with MeOH:H2O 9:1,
MeOH:H2O 1:1 and H2O to afford compounds 4 (17.1 mg)
and 5 (11.6 mg). Fraction F-5 (977.3 mg) was submitted to the same procedure to afford kaempferol-3-O-glucoside (7.2 mg) and ombuin-3-O-rutinoside (10.4 mg).
Cytotoxic assays
Tumor cell lines HCT-116, OVCAR-8, and SF-295 were provided by the National Cancer Institute (Bethesda, MD, USA). Cancer cells were maintained in RPMI 1640 medium supplemented with 10% fetal bovine serum, 2 mmol L−1
glutamine, 100 U mL−1 penicillin, and 100 µg mL−1
streptomycin, at 37 °C with 5% CO2. Cytotoxicity of
compound 1 was evaluated using the 3-(4,5-dimethyl-2-thiazolyl)-2,5-diphenyl-2H-tetrazolium bromide (MTT) reduction assay.8 For all experiments, cells were plated
in 96 well plates (105 cells per well for adherent cells
or 3 × 10⁵ cells per well for suspended cells in 100 µL
of medium). The tested compounds (0.05-25 g mL−1)
positive control. Control groups received the same amount of DMSO. After 69 h of incubation, the supernatant was replaced by fresh medium containing MTT (0.5 mg mL−1)
for 3 h. The solid MTT formazan product formed was dissolved in 150 µL of DMSO, and absorbance was measured at 595 nm.
15-Oxo-17(10’-α-pinenyl)-ent-kauran-18-oic acid (1)
White solid; m.p. 122.3-123.9 °C; [α]D25−56.1 (c 0.1,
CH2Cl2); IR (KBr) νmax / cm−
1 2985, 2914, 2866, 1726,
1696, 1459, 1446, 1386, 1265, 1178, 1109, 1065, 1002, 950, 885, 802, 704, 665; 1H NMR (500 MHz, CDCl
3)
and 13C NMR (125 MHz, CDCl
3) see Tables 1 and 2;
HRESIMS (negative mode) m/z 451.3250 [M − H]+ (calcd.
for C30H43O3, 451.3213).
3-Oxo-15,16-epoxy-4α,12-dihydroxy-ent-neo -clerodan-13(16),14-diene (2)
Yellow solid; m.p. 115.5-117.0 °C; [α]D25−3.1 (c 0.1,
MeOH); IR (KBr) νmax / cm−
1 3447, 2935, 2869, 1707,
1453, 1375, 1161, 1083, 940; 1H NMR (300 MHz, CDCl 3)
and 13C NMR data (75 MHz, CDCl
3) see Tables 1 and 2;
HRESIMS (positive mode) m/z 357.2038 [M + Na]+ (calcd.
for C20H30O4Na, 357.2042).
15,16-Epoxy-3α,4α,12-trihydroxy-ent-neo -clerodan-13(16),14-diene (3)
Colorless solid; m.p. 129.7-131.2 °C; [α]D
25−2.0 (c 0.1,
MeOH); IR (KBr) νmax / cm−1 3287, 2926, 2865,1597,
1502, 1440, 1386, 1302, 1161, 1119, 1067, 1026, 1009, 971, 956, 875, 790, 718, 661; 1H NMR (500 MHz, MeOD)
and 13C NMR (125 MHz, MeOD) see Tables 1 and 2;
HRESIMS (positive mode) m/z 359.2168 [M + Na]+ (calcd.
for C20H32O4Na, 359.2193).
3α,4α,15,16-Tetrahydroxy-ent-neo-cleroda-13E-ene (4)
White solid; m.p. 106.5-108.2 °C; [α]D25 −9.7 (c 0.1,
MeOH); IR (KBr) νmax / cm−
1 3349, 2931, 1714, 1653, 1453,
1378, 1276, 1093, 1051, 1011, 978, 910, 865, 721; 1H NMR
(300 MHz, MeOD) and 13C NMR (75 MHz, MeOD) see
Tables 1 and 2; HRESIMS (positive mode) m/z 363.2524 [M + Na]+ (calcd. for C
20H36O4Na, 363.2506).
3,12-Dioxo-15,16-epoxy-4α-hydroxy-6-(β -glucopyranosyl)-ent-neo-clerodan-13(16),14-diene (5)
White solid; m.p. 108.6-109.8 °C; [α]D
25−82.0 (c 0.1,
MeOH); IR (KBr) νmax / cm−1 3414, 2926, 1699, 1664,
1377, 1151, 1028, 870, 796; 1H NMR (300 MHz, MeOD)
and 13C NMR (75 MHz, MeOD) see Tables 1 and 2;
HRESIMS (positive mode) m/z 533.2357 [M + Na]+ (calcd.
for C26H38O10Na 533.2409).
Results and Discussion
Compound 1, a white solid, has a molecular formula of C30H44O3 as established by the ion at m/z 451.3250
[M − H]+ in the high-resolution electrospray ionisation mass
spectrometry (HRESIMS). The IR spectrum showed bands at 1728 and 1697 cm−1 relative to carbonyl groups and at
3500 cm−1 relative to hydroxyl. The 1H NMR spectrum of 1
displayed four distinct methyl singlets at dΗ 1.26 (CH3-8’),
1.15 (CH3-19), 1.10 (CH3-20) and 0.82 (CH3-9’), and an
olefinic proton at dΗ5.21 (br s, H-3’), besides several
signals attributable to hydrogens attached to sp3 carbons
(Table 1). The 13C NMR spectrum with the aid of DEPT
and HMQC experiments indicated thirty signals relative to two carbonyls at dC 184.9 (C-18) and 224.1 (C-15), two
unsaturated carbons at dΧ 148.0 (C-2’) and 116.6 (C-3’),
and twenty six other signals for non functionalized sp3
carbons (four methyls, twelve methylenes, six methines and four quaternaries) (Tables 1 and 2). The HMBC spectrum provided evidences for the ABC rings of a kaurane-type moiety by the long-range correlations between the hydrogens of the methyl at dΗ1.10 (H-20) with the
methylene carbon at dΧ 38.6 (C-1) and the methines at
dΧ 49.5 (C-5) and 52.3 (C-9), besides the correlations of
the methyl at dΗ 1.15 (H-19) with the methylene carbon at
dC 36.9 (C-3) and the methine at dΧ 49.5 (C-5), and with
the carbonyl at dΧ 184.9 (C-18). Moreover, the correlations
between the hydrogen at dΗ 1.20 (H-9), with the carbons
atdΧ 18.0 (C-20), 49.5 (C-5), 38.6 (C-1), 24.8 (C-12) and
37.4 (C-14), and the hydrogen at dΗ 2.48 (H-13) with the
carbons at dΧ 53.2 (C-8), 17.7 (C-11) and the carbonyl at
dΧ 224.1 (C-15) confirmed this suggestion. From the above
data, the two carbonyl groups were undoubtedly located at C-18 and C-15, respectively. On the basis of spectroscopic comparison of the diterpene moiety with those related for the ent-kaur-16-en-15-oxo-18-oic acid a great similarity has been observed between both compounds, and confirmed the partial structure.9
Additionally, were also observed in the HMBC spectrum the correlations of the methine at dΗ 2.10 (H-16)
with carbons at dΧ 24.8 (C-12), 53.2 (C-8) and 35.5 (C-10’),
besides the correlations of the olefinic methine at dΗ 5.21
(H-3’) with carbons at dΧ35.5 (C-10’), 45.8 (C-1’) and 41.0
(C-5’), and those of remaining methyl groups at dΗ 0.82
(H-9’) and 1.26 (H-8’) with carbons dΧ 45.8 (C-1’) and
41.0 (C-5’). On the basis of the foregoing evidence and comparison with the literature data, the monoterpene moiety was characterized as α-pinene.10 Thus, the structure
Table 1. 1H NMR chemical shifts of compounds 1-5 (d in ppm, J in Hz)
H 1
a,c 2b,c 3a,d 4b,d 5b,d
dH dH dH dH dH
1 0.86 (td, 12.8, 3.30) 1.76 (m)
1.68 (m) 2.22 (m)
1.19 (m) 1.54 (m)
1.33 (m) 1.58 (qd, 13.1, 5.2)
1.81 (qd, 13.2, 4.3) 2.08 (m) 2 1.63 (m) 2.39 (ddd, 14.2, 4.9, 1.9)
2.56 (td, 14.2, 4.9)
1.18 (m) 1.58 (m)
1.63 (td, 14.2, 7.3) 2.03 (ddd, 14.2, 7.3, 1.7)
2.33 (dq, 14.2, 2.0) 2.45 (td, 14.2, 6.8)
3 1.60 (m)
1.79 (m)
− 3.48 (t, 2.5) 3.48 (brs) −
4 − − − − −
5 1.77 (m) − − − −
6 1.25 (m)
1.76 (m)
1.50 (m) 1.64 (m)
1.43 (m) 1.34 (td, 13.0, 4.1) 1.67 (dt, 13.0, 3.1)
3.95 (dd, 11.6, 3.9)
7 1.24 (m)
1.92 (m)
1.44 (m) 1.42 (m)
1.32 (m) 1.44 (m)
1.35 (m) 1.49 (m)
1.62 (dd, 13.5, 2.4) 2.04 (m)
8 − 1.70 (m) 1.82 (m) 1.50 (m) 2.05 (m)
9 1.20 (s) − − − −
10 − 2.51 (dd, 12.4, 2.9)
1.59 (m)
1.38 (m) 1.87 (m) 2.64 (dd, 13.3, 2.6)
11 1.53 (m) 1.95 (dd, 15.7, 9.0) 1.77 (dd, 15.1, 6.8) 1.92 (dd, 15.1, 6.8)
1.40 (d, 15.9) 1.51 (d, 15.7)
2.86 (d, 16.1) 2.92 (d, 16.1)
12 1.65 (m)
1.67 (m)
4.92 (dd, 9.0, 1.5) 4.74 (t, 6.2) 2.05 (m) −
13 2.48 (m)
1.30 (d, 13.8)
− − − −
14 12.43 (d, 13.8) 6.38 (brs) 6.48 (d, 0.9) 5.47 (t, 6.8) 6.78 (br s)
15 − 7.38 (m) 7.46 (t, 1.5) 4.14 (d, 6.8) 7.59 (br s)
16 2.10 (m) 7.38 (m) 7.48 (s) 4.10 (s) 8.02 (br s)
17 1.28 (m)
1.94 (m)
0.79 (d, 6.7) 0.92 (d, 6.7) 0.80 (d, 6.0) 0.95 (d, 6.6)
18 − 1.37 (s) 1.06 (s) 1.19 (s) 1.45 (s)
19 1.15 (s) 0.81 (s) 1.13 (s) 1.12 (s) 0.97 (s)
20 1.10 (s) 0.74 (s) 0.76 (s) 0.75 (s) 0.87 (s)
1’ 2.03 (m) − − − 4.45 (d, 7.7)
2’ − − − − 3.13 (dd, 9.2, 7.9)
3’ 5.21 (br s) − − − 3.33 (m)
4’ 2.18 (d, 17.4)
2.24 (d, 17.4)
− − − 3.27 (q, 9.5)
5’ 2.08 (m) − − − 3.36 (m)
6’ − − − − 3.66 (dd, 11.8, 5.4)
3.85 (dd, 11.8, 2.2)
7’ 1.12 (m)
2.35 (m)
− − − −
8’ 1.26 (s) − − − −
9’ 0.82 (s) − − − −
10’ 1.98 (m)
2.05 (m)
− − − −
a 1H NMR data were recorded at 500 MHz; b 1H NMR data were recorded at 300 MHz; csolvent CDCl
3; dsolvent MeOD.
from NOESY data and comparison with kaurane-type diterpenoids. In this spectrum were observed correlation between the both methyls groups at dΗ 1.15 (CH3-19)
and 1.10 (CH3-20), as well as the correlation between the
hydrogens at dH 1.77 (H-5) and 1.20 (H-9). The orientation
of the monoterpene group at C-16 was assigned as β due the strong nOe correlations observed between the hydrogens
at dΗ2.10 (H-16) and 1.30 (H-14); and dΗ 2.43 (H-14) and
1.10 (CH3-20) (Figure 2). This finding was confirmed by
the chemical shift observed for C-12 at dΧ 24.8 that was
shielded in comparison to the ent -kaur-16-en-15-oxo-18-oic acid at dΧ 32.4. This effect can be explained by the
β orientation.11,12 Thus, compound 1 was determined to be
the new 15-oxo-17(10’-α-pinenyl)-kauran-18-oic acid.
Compound 2 was obtained as a yellow solid. Its molecular formula C20H30O4 was determined by HRESIMS
by the ion at m/z 357.2038 [M + Na]+. The IR spectrum
displayed diagnostic absorption bands referring to hydroxyl and carbonyl groups at 3447 and 1707 cm−1, respectively.
The 13C NMR spectrum displayed twenty signals associated
with four methyl groups (dΧ 15.3, 16.0, 17.9 and 21.9), five
methylenes and six methines (one of which oxygenated at dΧ 63.4 and three olefinic at dΧ 138.4, 131.5 and 108.4).
In addition, five non-hydrogenated carbons including a carbonyl (dΧ 216.0) were observed (Table 2). The
1H NMR
spectrum revealed signals consistent with the presence of four methyls, three angular at dΗ 0.74 (s, CH3-20), 0.81 (s,
CH3-19) and 1.37 (s, CH3-18), and a tertiary at dΗ 0.79 (d,
J 6.7 Hz, CH3-17), an oxymethine at dΗ4.92 (dd, J 5.0,
1.5 Hz, H-12), and three olefinic methines, one at dΗ 6.38
(br s, H-14) and two overlapped at dΗ7.38 (m, H-15 and
H-16) (Table 1). Signals relative to a subsystem constituted by five hydrogens belonging two diastereotopic methylenes at dΗ 2.56 (dt, J 14.2, 4.9 Hz, H-2β), 2.39 (ddd, J 14.2,
4.9, 1.9 Hz, H-2α), 2.22 (m, H-1β), and 1.68 (m, H-1α), and a methine at dΗ 2.51 (dd, J 12.4, 2.9 Hz, H-10), were
observed by analysis of the 1H-1H COSY experiment. The
deshielded diastereotopic protons of a methylene at dΗ 2.56
and 2.39 (2H-2) were attributed to the methylene “α” to a ketone group, due to the constant of 14.2 Hz. Furthermore, the coupling between both methylenes at dΗ 1.64 (m, H-6eq)
and 1.50 (m, H-6ax), 1.42 (H-7eq) and 1.44 (and H-7ax),
the latter showing correlation with the methine at dΗ 1.70
(m, H-8), revealed another subsystem of five hydrogens, which were placed between two quaternary sp3 carbon
atoms. In addition, the remaining methylene at dΗ 1.95
(dd, J 15.7, 9.0 Hz, H-11eq) and 1.59 (m, H-11ax) showed
correlations with the oxymethine at dΗ 4.92 (dd, J 9.0,
1.5 Hz, H-12). The proposed assignment for the clerodane skeleton contained a β-monosubstituted furan moiety9,13
was supported by analyzing the HMBC spectrum, through the long-range correlations of the methyl groups at dΗ 0.74
(H-20) with carbons at dΧ 45.9 (C-11), 42.2 (C-10) and
37.3 (C-8), and those of the methyl at dΗ 0.79 (H-17) with
carbons at dΧ 39.9 (C-9) and 26.8 (C-7). The allocation of
the hydroxyl group at C-12 was deduced on the basis of the correlations of the oxymethine at dΗ 4.92 (H-12) with the
carbon at dΧ 39.9 (C-9), and with the carbons of the furan
moiety at dΧ 108.4 (C-14) and 138.4 (C-16). On the other
hand, the correlations of the methyl at dΗ 1.37 (CH3-18)
and hydrogens of the methylene at dΗ 1.68 and 2.22 (2H-1)
with the carbonyl at dΧ 216.0 (C-3), besides the concomitant
correlations of the hydrogens at dΗ 0.81 (CH3-19), 2.51
(H-10), 2.39 and 2.56 (2H-2) with the non-hydrogenated oxygenated carbon at dΧ 81.8 (C-4), are consistent with
the presence of a carbonyl at C-3 and a hydroxyl group at C-4. The configuration of the hydroxyl at C-4 α-oriented was definitively determined on the basis of diagnostic nOe correlations observed between the methyl at dΗ 1.37 (H-18)
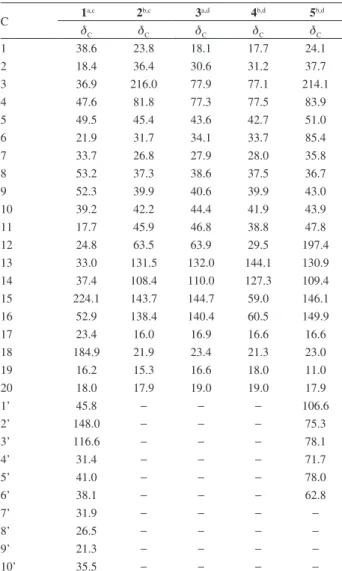
and the methines at dΗ 2.51 (H-10) and 4.92 (H-12) in the Table 2.13C NMR chemical shifts of compounds 1-5 (d in ppm)
C 1
a,c 2b,c 3a,d 4b,d 5b,d
dC dC dC dC dC
1 38.6 23.8 18.1 17.7 24.1
2 18.4 36.4 30.6 31.2 37.7
3 36.9 216.0 77.9 77.1 214.1
4 47.6 81.8 77.3 77.5 83.9
5 49.5 45.4 43.6 42.7 51.0
6 21.9 31.7 34.1 33.7 85.4
7 33.7 26.8 27.9 28.0 35.8
8 53.2 37.3 38.6 37.5 36.7
9 52.3 39.9 40.6 39.9 43.0
10 39.2 42.2 44.4 41.9 43.9
11 17.7 45.9 46.8 38.8 47.8
12 24.8 63.5 63.9 29.5 197.4
13 33.0 131.5 132.0 144.1 130.9
14 37.4 108.4 110.0 127.3 109.4
15 224.1 143.7 144.7 59.0 146.1
16 52.9 138.4 140.4 60.5 149.9
17 23.4 16.0 16.9 16.6 16.6
18 184.9 21.9 23.4 21.3 23.0
19 16.2 15.3 16.6 18.0 11.0
20 18.0 17.9 19.0 19.0 17.9
1’ 45.8 − − − 106.6
2’ 148.0 − − − 75.3
3’ 116.6 − − − 78.1
4’ 31.4 − − − 71.7
5’ 41.0 − − − 78.0
6’ 38.1 − − − 62.8
7’ 31.9 − − − −
8’ 26.5 − − − −
9’ 21.3 − − − −
10’ 35.5 − − − −
a 13C NMR data were recorded at 125 MHz; b 13C NMR data were recorded at 75 MHz; csolvent CDCl
3;dsolvent MeOD.
H
H H CH3 CH3
H2OC O
CH3
CH3 H
H
11
12
13 14
15
16 17
8 9
20 19
5
NOESY experiment (Figure 3). In this spectrum were also observed important correlations between the hydrogen at dΗ2.51 (H-10) with the hydrogens at dH 1.37 (H-18) and
1.67 (H-12), as well as correlations between the hydrogens at dΗ 0.74 (H-20) with the hydrogens at dH 0.81 (H-19)
and 1.68 (H-1a) (Figure 3) charactering a trans-decalin system. These data suggested that the lateral chain at C-19 was β-oriented (equatorial), confirming the final structure of compound 2 as the new 3-oxo-15,16-epoxy-4α ,12-dihydroxy-ent-neo-clerodan-13(16),14,diene.14
Compound 3 was obtained as a colorless solid. The molecular formula C20H32O4 was established by HRESIMS
from the ion at m/z 359.2168 [M + Na]+. The IR spectrum
showed the presence of a hydroxyl band at 3287 cm−1.
Analysis of the 13C NMR spectrum of 3 revealed that
the chemical shifts were similar to those observed for compound 2 (Table 2), except for the absence of the signals relative to the carbonyl and the presence of an extra oxymethine at dΧ 77.9 (C-3) (Table 2). The 1H NMR
spectrum corroborated these observations, through the presence of an additional signal for an oxymethine at dΗ 3.48
(t, J 2.5 Hz, H-3). The suggestion that the carbonyl group at C-3 for compound 2 has been reduced in 3, was confirmed by the diagnostic long-range correlations in the HMBC spectrum observed between the oxymethine proton at dΗ
3.48 (H-3) and the carbons at dΧ 18.1(C-1), 43.6 (C-5) and
23.4 (C-18). The relative stereochemistry of the hydroxyl group at C-3 was defined as α-oriented (equatorial) by the small value of the coupling constant (J 2.5 Hz) of the triplet observed for H-3. As for compound 2, the NOESY experiment showed the same correlations between the hydrogens at dΗ1.38 (H-10) with the hydrogens at dH 1.06
(H-18) and 4.74 (H-12), as well as correlations between the hydrogens at dΗ 0.76 (CH3-20) with the hydrogens at
dH 1.13 (CH3-19) and 1.54 (H-1a), and suggested that the
lateral chain at C-19 was also β-oriented (equatorial). Thus, the final structure of compound 3 was elucidated as the
new 15,16-epoxy-3α,4α,12-trihydroxy-ent-neo -clerodan-13(16)14-diene.
Compound 4 was obtained as a white solid. The molecular formula C20H36O4 was established by HRESIMS
by the ion at m/z 363.2524 [M + Na]+. The IR spectrum
showed hydroxyl and C=C stretching bands at 3349 and 1653 cm−1, respectively. The 1H NMR spectrum signals
indicated a close relationship with those observed for compound 3, mainly relative to the decalin system (Table 1). The differences found were related to the presence of just one olefinic proton at dΗ 5.47 (t, J 6.8 Hz, H-14), and two
oxymethylenes at dΗ 4.14 (d, J 6.8 Hz, H-15) and 4.10 (s,
2H-16), besides the disappearance of the signals relative to the furan moiety and the oxymethine at C-12. These data suggested that the furan moiety of compound 3 was opened in 4. This was confirmed by comparison of their 13C NMR
data, since the typical furan values of compound 2 were here replaced by two oxymethylene carbons at dΧ 59.0 (C-15)
and 60.5 (C-16), and a double-bond at dΧ 144.1 (C-13) and
127.3 (C-14) on 3 (Table 2). The NOESY experiment showed correlations between the hydrogen at dΗ 1.87 (H-10) with the
hydrogens at dΗ 1.50 (H-8), 2.03 (H-2a), 1.67 (H-6b) and
1.19 (CH3-18). In addition, it was observed the correlations
between the hydrogens at dΗ 0.75 (CH3-20) with hydrogens
at dΗ 1.12 (CH3-19), 1.40 (H-11b), 1.49 (H-7a) and 1.58
(H-1a), and the correlation of the hydrogen at dΗ 3.48 (H-3)
with hydrogens at dH 1.19 (CH3-18). From the above data we
can assume that the hydroxyls groups at C-3 and C-4, and the lateral chain at C-19 have the same configuration as in compound 3, so compound 4 was thus characterized as the new 3α,4α,15,16-tetrahydroxy-ent-neo-(E)-cleroda-13-ene.
Compound 5 was obtained as a white solid with a molecular formula C26H38O10 as determined by the peak
at m/z 533.2409 [M + Na]+.The IR spectrum implied the
presence of hydroxyl and carbonyl groups at 3414 and 1699 cm−1, respectively. From the 1H NMR spectrum, a
monossubstituted furan system was defined by the typical signals at dΗ 8.02 (br s, H-16), 7.59 (br s, H-15) and 6.78
(br s, H-14). The magnitude of geminal coupling constants observed for the deshielded methylene groups at dΗ 2.45 (td,
J 14.2, 6.8 Hz, H-2eq), 2.33 (dq, J 14.2, 2.0 Hz, H-2ax), 2.92
(d, J 16.1 Hz, H-11eq), and 2.86 (d, J 16.1 Hz, H-11ax) were
characteristic of “α” methylene ketone groups (Table 1). In addition, an β-anomeric proton at dΗ 4.45 (d, J 7.7 Hz,
H-1’), and the signals in the region of dΗ4.45-3.13,
suggested the presence of a sugar unit, that was determined to be the glucose based on the chemical shifts of the 1H
and 13C NMR spectrum in comparison with literature.15 The
β-anomeric configuration was judged by the larger value of the coupling constant (J 7.7 Hz) of the doublet related to the anomeric hydrogen.
CH3 HO
H
H H
CH3
CH3 CH3
O
HO
H
O
H
1 2
3 4 5
6 7
8 10
12 13 14
15
17 18
19
20 16
The location of the hydroxyl group at C-4 was established by the concomitant long-range correlations of hydrogens at dΗ 0.97 (CH3-19), 2.64 (H-10) and 3.95 (H-6)
with the carbon at dΧ 83.9 (C-4), in the HMBC spectrum.
Moreover, the correlations between the hydrogen at dΗ
1.45 (CH3-18) with the carbons at dΧ 51.0 (C-5) and 214.1
(C-3), besides the correlation of the hydrogens at dH 0.97
(CH3-19) and the anomeric proton at dΗ 4.45 (H-1’) with the
carbon at dΧ 85.4 (C-6) confirmed the locations of carbonyl
and glucosyl at C-3 and C-6, respectively. On the other hand, the correlations observed between the hydrogens at dΗ 0.87 (CH3-20) and 2.64 (H-10) with the carbon at dΧ 47.8
(C-11), determined the location of the other carbonyl group at C-12. The equatorial orientations of the glucosyl group and hydroxyl groups at C-6 and C-3, respectively, were determined based on the value of the coupling constant observed for the oxymethine H-6 (J 11.6, 3.9 Hz), and by nOe correlations observed between the hydrogens at dΗ 2.64 (H-10) with those at dΗ 1.45 (CH3-18), 2.05 (H-8)
and 3.95 (H-6). Thus, compound 5 was characterized as the new 3,12-dioxo-15,16-epoxy-4α-hydroxy-6-(β -glucopyranosyl)-ent-neo-clerodan-13(16),14-diene.
The isolation of diterpene dimers is reported to several species of different genera, as symmetrical compounds with icexetane, labdane and kaurane skeletons.16-19 The occurrence
of asymmetrical dimers are more restricted, and generally involve the junction of two diterpene monomers.20,21
In Croton genus, this feature is limited to the species
C. tonkinensis and C. micans,as symmetrical structures
of ent-kaurene.22,23 The structure of an asymmetrical dimer
formed by the junction between diterpene and monoterpene moities, as it is the case for compound 1, is a feature never reported in the literature before.
The cytotoxic activity of compound 1 was evaluated against colorectal adenocarcinoma (HCT-116), ovarian carcinoma (OVCAR-8) and glioma (SF-295) cell lines, exhibiting IC50 values of 7.14, 8.19 and > 10 µg mL−1,
respectively. Previous studies showed the cytotoxicityof
ent-kaur-16-en-15-oxo-18-oic acid against promyelocytic leukemia (L-60), glyoblastoma (SF-295), colon cancer (HCT-8) and melanoma (MDAMB-435) cell lines.24 Since
then the ent-kaur-16-en-15-oxo-18-oic acid is one monomer of compound 1 our results are in agreement with these findings, and with the cytotoxicity associated to kaurenoic acid derivatives.25-28
Conclusions
Chemical investigation of C. limae yielded an unusual asymmetrical dimer of a kaurane derivative with the monoterpene α-pinene (1), besides four new
clerodanes (2-5). Based on the data collected from three independent experiments, the results showed that compound 1 exhibited a moderate cytotoxic effect against HCT-116 and OVOCAR-8 cancer cell lines with IC50 values
of 7.14, 8.19 and > 10 µg mL−1, respectively. These facts
are in agreement with the knowledge that the Croton genus is an abundant source of several classes of structurally complex and bioactive diterpenes, which justify the efforts in pursuing the phytochemical study of other Croton species from the northeastern Brazil.
Supplementary Information
The NMR and mass spectra of compounds 1-5 are available at http://jbcs.sbq.org.br as a free-access PDF file.
Acknowledgements
The authors are grateful to CNPq/CAPES/PADCT/ PRONEX/FUNCAP/FINEP for the fellowships and financial support. We also thank to CENAUREMN and LEMANOR of Universidade Federal do Ceará, for acquisition of NMR and high resolution mass spectra, respectively.
References
1. Gomes, A. N.; Sales, M. F.; Berry, P. E.; Brittonia2010, 62, 206.
2. Silva-Filho, F. A.; Braz-Filho, R.; Silveira, E. R.; Lima, M. A. S.; Magn. Reson. Chem. 2011, 49, 370.
3. Silva-Filho, F. A.; Silva Junior, J. N.; Braz-Filho, R.; Simone, C. A.; Silveira, E. R.; Lima, M. A. S.; Helv. Chim. Acta2013, 96, 1146.
4. Uchoa, P. K. S.; Silva Junior, J. N.; Silveira, E. R.; Lima, M. A. S.; Braz-Filho, R.; Costa-Lotufo, L. V.; Araujo, A. J.; Moraes, M. O.; Pessoa, C.; Quim. Nova2013, 36, 778. 5. Demirezer, L. O.; Gurbuz, F.; Guvenalp, Z.; Stroch, K.;
Zeeck, A.; Turk. J. Chem. 2006, 30, 525.
6. Matsuda, H.; Morikawa, T.; Toguchida, I.; Yoshikawa, M.; Chem. Pharm. Bull. 2002, 50, 788.
7. Mcclean, S.; Dumont, M. P.; Reynolds, W. F.; Can. J. Chem.
1987, 65, 2519.
8. Mosmann, T. J.; J. Immunol. Methods 1983, 65, 55.
9. Monte, F. J. Q.; Dantas, E. M. G.; Braz-Filho, R.; Phytochemistry 1988, 27, 3209.
10. Lee, S. G.; Magn. Reson. Chem.2002, 40, 311.
11. Han, Q.; Lu, Y.; Zhang, L.; Zhengb, Q.; Suna, H.; Tetrahedron Lett. 2004, 45, 2833.
13. Krebs, H. C.; Ramiarantsoa, H.; Phytochemistry 1996, 41, 561. 14. Maciel, M. A. M.; Cortez, J. K. P. C.; Gomes, E. F. S.; Rev.
Fitos2006, 2, 54.
15. Oliveira, P. R. N.; Testa, G.; Sena, S. B.; Costa, W. F.; Sarragioto, M. H.; Santin, S. M. O.; Souza, M. C.; Quim. Nova2008, 31, 755.
16. Suresh, G.; Babu, K. S.; Rao, M. S. A.; Rao, V. R. S.; Yadav, P. A.; Nayak, V. L.; Ramakrishna, S.; Tetrahedron Lett.2011, 52, 5016.
17. Zhang, B.; Wang, H.; Luo, X.; Du, Z.; Shen, J.; Wu, H.; Zhang, X.; Helv. Chim. Acta2012, 95, 1672.
18. Sato, K.; Sugawara, K.; Takeuchi, H.; Park, H.; Akiyama, T.; Koyama, T.; Aoyagi, Y.; Takeya, K.; Tsugane, T.; Shimura, S.; Chem. Pharm. Bull. 2008, 56, 1691.
19. Hong, S. S.; Lee, S. A.; Lee, C.; Han, X. H.; Choe, S.; Kim, N.; Lee, D.; Lee, C.; Kim, Y.; Hong, J. T.; Lee, M. K.; Hwang, B. Y.; J. Nat. Prod.2011, 74, 2382.
20. Hasan, C. M.; Healey, T. M.; Waterman, P. G.; Phytochemistry 1985, 24, 192.
21. Piacente, S.; Aquino, R.; Tommasi, N.; Pizza, C.; Ugaz, O. L.; Orellana, D. C.; Mahmood, N.; Phytochemistry 1994, 36, 991. 22. Vivas, J.; Sojo, F.; Chavez, K.; Suarez, A. I.; Arvelo, F.; Lett.
Drug Des. Discovery2013, 10, 693.
23. Thuong, P. T.; Pham, T. H. M.; Le, T. V. T.; Dao, T. T.; Dang, T. T.; Nguyen, Q. T.; Oh, W. K.; Bioorg. Med. Chem. 2012, 22, 1122.
24. Santos, H. S.; Barros, F. W. A.; Albuquerque, M. R. J. R.; Bandeira, P. N.; Pessoa, C.; Braz-Filho, R.; Monte, F. J. Q.; Leal-Cardoso, J. H.; Lemos, T. L. G.; J. Nat. Prod. 2009, 72, 1884.
25. Dutra, L. M.; Bomfim, L. M.; Rocha, S. L. A.; Nepel, A.; Soares, M. B. P.; Barison, A.; Costa, E. V.; Bezerra, D. P.; Bioorg. Med. Chem. 2014, 24, 3315.
26. Fernandes, V. C.; Pereira, S. I. V.; Copped, J.; Martins, J. S.; Rizo, W. F.; Beleboni, R. O.; Marins, M.; Pereira, P. S.; Pereira, A. M. S.; Fachin, A. L.; GMR, Genet. Mol. Res. 2013, 12, 1005. 27. Cavalcanti, B. C.; Ferreira, J. R. O.; Moura, D. J.; Rosa, R. M.; Furtado, G. V.; Burbano, R. R.; Silveira, E. R.; Lima, M. A. S.; Camara, C. A. G.; Saffi, J.; Henriques, J. A. P.; Rao, V. S. N.; Costa-Lotufo, L. V.; Moraes, M. O.; Pessoa, C.; Mutat. Res., Genet. Toxicol. Environ. Mutagen. 2010, 701, 153.
28. Rosseli, S.; Maggio, A.; Eiroa, C.; Formisano, C.; Bruno, M.; Irace, C.; Maffettone, C.; Mascolo, N.; Planta Med.2008, 74, 1285.