Article
Printed in Brazil - ©2016 Sociedade Brasileira de Química 0103 - 5053 $6.00+0.00
*e-mail: [email protected]
Efficient Mineralization of Paracetamol Using the Nanocomposite TiO
2/Zn(II)
Phthalocyanine as Photocatalyst
Marcela D. França, Lidiaine M. Santos, Tatiana A. Silva, Karen A. Borges, Valdislaine M. Silva, Antonio O. T. Patrocinio, Alam G. Trovó and Antonio E. H. Machado*
Laboratório de Fotoquímica e Ciência dos Materiais, Instituto de Química, Universidade Federal de Uberlândia, CP 563, 38400-902 Uberlândia-MG, Brazil
The photocatalytic performance of a composite based on the association of TiO2 and 2.5 wt.%
of zinc(II) phthalocyanine (TiO2/ZnPc) was evaluated towards the mineralization of paracetamol
and compared to that observed for the bare oxide in different pH and H2O2 concentrations. The
results show that the photocatalytic performances were influenced by the pH, with maximum efficiency around the isoelectric point. Mineralization efficiencies between 86-91% was obtained using TiO2/ZnPc in pH 5.5-6.8, with 33 mg L
-1 of H
2O2, ca. 15% higher than that observed with
TiO2. The mineralization efficiencies using bare TiO2 and TiO2/ZnPc were respectively 112 and
18% lower in the absence of H2O2. The better performance of TiO2/ZnPc is related to its extended
light absorption and non-uniform coating of the TiO2 surface by ZnPc aggregates. Above pH 6.8,
the mineralization efficiencies decrease for both photocatalysts, although the consumption of H2O2
remains above 90%, due to its decomposition in alkaline pH.
Keywords: mineralization, paracetamol, heterogeneous photocatalysis, role of pH and hydrogen peroxide, TiO2/zinc(II) phthalocyanine nanocomposite
Introduction
Since initial studies by Fujishima and Honda,1 heterogeneous photocatalysis2 has attracted considerable attention due to its many technological applications, such as H2 production,3-5 CO2 reduction,6-8 environmental remediation,9-12 among others.
TiO2 has been widely used in heterogeneous photocatalysis due its low cost, low toxicity, chemical and photochemical stability, usually expressive photocatalytic activity and versatility.2,10,12,13 Its main limitation as photocatalyst is related to the lack of absorption in the visible region, which limits its use under solar irradiation. Several strategies have been employed to overcome this limitation, including doping3 and production of nanocomposites.9,12-14
TiO2-based photocatalysis has been specially used in environmental remediation for the removal of recalcitrant and hazardous organic pollutants in wastewater.9,15 The radicals produced from its excitation by light are able to efficiently oxidize organic pollutants leading in some cases to a complete mineralization of the organic matter.
Paracetamol (N-acetyl-p-aminophenol, PCT), Figure 1a, among other pharmaceutical products, their metabolites, pesticides, hormones and herbicides,9,16-20 is calling attention due to its persistence in the environment and the inability of the sewage treatment plants in removing this contaminant, which may result in bioaccumulation and harmful consequences for ecosystems.17,20-22
Although PCT is metabolized mainly by the liver, up to 68% of this drug tends to be excreted in the urine when ingested within permitted levels.21-24 It should be emphasized that one of the routes of paracetamol metabolism produces highly toxic metabolites able to bind covalently to cysteine present in proteins.23,25
Several studies have reported the application of TiO2-based photocatalysis in PCT degradation. In these studies, however, it is found a wide variation in the results due to different experimental conditions employed. Jagannathan et al.,26 for example, evaluated PCT degradation by different methodologies, using heterogeneous photocatalysis mediated by TiO2-P25 (1 g L-1) at natural pH (approximately pH 6.8) and in experimental conditions similar to those applied in the present study. The authors achieved 71% of PCT mineralization. Yang et al.27 achieved 91% of PCT mineralization using heterogeneous photocatalysis also mediated by TiO2-P25 (0.4 g L-1) of an aqueous solution containing 604 mg L-1 of PCT, at pH 5.6. However, in this case the reactions were performed using quartz reactors and high energy UVC radiation. Dalmázio et al.28 achieved only 35% of PCT mineralization, also using UVC.
In the present study, we compared the effectiveness of a photocatalyst based on the association between TiO2-P25 and aggregates of the dye zinc(II) phthalocyanine (Figure 1b) (TiO2/ZnPc 2.5 wt.%), which was shown to be exceptional in promoting the degradation of different substrates.29-31 The efficiency of this nanocomposite in promoting PCT mineralization was compared to that presented by the bare TiO2-P25, and the role of pH and addition of hydrogen peroxide was systematically investigated.
Experimental
Reagents
All solutions were prepared using ultrapure water. Hydrogen peroxide 30% v/v, sulfuric acid 98%, ammonium metavanadate 99%, sodium hydroxide 99%, methanol UV/high performance liquid chromatography (HPLC) 99.8% and sodium sulfite 97.0% were acquired from Vetec Química Fina. Paracetamol (British Pharmacopoeia (BP) 2008/ United States Pharmacopeia (USP) 31) 98.96% was purchased from DEG Importação de Produtos Químicos Ltda.
The nanocomposite TiO2/zinc(II) phthalocyanine 2.5 wt.% (TiO2/ZnPc) was prepared using a methodology previously described, which consists in the adsorption of ZnPc on TiO2 surface at a proportion of 2.5 wt.%. This composite presents a surface area of 35 m2 g-1.30
Adsorption assays
The adsorption of PCT on the surface of the photocatalysts was evaluated at pH 3.00, 5.50, 6.20 and 6.80 using 1 L of suspensions containing 10 mg L-1 of PCT and 100 mg L-1 of the photocatalysts. These assays
were done without addition of H2O2 and protected from light. The suspensions were maintained under stirring for 10 h. Aliquots of 5 mL were collected every 30 min in the first 5 h, and every hour in the remaining time, being measured the absorbance of each aliquot at 243 nm. Prior to the photometric measurements, the collected samples were filtered using 0.45 µm membranes to remove any particulate material. The experiments were carried out at 26 ± 2 oC in triplicate.
Photodegradation assays
The experiments were performed using as irradiation source a 400 W high pressure mercury vapor lamp without the protective bulb, positioned at the center of the reactor, as described in a previous study.31 The photocatalytic reactor is an annular recipient built in borosilicate glass with a 1 cm optical path jacket and an irradiated volume of 0.850 L, in which the suspension containing the photocatalyst and the compound to be degraded is circulated. The average UVA dose measured for this lamp was estimated as being 1100 W m-2,29 with a photonic flux of 3.3 × 10⁻⁶ E s-1 between 295 and 710 nm.30
The reactions were monitored by the consumption of the organic matter (PCT and its organic degradation products), expressed in terms of dissolved organic carbon (DOC). Four liters of a mixture containing 10 mg L-1 of PCT (DOC equal to 6.35 mg L-1) and 100 mg L-1 of photocatalyst were used in each experiment. The concentration of photocatalyst was defined as being 100 mg L-1 since the gain achieved in terms of mineralization is minimal when this concentration ranges from 100 to 1000 mg L-1.32
After the addition of H2O2 and pH adjustment using aqueous solutions of HCl or NaOH, the suspension, contained in a reservoir, was circulated through the reactor by pumping at a flow rate of 2.37 L min-1 for 5 min in the dark. Besides the homogenization promoted by the pump-induced recirculation, the suspension was maintained under magnetic stirring within the reservoir. During the reactions the temperature of the solutions was kept at 25 ± 2 ºC, using a thermostatic bath (Tecnal TE-184). All the reactions were limited to 120 min. Aliquots were withdrawn every 20 min of reaction, filtered to remove the solids in suspension, and used for DOC analyses and determination of residual H2O2. The photocatalytic reactions using the nanocomposite were run in the absence and in the presence of H2O2 at seven different concentrations of H2O2 (16, 33, 66, 99, 120, 166 and 332 mg L-1). For the optimal H
photodegradation of PCT in the absence and presence of H2O2 (332 mg L-1), and the degradation in the dark in the presence of H2O2.
Analyses
Hydrogen peroxide was quantified spectrophoto-metrically using ammonium metavanadate, as described by Nogueira et al.33
For DOC analyses, the remaining H2O2 was decomposed by the addition of sodium sulfite. The added volume of a solution containing 1.0 mol L-1 of Na
2SO3 was estimated according to the remaining number of moles of H2O2. The DOC measurements were done using a total organic carbon (TOC) analyzer TOC-VCPH/CPN (Shimadzu), equipped with an ASI-V autosampler.
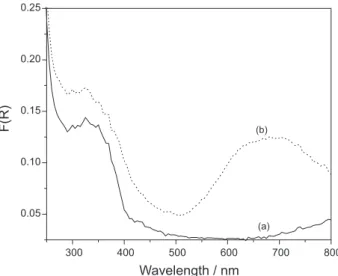
Diffuse reflectance spectra for TiO2-P25 and TiO2/ZnPc were taken in the range between 200 and 800 nm using a Shimadzu UV-1650PC spectrophotometer equipped with an integrating sphere. Data were converted to plots of the Kubelka Munk function F(R) vs. photon energy (eV). All of the other absorbance measurements were carried out using the same spectrophotometer.
Results and Discussion
Control experiments
Blank experiments were performed to assure that the process studied occurs mainly via photocatalysis and not by the adsorption of the PCT in the photocatalyst, its photolysis or action of H2O2.
No mineralization was observed in the photolysis of PCT without any additive. However, a mineralization of, at most, 10% was reached after 120 min of photolysis in the presence of H2O2, which can be attributed to the oxidizing nature of this additive. It is noteworthy that, as the reactor was built in borosilicate glass, the radiation that reaches the reaction medium (λ > 290 nm) is unable to promote the cleavage of hydrogen peroxide. In the dark but in the presence of H2O2, no mineralization was observed.
In a period of 2 h under stirring and in the absence of light, less than 1% of the initial PCT concentration was adsorbed on the bare TiO2 in almost all pH studied, except at pH 6.20, the isoelectric point of this photocatalyst,34 when this amount was about 8%. It is noteworthy that after the pH adjustment of the suspensions there were no significant changes in this parameter during the course of the reactions, probably due to the formation of carboxylic acids and ammonia.
Using the TiO2/ZnPc nanocomposite the adsorption equilibrium at pH 3.00 is similar to that observed for the bare TiO2. Between pH 5.50 and 6.80 the adsorption equilibrium involved about 7% of the initial concentration of PCT. In this case, the higher adsorption observed occurred at pH 5.5, the isoelectric point measured for this nanocomposite.35 At pH 6.80, the interaction between PCT molecules and the surface of both catalysts, negatively charged above the isoelectric point, should be favored through hydrogen bonding. It should be emphasized that, in this pH, PCT is neutral (pKa ca. 9.5).36
The kinetics of the heterogeneous photocatalytic reactions is typically correlated to the Langmuir-Hinschelwood model.34,37,38 Considering that the concentration of reactive species (RS) formed in the reaction sites must quickly achieve a stationary regimen,39,40 remaining nearly constant during all the photocatalytic process, the rate law can be expressed by equation 1:
(1)
where [OM] is the concentration of organic matter;
k’ = k[RS] is the apparent reaction rate constant, with
[RS] being the concentration of reactive species; CS is the total number of reactive sites (occupied or not); KOM is the weighted average value of the adsorption/desorption constants of PCT and its organic degradation products, since they are indistinguishable when monitored by DOC measurements; and KRS is the adsorption/desorption constant related to species that interact with the active sites (h+ or e–), giving rise to reactive species.
As the adsorption/desorption equilibrium of OM involves low concentrations, compared to the formation of reactive species, KRS[RS] >> KOM[OM], equation 1 can be rewritten as
(2)
Although [RS] can be considered constant, it should be very small. Therefore, equation 2 can be reduced to
(3)
which, considering that is kapp, the apparent rate constant of the reaction, can be rewritten as
Thus, in global terms, both the degradation and the mineralization of paracetamol can be treated on the basis of a first-order rate law. The consumption of H2O2 follows a similar kinetic model, and can also be described in the same way.
The limited adsorption of PCT on the surface of these photocatalysts suggests that the degradation and mineralization of this substrate and its organic degradation products involve necessarily the electron/hole transfer in the active sites of the photocatalysts to species such as H2O, O2 and H2O2, giving rise to highly reactive species, such as hydroxyl and superoxide radicals, and singlet oxygen.41
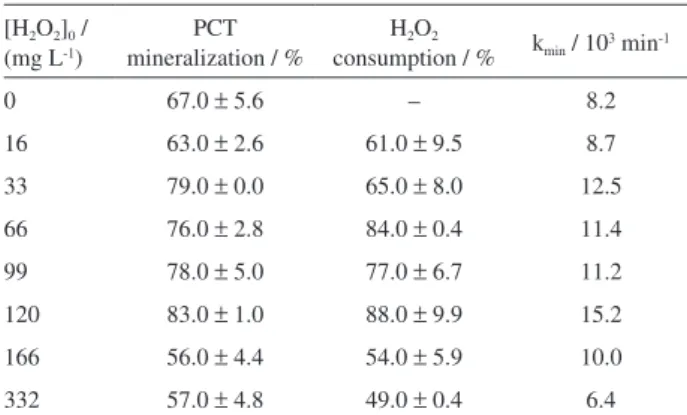
Table 1 presents data concerning PCT mineralization mediated by TiO2/ZnPc for different concentrations of H2O2.
As can be seen, the PCT mineralization rate in the absence of H2O2 is relatively high, suggesting the effectiveness of TiO2/ZnPc as photocatalyst. The addition of H2O2 up to 120 mg L-1 enhances the mineralization in ca. 40%.
The use of additives with oxidizing characteristics, such as hydrogen peroxide, has been usual to improve the performance of the photocatalytic process.29,30,42 Hydrogen peroxide can react with electrons in the conduction band or holes in the valence band, ensuring a higher availability of reactive oxygen species, mainly HO●, also contributing to minimize the electron-hole recombination.43-45
However, the amount of hydrogen peroxide needs to be balanced since an excess tends to favor reactions that do not result in the degradation of the organic matter (equations 5-8).38,46-48 It must be emphasized that the reactions represented by equations 7 and 8 are very fast, occurring near the diffusion limit in water.49
H2O2 + H2O2→ 2H2O + O2 (5)
H2O2 + HO●→ H2O + HO2 k = 2.7 × 10⁷ L mol-1 s-1 (6)
HO2● + ●OH → H2O + O2 k = 7.1 × 10⁹ L mol-1 s-1 (7)
HO● + ●OH → H2O2 k = 5.2 × 10⁹ L mol-1 s-1 (8)
Looking at the consumption of H2O2 as a function of its initial concentration, one can observe that, using 33 mg L-1 of H
2O2, 79% of PCT mineralization was reached, a result 5% lower than the one achieved using 120 mg L-1, and resulted in a consumption of 65% of the added H2O2. On the other hand, the consumption of H2O2 taking an initial concentration of 120 mg L-1 was of 88%, a value incompatible with the increment observed in the mineralization, which should be related to side reactions (equations 5-8).38,46-48 In view of this, the following experiments were carried out using 33 mg L-1 as the minimal concentration of H2O2 capable of improving PCT mineralization.
The mineralization reached using TiO2-P25 at pH 3.00 without H2O2 was of about 33% in 120 min of reaction, approximately 112% lower than that reached using 33 mg L-1 of this additive (Table 2). Using the nanocomposite TiO2/ZnPc under similar conditions, the difference was of only 18%, suggesting that the photocatalytic reactions mediated by TiO2-P25 are more favored by the addition of H2O2. Similarly, a decrease of performance of about 12% was verified in the reactions using TiO2-P25 at pH 10.0 with addition of H2O2, and only of 5% when the nanocomposite was used. The different behaviors should be related to differences in the reaction chains triggered by these photocatalysts.
It is well known that the relaxation of excited states in aggregates of metal phthalocyanines is predominantly due to very fast thermal deactivation processes, committing the occurrence of other processes, such as the intersystem crossing.50-53 When associated with bulk TiO
2, the electron transfer from excitons of metal phthalocyanine aggregates to the oxide surface has been reported as a preferential way,54-56 giving rise to (ZnPc
agg)+● and (equations 9-11):54
Table 1. Percentage of PCT mineralized and H2O2 consumed after 120 min of reaction mediated by TiO2/ZnPc 2.5 wt.%, for different initial concentrations of H2O2, at pH 3.0. The apparent rate constant for PCT mineralization (kmin) was calculated considering a first order rate law
[H2O2]0 / (mg L-1)
PCT mineralization / %
H2O2
consumption / % kmin / 103 min-1
0 67.0 ± 5.6 – 8.2
16 63.0 ± 2.6 61.0 ± 9.5 8.7
33 79.0 ± 0.0 65.0 ± 8.0 12.5
66 76.0 ± 2.8 84.0 ± 0.4 11.4
99 78.0 ± 5.0 77.0 ± 6.7 11.2
120 83.0 ± 1.0 88.0 ± 9.9 15.2
166 56.0 ± 4.4 54.0 ± 5.9 10.0
332 57.0 ± 4.8 49.0 ± 0.4 6.4
PCT: paracetamol; kmin: apparent rate constant for PCT mineralization.
Table 2. PCT mineralization rates as a function of pH, for reactions mediated by bare TiO2 or TiO2/ZnPc, in the presence of H2O2
Photocatalyst pH Mineralization / % Variation / % Without H2O2 With H2O2
TiO2-P25
3.00 32.7 ± 1.0 69.2 ± 4.2 112
10.0 75.7 ± 7.9 66.8 ± 6.7 –12
TiO2/ZnPc
3.00 67.0 ± 5.6 79.0 ± 4.0 18
(9) (10) (11)
The increased number of electron-deficient sites due to the formation of (ZnPcagg)+● and , equations 12-15, should improve the oxidative processes mediated by the nanocomposite, favoring PCT mineralization. Using h+ to designate and (ZnPcagg)+●, the reactions related to the production of reactive oxygen species can be expressed as shown in equations 12-15,
(12) (13) (14) (15)
Reactions induced by and secondary reactions that result in reactive species, mainly hydroxyl radicals, complement the process, as shown in equations 16-21,
(16) (17) (18) (19) (20)
In short,
PCT + RS →→→ oxidation products (21)
For the nanocomposite the synergism between and (ZnPcagg)+● should be the reason of the minor dependence of this catalyst on additional sources of hydroxyl radicals such as hydrogen peroxide. Eventually ZnPc can suffer degradation (equation 22), but at the time scale of the experiments no evidence of this side reaction was observed.
(ZnPcagg)+● + O
2→→degradation products (22)
Singlet oxygen, 1O
2(1∆g), is a reactive oxygen species that can be produced during the photocatalytic process mediated by the nanocomposite. High quantum yields of 1O
2 production have been reported in photocatalytic reactions.57-59 Its production may involve the oxidation of O2–● by h+ (equation 23),58-60 the combination of two O2–● (equation 25), or by the reaction of O2–● with H2O2 (equation 26) or HO● (equation 27).61 Another possibility is the direct energy transfer to molecular oxygen from the electronically excited TiO2 (equation 28).60
O2–● + h+→1O2 (23)
O2 + 2e– + 2H+→ H2O2 (24)
O2–● + O2–● + 2H+→ H2O2 + 1O2 (25)
O2–● + H2O2→1O2 + HO– + HO● (26)
O2–● + HO●→1O2 + HO– (27)
TiO2 + hν→ [TiO2]* + 3O2→ TiO2 + 1O2 (28)
However, due to its short lifetime in solution, it has been reported that the contribution of 1O
2 in photocatalytic reactions is limited in most cases.41 It has been reported that the effective participation of singlet oxygen is strongly dependent on the morphology of the photocatalyst.41,62,63 While in the TiO2 nanopowder its participation is limited, in TiO2 nanotubes this reactive species shows a significantly better photocatalytic activity, being suggested that this occurs due to the confinement of the oxidizable substrate into the nanotubes, compensating for the short lifetime of 1O
2.41,63
The participation of 1O
2 produced by photosensitization mediated by ZnPc in PCT oxidation promoted by TiO2/ZnPc is very unlikely to occur, since this species is not in the monomeric form but as aggregates, which minimize considerably the efficiency of 1O
2 production.50-61,64 It is noteworthy that the coating thickness of the ZnPc aggregates varies between 5 and 10 nm on the surface of the TiO2/ZnPc nanocomposite,30 suggesting a remote possibility of occurrence of ZnPc in the monomeric form in this material.
The additional electrons transferred from ZnPc to TiO2 increases the number of electron-rich sites ( ) favoring the reduction of chemical species, as for example in the production of H2 by water decomposition (equations 29 and 30): recent results obtained in our research group show that the rate of hydrogen production mediated by TiO2/ZnPc is about 38% higher than the one reached using TiO2-P25,65
(29) (30)
The mineralization of the organic matter follows an exponential decay as a function of the irradiation time. Figure 3 exemplifies this, presenting the decay and the integrated form of the rate law (equation 4), considering that the DOC expresses the amount of organic species in the aqueous medium, including the remaining PCT, as the reaction progresses. The results suggest that the mineralization occurs in two stages: a faster one, within the first 80 min, followed by a slower decay at longer reaction times. The fast step should occur due to the higher availability of reactive species, formed by the consumption of hydrogen peroxide and other oxygenated species. In the second stage, the mineralization involves the oxidation of the remaining PCT as well as more persistent organic derivatives, such as carboxylic acids,71 formed in the first step. Thus, the existence of two distinct mineralization rate constants is associated with the higher consumption of H2O2 in the first stage of the reaction that leads to a lower availability of reactive species in the second stage of the reaction and, additionally, to the formation of persistent organic derivatives.
In studies involving the mineralization of the Ponceau 4R dye (trisodium (8Z)-7-oxo-8-[(4-sulfonatonaphthalen-1-yl) hydrazinylidene]naphthalene-1,3-disulfonate) in reactions performed at pH 3.00 under irradiation conditions similar to those applied in the present study,31 but without addition of hydrogen peroxide, it was also observed that the reaction occurs in two stages, with the first one also occurring within the first 80 min of reaction. However, different from the results presented in this work, the mineralization rate in the first stage was lower than in the second one. In this case, the availability of reactive species becomes proportionally higher as the concentration of Ponceau 4R decreases, since the source of reactive species is limited to O2 and H2O, whose
concentrations are virtually constant throughout the course of the reaction.
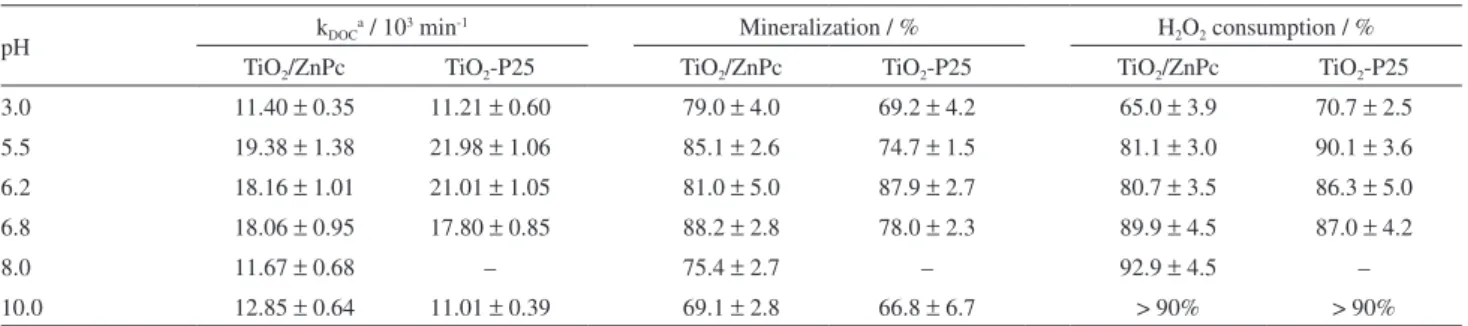
The influence of pH on PCT mineralization (Table 3 and Figure 4) was evaluated using 33 mg L-1 as initial H2O2 concentration. The charge correlation between the surface of the photocatalyst and the oxidizable substrate defines the effectiveness of the adsorptive processes and influences the mineralization rates, since the establishment of electrostatic attractions tends to favor the adsorption. As example, in a set of experiments in the absence of hydrogen peroxide and at pH 3.0, using aqueous suspensions of the dye Ponceau 4R dye (4.0 × 10⁻⁵ mol L-1), a negatively charged azo compound, due to the presence of sulfonic groups in its structure, a mineralization about 200% higher than that obtained with TiO2-P25 was reached using a TiO2/ZnPc nanocomposite containing 1.6 wt.% of ZnPc.31 In another study, the mineralization of 150 mg L-1 of a pre-degraded sodium
Figure 2. Diffuse reflectance spectra of (a) TiO2-P25 and (b) TiO2/ZnPc nanocomposite. Barium sulfate was used as reference.
Figure 3. Exponential decay of the ratio DOC/DOC0 during the mineralization of paracetamol and organic species formed during its degradation: (a) reaction mediated by the TiO2/ZnPc composite, at pH 6.2 and 33 mg L-1 H
2O2; (b) reaction mediated by TiO2-P25 at pH 5.5 and 33 mg L-1 H
lignosulfonate in suspension at pH 3.0, using 50 mg L-1 of a TiO2/ZnPc nanocomposite containing 10 wt.% of ZnPc and about 300 mg L-1 of H
2O2, was 19% higher than the one achieved using TiO2-P25.29 In the solar photocatalytic degradation of a sodium lignosulfonate (160 mg L-1) in aqueous suspension containing 300 mg L-1 of H
2O2, at pH 3.0, and 100 mg L-1 of the nanocomposite with 2.5 wt.% of ZnPc as photocatalyst, 95% of the chemical oxygen demand (COD) was removed using an accumulated UVA dose of 900 kJ m-2, while using TiO
2-P25 under the same conditions the removal was of about 60%.30
Table 3 and Figure 4 suggest that PCT mineralization tends to be higher in the isoelectric point of the photocatalyst.
The mineralization increases in the pH range between 3.0 and 6.8 for both photocatalysts, being more favored with TiO2/ZnPc: the mineralization is about 15% higher than using TiO2-P25, with the exception of the result obtained at pH 6.2 where, considering the experimental deviations, the ability of both photocatalysts to mineralize PCT is approximately the same. This should occur because this pH is close to the pHZPC estimated for TiO2-P25.34
For the TiO2/ZnPc nanocomposite, a better performance is observed in a wider range of pH. This should be related to its better capability to uptake photons (Figure 2) and the non-uniformity of the coating of the surface of TiO2-P25 by ZnPc aggregates, favoring the coexistence between regions coated by these aggregates, with coating thickness ranging between 5 and 10 nm,30 and non-coated, which should keep characteristics of the pure oxide. A relevant fact is that the nanocomposite has a specific surface area 33% lower than the measured for TiO2-P25,30 suggesting that its photonic efficiency is much higher than that of bare TiO2.
Between pH 3.00 and 6.80 the consumption of H2O2 is compatible with the observed increase in mineralization. For pH higher than 6.80 the performance of both photocatalysts tends to decrease, while the consumption of H2O2 remains above 90%. In part, the loss of efficiency is related to the increase of H2O2 decomposition, producing, for example, perhydroxyl ions (equation 31), without generating species able to mineralize and/or degrade the oxidizable substrate.70,71 The decomposition of H
2O2 under alkaline pH reaches a maximum in a pH range between 11 and 12 (the pKa of hydrogen peroxide is 11.75).72
(31)
Conclusions
In this study we compared the performances of the nanocomposite TiO2/ZnPc 2.5 wt.% (ZnPc is zinc(II) phthalocyanine) and TiO2-P25 photocatalysts in PCT mineralization, evaluating the role of pH and the effect of addition of H2O2.
The nanocomposite mediates more efficiently the PCT mineralization, being less dependent on the addition of H2O2 than TiO2-P25. At pH 3.00, even in the absence of H2O2, 67.0% of PCT mineralization was achieved using the nanocomposite. For TiO2-P25, under the same conditions,
Table 3. Effect of pH on PCT mineralization and consumption of H2O2, in the photocatalytic degradation mediated by TiO2/ZnPc 2.5 wt.% or TiO2-P25. The initial concentration of H2O2 during the experiments was fixed at 33 mg L-1
pH kDOC
a / 103 min-1 Mineralization / % H
2O2 consumption / %
TiO2/ZnPc TiO2-P25 TiO2/ZnPc TiO2-P25 TiO2/ZnPc TiO2-P25
3.0 11.40 ± 0.35 11.21 ± 0.60 79.0 ± 4.0 69.2 ± 4.2 65.0 ± 3.9 70.7 ± 2.5
5.5 19.38 ± 1.38 21.98 ± 1.06 85.1 ± 2.6 74.7 ± 1.5 81.1 ± 3.0 90.1 ± 3.6
6.2 18.16 ± 1.01 21.01 ± 1.05 81.0 ± 5.0 87.9 ± 2.7 80.7 ± 3.5 86.3 ± 5.0
6.8 18.06 ± 0.95 17.80 ± 0.85 88.2 ± 2.8 78.0 ± 2.3 89.9 ± 4.5 87.0 ± 4.2
8.0 11.67 ± 0.68 – 75.4 ± 2.7 – 92.9 ± 4.5 –
10.0 12.85 ± 0.64 11.01 ± 0.39 69.1 ± 2.8 66.8 ± 6.7 > 90% > 90%
aRate constant of consumption of dissolved organic species (k
DOC), calculated by DOC measurements,at the first 80 min of reaction.
only 33% mineralization was reached. With the addition of 33 mg L-1 of H
2O2, the PCT mineralization mediated by TiO2-P25 was of 69%, an increase of approximately 112%. Under the same conditions, the result using the nanocomposite was 18% better.
With the addition of H2O2, in the pH range between 3.00 and 6.80 the mineralization reached using the nanocomposite is about 15% higher, except at pH 6.2, where the mineralization promoted by both photocatalysts is equivalent. The reason for the better performance of the nanocomposite should be related to its capability to uptake photons in a large range of wavelengths and to the non-uniformity of the coating of the TiO2 surface by ZnPc aggregates, favoring the coexistence of regions completely coated by ZnPc aggregates with non-coated regions, which should keep characteristics of the pure photocatalyst. The improved light harvesting along with a better charge mobility in TiO2/ZnPc nanocomposite should lead to a decrease in charge recombination, accelerating the mineralization of PCT.
For both photocatalysts the reaction is influenced by the pH of the reaction medium with maximum nearby their respective isoelectric points. The highest level of mineralization using the nanocomposite, with addition of H2O2, occurs between pH 5.50 and 6.80, with maximum mineralization between 86 and 91%, while using TiO2-P25 the best result occurred only at pH 6.20 (91% mineralization). Above pH 6.80 the mineralization decreases but the consumption of H2O2 remains higher than 90% due to decomposition reactions.
The highest level of mineralization using the nanocomposite in presence of H2O2 was reached with an initial concentration of this additive equal to 120 mg L-1, when PCT mineralization was about 83% with the consumption of 88% of the added H2O2. However, with an initial concentration of only 33 mg L-1 PCT mineralization was only 5% lower with the consumption of 65% of the added H2O2, suggesting that in the former case most of the H2O2 added was consumed in side-reactions that do not result in the degradation of the organic matter.
The results presented here show that the TiO2/ZnPc nanocomposite is an effective catalyst to promote PCT mineralization under a wide pH range.
Acknowledgments
ToFAPEMIG, CAPES and CNPq for funding. A. E. H. M. is particularly indebted to CNPq for his research grant. M. D. F., K. A. B., T. A. S. and L. M. S. are indebted to CAPES for their PhD and MSc scholarships. This work is also a collaboration research project of members of Rede
Mineira de Química (RQ-MG), supported by FAPEMIG (Project CEX-RED-00010-14).
References
1. Fujishima, A.; Honda, K.; Nature 1972,238,37.
2. Schneider, J.; Matsuoka, M.; Takeuchi, M.; Zhang, J. L.; Horiuchi, Y.; Anpo, M.; Bahnemann, D. W.; Chem. Rev. 2014, 114,9919.
3. Machado, A. E. H.; Patrocínio, A. O. T.; França, M. D.; Santos, L. M.; Borges, K. A.; Paula, L. F. In Materials and Processes for Energy: Communicating Current Research and Technological
Developments;Méndez-Vilas, A., ed.; Formatex: Badajoz, 2013,
pp 867.
4. Ismail, A. A.; Bahnemann, D. W.; Sol. Energy Mater. Sol. Cells
2014,128,85.
5. Cheng, X. T.; Chen, Q.; Liang, X. G.; Renewable Sustainable Energy Rev. 2015,44,608.
6. Habisreutinger, S. N.; Schmidt-Mende, L.; Stolarczyk, J. K.; Angew. Chem., Int. Ed. 2013,52,7372.
7. Neatu, S.; Macia-Agullo, J. A.; Garcia, H.; Int. J. Mol. Sci.
2014,15,5246.
8. Liu, L. J.; Zhao, H. L.; Andino, J. M.; Li, Y.; ACS Catal. 2012, 2,1817.
9. Ahmed, M. A.; Abdel-Messih, M. F.; J. Alloys Compd. 2011, 509,2154.
10. Devi, L. G.; Kumar, S. G.; Appl. Surf. Sci. 2011,257,2790. 11. Machado, A. E. H.; Miranda, J. A.; Sattler, C.; Oliveira, L. C. A.;
Br PI 0300920-3,2012.
12. Verbruggen, S. W.; J. Photochem. Photobiol. C: Photochem. Rev.2015, 24, 64.
13. Machado, A. E. H.; Patrocínio, A. O. T.; França, M. D.; Santos, L. M.; Borges, K. A.; Silva, T. A.; Paula, L. F.; Borges, M. F.; Machado, W. A.; Oliveira, S. M. In Solar Radiation Applications;Bello, S. R., ed.; InTech: Rijeka, 2015, ch. 5.
14. Machado, A. E. H.; Borges, K. A.; dos Santos, L. M.; Franca, M. D.; BrPI 10 2013 005372 4,2013.
15. Machado, A. E. H.; Santos, L. M.; Borges, K. A.; Batista, P. S.; Paiva, V. A. B.; Müller Jr., P. S.; Oliveira, D. F. M.; França, M. D. In Solar Radiation; Babatunde, E. B., ed.; InTech: Rijeka, 2012, ch. 19.
16. de Souza, D. R.; Trovó, A. G.; Antoniosi Filho, N. R.; Silva, M. A. A.; Machado, A. E. H.; J. Braz. Chem. Soc. 2013,24,1451. 17. Gonzalez, O.; Sans, C.; Esplugas, S.; Malato, S.; Photochem.
Photobiol. Sci. 2009,8,1032.
18. Trovo, A. G.; Gomes Jr., O.; Machado, A. E. H.; Borges Neto, W.; Silva, J. O.; J. Braz. Chem. Soc. 2013,24,76.
19. Trovo, A. G.; de Paiva, V. A. B.; Machado, A. E. H.; de Oliveira, C. A.; Santos, R. O.; Sol. Energy 2013,97,596.
22. Kummerer, K.; Chemosphere 2009,75,417.
23. Lopes, J.; Matheus, M. E.; Rev. Bras. Farm.2012, 93,411. 24. Fent, K.; Weston, A. A.; Caminada, D.; Aquat. Toxicol.2006,
76, 122.
25. Davern, T. J.; James, L. P.; Hinson, J. A.; Polson, J.; Larson, A. M.; Fontana, R. J.; Lalani, E.; Muñoz, S.; Shakil, A. O.; Lee W. M.; Gastroenterology 2006, 130, 687.
26. Jagannathan, M.; Grieser, F.; Ashokkumar, M.; Sep. Purif. Technol. 2013,103,114.
27. Yang, L.; Yu, L. E.; Ray, M. B.; Water Res. 2008,42,3480. 28. Dalmázio, I.; Alves, T. M. A.; Augusti, R.; J. Braz. Chem. Soc.
2008,19,81.
29. Machado, A. E. H.; de Miranda, J. A.; de Freitas, R. F.; Duarte, E. T. F. M.; Ferreira, L. F.; Albuquerque, Y. D. T.; Ruggiero, R.; Sattler, C.; de Oliveira, L.; J. Photochem. Photobiol., A 2003, 155,231.
30. Machado, A. E. H.; França, M. D.; Velani, V.; Magnino, G. A.; Velani, H. M. M.; Freitas, F. S.; Müller Jr., P. S.; Sattler, C.; Schmücker, M.; Int. J. Photoenergy 2008, 482373.
31. Oliveira, D. F. M.; Batista, P. S.; Muller, P. S.; Velani, V.; Franca, M. D.; de Souza, D. R.; Machado, A. E. H.; Dyes Pigm. 2012,92,563. 32. Sun, L. Z.; Bolton, J. R.; J. Phys. Chem. 1996,100,4127. 33. Nogueira, R. F. P.; Oliveira, M. C.; Paterlini, W. C.; Talanta
2005,66,86.
34. Hoffmann, M. R.; Martin, S. T.; Choi, W. Y.; Bahnemann, D. W.; Chem. Rev. 1995,95,69.
35. Batista, P. S.; de Sousa, D. R.; Maximiano, R. V.; Neto, N. M. B.; Machado, A. E. H.; J. Mater. Sci. Res. 2013,2,82.
36. Forrest, J. A. H.; Clements, J. A.; Prescott, L. F.; Clin. Pharmacokinet. 1982,7,93.
37. Villarreal, T. L.; Gomez, R.; Neumann-Spallart, M.; Alonso-Vante, N.; Salvador, P.; J. Phys. Chem. B 2004,108,15172. 38. Autin, O.; Hart, J.; Jarvis, P.; MacAdam, J.; Parsons, S. A.;
Jefferson, B.; Water Res. 2012,46,5655.
39. Ji, Y. F.; Zhou, L.; Ferronato, C.; Salvador, A.; Yang, X.; Chovelon, J. M.; Appl. Catal., B 2013,140,457.
40. Sanchez, L. D.; Taxt-Lamolle, S. F. M.; Hole, E. O.; Krivokapic, A.; Sagstuen, E.; Haugen, H. J.; Appl. Catal., B 2013,142,662. 41. Guo, X.; Li, Q.; Zhang, M.; Long, M.; Kong, L.; Zhou, Q.;
Shao, H.; Hu, W.; Wei, T.; Chemosphere2015, 120, 521. 42. Sheng, H.; Li, Q.; Ma, W. H.; Ji, H. W.; Chen, C. C.; Zhao,
J. C.; Appl. Catal., B 2013,138,212.
43. Andreozzi, R.; Marotta, R.; Paxeus, N.; Chemosphere 2003, 50,1319.
44. Devi, L. G.; Nagaraj, B.; Rajashekhar, K. E.; Chem. Eng. J.
2012,181,259.
45. Niu, P. H. J.; Colloids Surf., A 2013,127.
46. Bekbolet, M.; Balcioglu, I.; Water Sci. Technol. 1996,34,73. 47. Buxton, G. V.; Greenstock, C. L.; Helman, W. P.; Ross, A. B.;
J. Phys. Chem. Ref. Data 1988,17,513.
48. Trovo, A. G.; Silva, T. F. S.; Comes, O.; Machado, A. E. H.; Neto, W. B.; Muller, P. S.; Daniel, D.; Chemosphere 2013,90,170. 49. Turro, N. J.; Ramamurthy, V.; Scaiano, J. C.; Photochem.
Photobiol. 2012,88,1033.
50. Howe, L.; Zhang, J. Z.; J. Phys. Chem. A1997, 101, 3207. 51. Li, X.-Y.; He, X.; Ng, A. C. H.; Wu, C.; Ng, D. K. P.;
Macromolecules2000, 33, 2119.
52. DeRosa, M. C.; Crutchley, R. J.; Coord. Chem. Rev.2002, 233/234, 351.
53. Li, X.; Sinks, L. E.; Rybtchinski, B.; Wasielewski, M. R.; J. Am. Chem. Soc.2004, 126, 10810.
54. Sharma, G. D.; Kumar, R.; Roy, M. S.; Sol. Energy Mater. Sol. Cells2006, 90, 32.
55. Ino, D.; Watanabe, K.; Takagi, N.; Matsumoto, Y.; J. Phys. Chem. B2005, 109, 18018.
56. Gulbinas, V.; Chachisvilis, M.; Valkunas, L.; Sundström, V.; J. Phys. Chem. 1996, 100, 2213.
57. Nosaka, Y.; Daimon, T.; Nosaka, A. Y.; Murakami, Y.; Phys. Chem. Chem. Phys.2004, 6, 2917.
58. Daimon, T.; Nosaka, Y.; J. Phys. Chem. C2007, 111, 4420. 59. Daimon, T.; Hirakawa, T.; Kitazawa, M.; Suetake, J.; Nosaka, Y.;
Appl. Catal., A2008, 340, 169.
60. Tachikawa, T.; Fujitsuka, M.; Majima, T.; J. Phys. Chem. C
2007, 111, 5259.
61. Fujishima, A.; Zhang, X.; Tryk, D. A.; Surf. Sci. Rep.2008, 63, 515.
62. Lai, Y.; Sun, L.; Chen, Y.; Zhuang, H.; Lin, C.; Chin, J. W.; J. Electrochem. Soc.2006, 153, D123.
63. Macak, J. M.; Zlamal, M.; Krysa, J.; Schmuki, P.; Small2007, 3, 300.
64. Zhang, D.; Qiu, R.; Song, L.; Eric, B.; Mo, Y.; Huang, X.; J. Hazard. Mater.2009, 163, 843.
65. http://www.sbq.org.br/38ra/cdrom/resumos/T1024-1.pdf accessed in January 2016.
66. Fidder, H.; Knoester, J.; Wiersma, D. A.; J.Chem. Phys. 1991, 95, 7880.
67. Kim, O.-K.; Je, J.; Jernigan, G.; Buckley, L.; Whitten, D.; J. Am. Chem. Soc.2006, 128, 510.
68. Spano, F. C.; Acc. Chem. Res. 2010, 43, 429.
69. Spalek, O.; Balej, J.; Paseka, I.; J. Chem. Soc., Faraday Trans. 1 1982,78,2349.
70. Trovo, A. G.; Nogueira, R. F. P.; J. Braz. Chem. Soc. 2011,22, 1033.
71. Trovo, A. G.; Gomes Jr., O.; Machado, A. E. H.; Int. J. Photoenergy2013, 2013, 340347.
72. Galbacs, Z. M.; Csanyi, L. J.; J. Chem. Soc., Dalton Trans.
1983,2353.
Submitted: November 9, 2015