ABSTRACT: The growth of the mouse parotid glands during 7 and 35 days of postnatal life was studied by mor-phometric methods. The mass of the gland, the volume of each morphological compartment, and the cell number in each compartment were evaluated. The data obtained for each evaluated dimension were adjusted by an expo-nential equation, of the type Y = a.eK.X, thus permitting the calculation of their mean duplication time (T
D), i.e., an
estimation of their growth rate. Analysis of the results showed a marked 1,424% increase in the gland mass during the whole studied period, with TD = 7.10 days. This growth occurred by increases in absolute volume of acini,
in-tercalated ducts, striated ducts, excretory ducts and stroma, with percentual increases of 3,048%, 417%, 2,662%, 2,594% and 367%, respectively, and TDs of 5.62, 11.71, 5.55, 5.47 and 14.45 days, respectively. Analysis of the cell
number growth in each compartment showed increases of 1,904%, 285%, 1,228%, 1,090% and 286%, respectively, and TDs of 6.62, 20.40, 7.19, 7.26 and 14.51 days, respectively. Based on the present results, we concluded that
the growth of the mouse parotid glands from day 7 to day 35 of age occurred by intense cell accumulation, mainly in the acini, striated ducts and excretory ducts, with a growth rate sensibly higher than that of the intercalated ducts and stroma.
DESCRIPTORS: Parotid gland; Growth and embryonic development; Regression analysis; Histology; Animals.
RESUMO: O crescimento das glândulas parótidas do camundongo durante 7 e 35 dias de vida pós-natal foi estu-dado por métodos morfométricos. A massa glandular, o volume de cada compartimento morfológico e o número de células em cada compartimento foram avaliados. Os dados obtidos para cada dimensão avaliada foram ajustados por equação exponencial, tipo Y = a.ek.x, permitindo o cálculo do seu tempo de duplicação médio (T
D), ou seja,
uma estimativa da sua velocidade de crescimento. A análise dos resultados mostrou a ocorrência de um marcante aumento de massa glandular no período estudado de 1.424%, com TD = 7,10 dias. Esse crescimento glandular
ocorreu por aumentos nos volumes absolutos dos ácinos, dos ductos intercalares, dos ductos estriados, dos ductos excretores e do estroma, com aumentos percentuais de, respectivamente, 3.048%, 417%, 2.662%, 2.594% e 367%, e TDs de 5,62, 11,71, 5,55, 5,47 e 14,45 dias. A análise da evolução do número de células em cada compartimento
demonstrou aumentos de, respectivamente, 1.904%, 285%, 1.228%, 1.090% e 286% e TDs de 6,62, 20,40, 7,19,
7,26 e 14,51 dias. Baseados nos resultados aqui obtidos, concluímos que o crescimento das glândulas parótidas do camundongo entre os dias 7 e 35 de idade ocorre por intenso acúmulo de células, principalmente nos ácinos e nos ductos estriados e excretores, com uma velocidade de crescimento sensivelmente maior que nos ductos inter-calares e no estroma.
DESCRITORES: Glândula parótida; Crescimento e desenvolvimento do embrião; Análise de regressão; Histologia; Animais.
INTRODUCTION
In contrast with the significant number of autoradiographic and/or morphometric studies on the postnatal development of the rat parotid
glands3,5-7,10,15,17, no studies on mice exist. Since
the parotid glands of adult mice have been widely used for the study of the mechanisms of
* Scientiic Initiation Student, Department of Biological Sciences; ***Doctorate Student in Oral Biology, Department of Stomatol -ogy; ****PhD, Chairman, Laboratory of Histology, Department of Biological Sciences – School of Dentistry of Bauru, University of São Paulo.
** Doctorate Student in Oromaxillofacial Surgery and Traumatology, School of Dentistry of Araçatuba, São Paulo State University.
Morphometric study of the postnatal growth of the parotid gland
of the mouse
Estudo morfométrico do crescimento pós-natal da glândula
parótida do camundongo
Tiago Turri de Castro Ribeiro* André Dotto Sottovia**
lar growth induced by isoproterenol8,9, the
under-standing of normal mouse parotid gland growth during postnatal development is important.
Therefore, in the present study the course of the cell populations in the different structures of the parotid glands of male mice, as well as their dimensional changes, were analyzed morphometri-cally during the period from 7 to 35 days of age, and the growth parameters were calculated.
MATERIAL AND METHODS
Thirty male Swiss mice were divided into groups aged 7, 14, 21, 28 and 35 days (6 mice/group). The litters were maintained with their dams up to the 21st day of age, when they were weaned. All glands
were collected always from 11h00 to 12h00 a.m. to avoid circadian cycle variations. This study was per-formed following the guidelines for laboratory animal experimentation established by the institution.
The mice were anesthetized with ketamine hy-drochloride (10 mg/100 g of body weight) (Agribands do Brasil Ltda., Paulínea, Brazil) plus xylazine hy-drochloride (1 mg/100 g of body weight) (Agribands do Brasil Ltda., Paulínea, Brazil), and the body mass of each animal was assessed. The parotid glands of each animal were then removed and its fresh mass was determined. The glands were fixed in 10% phos-phate buffered formalin (Merck KGaA, Darmstadt, Germany) for 1 week, dehydrated in ethyl alcohol (Merck KGaA, Darmstadt, Germany), cleared in xy-lene (Merck KGaA, Darmstadt, Germany) and em-bedded in paraffin plus plastic resin (Merck KGaA, Darmstadt, Germany). Five-micrometer thick alter-nating sections were cut and stained with hematoxy-lin-eosin (Merck KGaA, Darmstadt, Germany).
Determination of the processed glandular volume
The processed gland volume (Vp) was calcu-lated based on the fresh mass of the organ (m), its density (δ) and the retraction factor due to histo-logical processing (fr), using the formula:
Vp = m/δ× fr.
Gland density (δ) was determined in 30 ani-mals, subdivided into five groups of 7, 14, 21, 28 and 35 days of age, with a precision scale equipped with accessories for the determination of density (Mettler-Toledo GmbH, Greifensee, Switzerland). The retraction caused by histological processing
was determined in 6 animals per age group as described by Taga, Sesso16 (1978).
Morphometric determination of volume density, total volume and absolute cell number for each glandular structure
These morphometric measurements were ob-tained using a 100 X immersion objective and a Zeiss Kpl 8 X eyepiece containing a Zeiss II integra-tion grid (Carl Zeiss Jena GmbH, Jena, Germany) with 10 parallel lines and 100 points in a quadran-gular area. The image of the grid was successively superimposed on 50 histological fields per animal, selected by systematic sampling, and the volume density (Vvi), total volume (Vti) and absolute number of cells (Ni) for each glandular structure were deter-mined as indicated by Aherne, Dunnill1 (1982).
Statistical analysis
The stereologic data were compared between age groups by analysis of variance (ANOVA) and a paired multiple comparison procedure (Student-Newman-Keuls test) using the SigmaStat software – Jandel Scientific (Jandel Corporation, Chicago, USA), with the level of significance set at P = 0.05 and P = 0.01. The data of glandular mass, total volume and total number of cells were fitted by an equation of the type:
y = a.ekx ,
where:
y = variable analyzed, x = age in days,
a = initial term of the equation (a > 0), k = exponent of the equation and e = base of the natural logarithm.
The quality of the fitted data was verified by the coefficient of determination (r2). The
duplica-tion time (TD) of each fitted dimension was
calcu-lated using the formula: TD = ln2/k,
where,
ln2 = is the natural logarithm of 2 and k = is the coefficient of the equation13.
RESULTS
Morphological results
struc-tures present in the adult animal
–
acini, inter-calated ducts, striated ducts and excretory ducts–
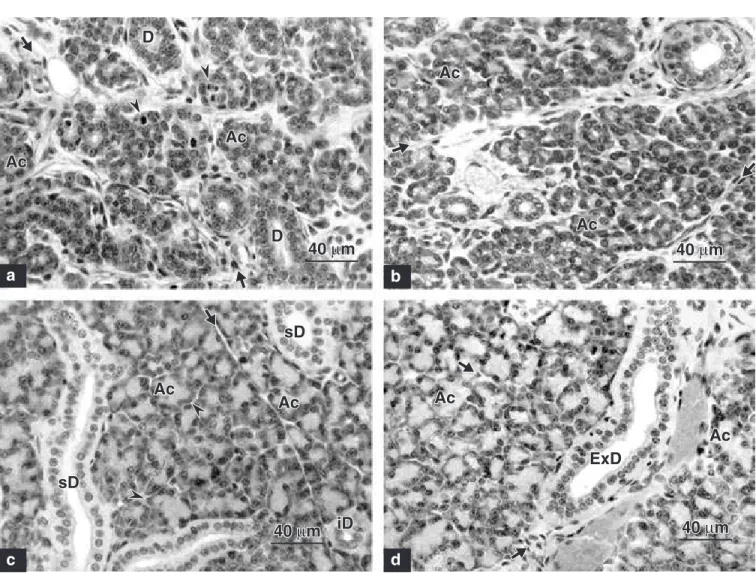
although still completely immature. The stroma was abundant and consisted of loose connective tissue. The interlobular and interlobar septa were found to be in the early phase of organization. Numerous mitotic figures were observed in all mor-phological compartments.At 14 days of age (Figure 1b), the lobules were larger and showed a marked increase in the num-ber of acini and a significant reduction in intra-lobular connective tissue. The interintra-lobular and interlobar septa were well organized. The acini and striated and excretory ducts seemed to have increased in size. A significant number of mitotic figures was also observed.
In the 21-day age group (Figure 1c), the lobules were still large and a reduction in the intralobular connective spaces due to an increase in the number and size of now more irregular acini was observed. The striated ducts, with a morphology close to that of the adult animal, were seen long, with a wide lumen, and consisted of prismatic cells already exhibiting the characteristic longitudinal striations in the basal third and central spherical nuclei. The intercalated ducts, with defined morphology, were short and con-sisted of short cubic cells with little cytoplasm delim-iting a very small, not always visible lumen.
At 28-35 days of age (Figure 1d), no signifi-cant alterations were observed compared to the previous age group, except for a reduction in the interlobular stroma.
D
Ac Ac
D
Ac
Ac
sD
Ac Ac
Ac
Ac
iD sD
ExD
a
40 µm
b
c d
40 µm
40 µm 40 µm
FIGURE 1 - Mouse parotid gland: a) day 7, immature acini (Ac) and ducts (D) surrounded by abundant stroma
(ar-rows) and mitotic igures (arrowheads); b) day 14, increase in the number of acini (Ac) and reduction of stroma
(arrows) compared to day 7 (a); c) day 21, mature acini (Ac) with characteristic basal basophilia (arrowhead) and
reduced stroma (arrow). Striated ducts (sD) and intercalated duct (iD); and d) day 35, the image is similar to that
GRAPH 1a -Growth of the body mass and parotid gland mass of the various structures of the mouse parotid gland. Mean of 6 animals per group and bars = standard error of mean.
4.9 13.52
16.71
28.04
9.6 21.9
57.2
87.39
146,29
0 16 32 48 64 80 96 112 128 144 160
7 14 21 28
Age in days
Ma
ss
35 Body mass (g)
Gland mass (mg)
7.75
a
31.48
48.42
63.21
70.56
66.65
1.19 1.02 0.47 0.62 0.42
4.50 4.60 6.61
9.48 8.18
3.36 2.06 3.51
4.97 6.08
59.48
43.91
26.21
14.36 19.02
0 10 20 30
Vo
lu
me
d
e
n
si
ty
(%
)
Age in days 40
50 60 70 80
7 14 21 28 35
Acinus ID SD ExD St
b
GRAPH 1b -Course of the volume density of the various structures of the mouse parotid gland. Legends: ID (Intercalated duct), SD (Striated duct), ExD (Excretory duct) and St (stroma). Mean of 6 animals per group and bars = standard error of mean.
Morphometric results
The course of body and fresh gland mass (a), volume density (b), absolute volume (c) and ab-solute number of cells (d) of the various morpho-logical compartments of the mouse parotid glands
from days 7 to 35 of postnatal life is shown in Graph 1.
7 to day 35 of age, ranging from 4.9 ± 0.08 g at 7 days to 28.0 ± 0.51 g at 35 days. The equation obtained to mathematically express this growth was: Y = 3.33e(0.060513x). The calculated duplication
time (TD) was 11.45 days, i.e., body mass doubled
every 11.45 days during the period analyzed. In addition, the fresh gland mass data (Graph 1a) also showed a monophasic and progres-sive growth during the same period with a percen-tal gain of 1,424% (P < 0.01), from 9.6 ± 1.30 mg at 7 days to 146.3 ± 11.31 mg at 35 days of age. The equation obtained was: Y = 5.59e(0.097593x) and
TD was 7.10 days, i.e., parotid gland mass doubled
every 7.10 days during the period.
The course of the volume density of each glan-dular morphological compartment, from day 7 to day 35 (Graph 1b), and the analysis of variance revealed an increase in volume density of the acini from 31.5% on day 7 to 70.6% on day 28 (P < 0.01), which decreased to 66.6% on day 35 (P < 0.05). The intercalated ducts showed a decrease from 1.2% at 7 days to 0.5% at 21 days (P < 0.01), remaining stable thereafter (P > 0.05). The volume fraction oc-cupied by the striated ducts increased from 4.6% at 14 days to 9.5% at 28 days (P < 0.01), with sta-bilization being observed thereafter (P > 0.05). The excretory ducts showed an increase from 2.1% to 5.0% (P < 0.01) only during the period from 14 to 28 days. Volume density of the stroma decreased
progressively from 59.5% on day 7 to 14.4% on day 28 (P < 0.01) and increased to 19.0% on day 35 (P < 0.01).
On the other hand, the absolute volume of all morphological compartments increased sig-nificantly from day 7 to day 35 (Graph 1c). The percental increases were 3,048%, 417%, 2,662%, 2,594% and 367% for the acini, intercalated ducts, striated ducts, excretory ducts and stroma, respec-tively (P < 0.01 for all compartments).
Regression analysis showed good fits of the data of all morphological compartments to the ex-ponential equations. These equations and their re-spective coefficients of determination are shown in Table 1. Based on these equations, the volumetric TD for each compartment was calculated, which,
in this case, represents an estimate of the rate in volume gain of the compartment, i.e., the lower the TD, the higher the compartmental growth rate. The
duplication times in increasing order were 5.47, 5.55, 5.62, 11.71 and 14.45 days for the excretory ducts, striated ducts, acini, intercalated ducts and stroma, respectively.
The absolute number of cells in each mor-phological compartment of the mouse parotid glands from days 7 to 35 is shown in Graph 1d. Analysis of variance revealed a marked increase in all cell populations during the period from day 7 to day 35. Percental growth was 1,904%, 285%,
0.98 (ExD)
5.30 (Acinus)
(Acinus)
30.21
(Acinus)
47.54
(Acinus)1.51 0.21(SD) 0.49 (SD)
1.87 (SD)
5.80 (SD)
0.06 (ID) 0.11 (ID) 0.13 (ID)
0.26 (ID) 0.31 (ID) (ExD) 0.16
2.88 (St)
0 5 10 15 20 25 30 35 40 45 50 55
7 14 21 28 35
T
o
ta
l
vo
lu
me
(mm
3)
Age in days Acinus
ID SD ExD St
4.69 (St)
7.42 (St)
6.16 (St)
13.46 (St)
17.87 (Acinus)
0.22 (ExD)
4.04 (SD)
2.16 (ExD) 4.31 (ExD)
GRAPH 1c - Course of the absolute volume of the various structures of the mouse parotid gland. Legends: ID (Intercalated duct), SD (Striated duct), ExD (Excretory duct) and St (stroma). Mean of 6 animals per group and bars = standard error of mean.
1,228%, 1,090% and 286% for the acinar, inter-calated duct, striated duct, excretory duct and stromal cell populations, respectively (P < 0.01 for all compartments).
The exponential equations obtained to math-ematically express cell population growth in the different glandular compartments and the corre-sponding TD values are presented in Table 1. It
should be noted that, in this case, TD represents
an estimate of the accumulation rate of new cells
in the compartment. The duplication times in in-creasing order were 6.62, 7.19, 7.26, 14.51 and 20.4 days for the acinar, striated duct, excretory duct, stromal and intercalated duct cell popula-tions, respectively.
DISCUSSION
In the present study, morphological analysis demonstrated that at one week after birth all epi-TABLE 1 - Exponential equations obtained by regression analysis for the growth of the parotid glands of the mouse
during the irst 35 days of age.
Dimension Equation Determination coeficient (r2) Duplication time (TD)
Mass Body mass Y = 3.332e
(0.060513x) 0.981 11.45 days
Gland mass Y = 5.588e(0.097593x) 0.975 7.10 days
Compartmental volume
Acinus Y = 0.865e(0.12342x) 0.949 5.62 days
Intercalated duct Y = 0.04245e(0.059209x) 0.963 11.71 days
Striated duct Y = 0.0980e(0.12495x) 0.966 5.55 days
Excretory duct Y = 0.05656e(0.12673x) 0.969 5.47 days
Stroma Y = 2.2213e(0.04795x) 0.868 14.45 days
Total cell number
Acinus Y = 14.248e(0.104753x) 0.972 6.62 days
Intercalated duct Y = 1.033e(0.049489x) 0.869 20.40 days
Striated duct Y = 1.926e(0.096379x) 0.956 7.19 days
Excretory duct Y = 0.918e(0.095506x) 0.968 7.26 days
Stroma Y = 10.055e(0.047770x) 0.990 14.51 days
35.80 (St)
0 50 100 150 200 250 300 350 400 450 500
7 14 21 28 35
T
o
ta
l
ce
ll
n
u
mb
e
r
(x
1
0
5)
Age in days 21.60 (Acinus)
77.30 (Acinus)
165.10 (Acinus)
294.50 (Acinus)
432.80 (Acinus)
3.20 (SD) 7.40 (SD) 18.30 (SD)
1.30 (ID)
2.50 (ID) 2.42 (ID)
2.00 (ExD)
2.60 (ExD) 8.12 (ExD)
14.77 (St) 19.00 (St)
27.20 (St)
57.00 (St)
35.70 (SD)
14.70 (ExD)
5.40 (ID) 5.00 (ID)
23.80 (ExD)
42.50 (SD)
Acinus ID SD ExD St
d
thelial structures present in the parenchyma of the adult animal, i.e., acini, intercalated ducts, stri-ated ducts and excretory ducts, can be identified, although still completely immature. Confirming the morphological observations made by Gabe4
(1956) in mice and by Redman, Sreebny11,12 (1971,
1970) and Taga, Sesso19 (1979) in rats, we observed
that the most conspicuous growth and maturation of these structures occurs during the first 4 weeks of postnatal development, reaching their almost definitive morphology at the end of this period.
The increase in the number and size of the dif-ferent glandular structures led to a marked growth of 1,424% in fresh gland mass from day 7 to day 35 of age, with a duplication time of 7.10 days.
From day 7 to day 35 of age, the highest growth rates in the absolute volume of each glandular compartment, including the stroma, were observed for the acini, striated ducts and excretory ducts, with percental increases of 3,048%, 2,662% and 2,594%, respectively, and duplication times calcu-lated using the corresponding exponential equa-tions of 5.62, 5.55 and 5.47 days, respectively. The intercalated ducts and stroma showed lower growth rates during this period, with percental increases of 417% and 367% and duplication times of 11.71 and 14.45 days, respectively.
Previous studies on rats have demonstrated that parotid gland growth is the result of an in-crease in the absolute number of cells, due to pro-liferative activity17, and in the individual volume of
the parenchymatous cells, especially acinar cells3.
In the present study, analysis of the course of the cell population of each glandular compartment permitted us to estimate the cell accumulation rate for each compartment, i.e., acini, intercalated ducts, striated ducts, excretory ducts and stroma. This estimate was obtained by calculating the du-plication time for each cell population using the equation that better fitted the number of cells to age in days. Percental growth of the number of cells in the above compartments from day 7 to day 35 of age was 1,904%, 285%, 1,228%, 1,090% and 286%, and the duplication time was 6.62, 20.40, 7.19, 7.26 and 14.51 days, respectively, i.e., the growth rates of the acinar, striated and excretory duct cell populations were similar but markedly higher than those of the intercalated duct and stro-mal cell populations.
Another fact worth mentioning was the rela-tively low cell accumulation rate in the intercalated
ducts compartment during postnatal development of the mouse parotid glands, since several autora-diographic studies, using H3-thymidine labeling,
have shown that the intercalated ducts of the rat parotid glands17, the submandibular glands of the
rat2 and mouse14, and the rat sublingual glands18
exhibit very high proliferation rates during post-natal development, which are significantly higher than that of the striated ducts.
However, despite the high proliferation rates observed for these glands, the intercalated duct cell population showed a markedly lower growth rate than the striated ducts, i.e., the accumulation of new cells in the intercalated duct compartment during the first months of life was lower than in the striated duct compartment. This fact has led these researchers to put forward the hypothesis that new cells produced in excess in the interca-lated ducts of these glands migrate to the striated ducts, a process during which they undergo final morphological differentiation2,14,16,17.
Based on the present results showing growth patterns of the intercalated and striated duct cell populations similar to those reported in the stud-ies cited above, we suggest that the same events may occur in the mouse parotid glands during early postnatal development, i.e., the intercalated duct compartment produces a relative excess of cells which are provided to the striated duct com-partment.
CONCLUSIONS
The results obtained here permitted to con-clude that the growth of the mouse parotid glands from day 7 to day 35 of age occurred by intense cell accumulation mainly in the acini, striated ducts and excretory ducts, with growth rates sensibly higher than those of the intercalated ducts and stroma. Comparison between the percental growth of compartmental volume and of absolute cell num-ber suggested that the increase in the individual cell size also could have important participation in the growth of this gland growth.
ACKNOWLEDGMENTS
REFERENCES
1. Aherne W, Dunnill MS. Morphometry. London: Edward Arnold; 1982.
2. Alvares EP, Sesso A. Cell proliferation, differentiation and transformation in rat submandibular gland during early postnatal growth: a quantitative and morphological study. Arch Histol Jpn 1975;38(3):177-208.
3. Ferreira RR, Assis GF, Taga R. Estudo morfométrico da evolução do volume nuclear e citoplasmático e da rela-ção citoplasma/núcleo de células acinosas de glândulas parótidas de rato durante a vida pós-natal. Rev Bras Cienc Morfol 1994;11(2):142-8.
4. Gabe M. Contribution à l’histogénese des glandes sal-ivaires chez la souris albinos. Z Zellforsch Mikrosk Anat 1956;45(1):74-95.
5. Klein RM. Acinar cell proliferation in the parotid and sub-mandibular salivary glands of the neonatal rat. Cell Tissue Kinet 1982;15(2):187-95.
6. Klein RM. Alteration of neonatal rat parotid gland acinar cell proliferation by guandethidine-induced sympathec-tomy. Cell Tissue Kinet 1979;12(4):411-23.
7. Klein RM, Harrington DB, Piliero SJ. Isoproterenol-induced changes in cell cycle kinetics of parotid gland acinar cells in 8-day-old rats. J Dent Res 1976;55(4):611-6.
8. Onofre MA, de Souza LB, Campos A Jr, Taga R. Stereologi-cal study of acinar growth in the rat parotid gland induced by isoproterenol. Arch Oral Biol 1997;42(5):333-8. 9. Onofre MA, Taga R. Crescimento de glândulas salivares
maiores de roedores induzido pelo isoproterenol: uma re-visão. Rev FOB 1995;3(1-4):61-70.
10. Redman RS. Proliferative activity by cell type in the developing rat parotid gland. Anat Rec 1995;241(4):529-40.
11. Redman RS, Sreebny LM. Morphologic and biochemi-cal observations on the development of the rat parotid gland. Dev Biol 1971;25(2):248-79.
12. Redman RS, Sreebny LM. Proliferative behavior of differentiating cells in the developing rat parotid gland. J Cell Biol 1970;46(1):81-7.
13. Sesso A, Abrahamsohn PA, Tsanaclis A. Acinar cell proliferation in the rat pancreas during early postnatal growth. Acta Physiol Lat Am 1973;23(1):37-50.
14. Srinivasan R, Chang WW. The postnatal development of the submandibular gland of the mouse. Cell Tissue Res 1979;198(2):363-71.
15. Taga R, Martini DS, Sesso A. Autoradiographic evalu-ation of the cell cycle parameters of the various cell catego-ries of the parotid, submandibular and sublingual glands of the suckling rat. Okajimas Folia Anat Jpn 1994;70(6):255-60.
16. Taga R, Sesso A. Avaliação do número de células de órgãos pela dosagem bioquímica de DNA em homogeneiza-dos por contagem direta através de métohomogeneiza-dos morfométricos. Ciência e Cultura 1978;30(10):1232-6.
17. Taga R, Sesso A. Cell population growth in the rat parotid gland during postnatal development. Arch Oral Biol 2001;46(10):909-18.
18. Taga R, Sesso A. Postnatal development of the rat sublingual glands. A morphometric and radioautographic study. Arch Histol Cytol 1998;61(5):417-26.
19. Taga R, Sesso A. Ultrastructural studies on develop-ing parotid gland of the rat at early postnatal periods. Arch Histol Jpn 1979;42(4):427-44.