Este artigo pode ser copiado, distribuído, exibido, transmitido ou adaptado desde que citados, de forma clara e explícita,
R
R
• RAM, REV. ADM. MACKENZIE, 17(3) • SÃO PAULO, SP • MAIO/JUN. 2016 • ISSN 1518-6776 (impresso) • ISSN 1678-6971 (on-line) •
http://dx.doi.org/10.1590/1678-69712016/administracao.v17n3p132-157. Submissão: 12 set. 2015. Aceitação: 23 nov. 2015.
Sistema de avaliação: às cegas dupla (double blind review). UNIVERSIDADE PRESBITERIANA MACKENZIE. Silvio Popadiuk (Ed.), Rafael Barreiros Porto (Ed. Seção), p. 132-157.
RelationsHip
betWeen
oRganizational
slack
and
innovation
in
companies
of
bm
&
fbovespa
EDUARDO VINÍCIUS BASSI MURRO
Master’s in Accounting from the Department of Applied Social Sciences at the Universidade Federal do Paraná (UFPR). Professor for the School of Communication and Business at the Universidade Positivo. Avenida Vicente Machado, 445, Centro, Curitiba – PR – Brasil – CEP 80420-010
E-mail: [email protected]
GUILHERME BITTENCOURT TEIXEIRA
Master’s in Accounting from the Department of Applied Social Sciences at the Universidade Federal do Paraná (UFPR). Accountant at the Fortcon Auditoria e Contabilidade. Rua Nova Delhi, 34, Jardim Claudia, Londrina – PR – Brasil – CEP 86050-300
E-mail: [email protected]
ILSE MARIA BEUREN
Doctor in Controllership and Accounting from the College of Economics, Management and Accounting at the Universidade de São Paulo (FEA-USP). Professor for the Department of Applied Social Sciences at the Universidade Federal do Paraná (UFPR). Campus Reitor João David Ferreira, s.n., Trindade, Florianópolis – SC – Brasil – CEP 88040-970
E-mail: [email protected]
LUCIANO MÁRCIO SCHERER Doctor in Controllership and Accounting from the College of Economics, Management and Accounting
at the Universidade de São Paulo (FEA-USP). Associate Professor for the Department of Applied Social Sciences at the Universidade Federal do Paraná (UFPR). Av. Prefeito Lothário Meissner, 632, Campus III, Jardim Botânico, Curitiba – PR – Brasil – CEP 80210-170
E-mail: [email protected]
GERLANDO AUGUSTO SAMPAIO FRANCO DE LIMA
Tenured Professor from the College of Economics, Management and Accounting at the Universidade de São Paulo (FEA-USP). Associate Professor for the School of Economics, Management and Accounting at the Universidade de São Paulo. Av. Professor Luciano Gualberto, 908, Prédio 3, Cidade Universitária, São Paulo – Brasil – CEP 05508-900
133
A B S T R A C T
Purpose: The goal of this study is to identify the relationship of absorbed, non--absorbed and potential slack with the innovation of companies of sectors mem-bers of the sectoral ranking of innovation in the Brazilian Index of Innovation (IBI) listed in BM&FBovespa.
Originality/gap/relevance/implications: Organizational slack and innovation have been objects of study internationally, but still represent a research gap in Brazil. Also there were not identified studies using the intangible asset to measu-re innovation and the possible measu-relations with the organizational slack measumeasu-res. This theme can also support the strategic activities of organizations, such as contributing to the creation of competitive advantage.
Key methodological aspects: Descriptive research with quantitative approach was carried out using financial data of 208 companies listed in BM&FBovespa classi-fied as innovative according to the Index Brazil of Innovation. Information regar-ding intangible assets, used as metrics to measure the innovation, was collected from the Notes; and the data to calculate the measures of organizational slack were collected from Economática® database.
Summary of key results: In the application of the panel data model, the results demonstrate a significant relationship between organizational slack and inno-vation. The potential and absorbed slacks impact significantly and positively the innovative process. Non-absorbed slack influences positively, but with relatively smaller impact compared to other measures.
Key considerations/conclusions: It is concluded that the results indicate a rela-tionship in greater degree of absorbed and potential slack and to a lesser degree of non-absorbed slack with the innovation of the companies surveyed.
K E Y W O R D S
134
1
I N T R O D U C T I O N
The operating environment of organizations is influenced by constant technological advances, by changes in the profile of clients and in the eco-nomic scenarios, and by intense pressure from competitors. This requires a dynamic management in organizations and that the internal environment be constantly evolving to conform to the external requirements. To ensure conti-nuity, companies need to respond satisfactorily to the demands and needs of customers, however, on the other end, they can influence the environment in which they operate, especially through innovation (Hurley & Hult, 1998).
This dynamic and competitive environment requires companies to make investments in innovation. According to Schumpeter (1988), innovation plays a fundamental role in the economic development, where production standards are changed, providing differentiation among companies. According to the Organi-zation for Economic Co-operation and Development (OECD, 2005), innovation comprises significant investments, including the acquisition of intangible assets with potential profitability for a period of far-off time.
Among the various means to verify the innovation, this study focuses on the records of intangible assets of companies. The item II, of § 1, of art. 178, of Law 6,404/1976 (Brazil, 1976), introduced by Law 11,638/2007 (Brazil, 2007), establishes that intangible assets must be recorded in the Non-Current Assets group, in the Balance Sheet. The technical pronouncement CPC 04 R1 (CPC, 2008, p. 7), based on the International Accounting Standard (IAS) 38, cha-racterizes the “intangible asset as an identifiable non-monetary asset without physical substance”.
Santos, Silva, Gallon and De Luca (2012, p. 200) highlight that “studies of foreign authors (Rogers, 1998; Lev, 2001; Darroch & McNaughton, 2002; Edvinsson, Dvir, Roth, & Pasher, 2004; Narvekar & Jain, 2006; Mudambi, 2008) investigating the intangible asset and innovation issues, found certain affinity between them”. Also, they mention studies conducted by Brazilian authors that had similar results, such as Teh, Kayo and Kimura (2008), Tironi and Cruz (2008), and Crisóstomo (2009).
135 It is in this context that emerges the importance of organizational slack in
companies. Different organizational slack concepts are found in the literature, outstanding among them: resources acquired over the operations and that are not committed to a necessary expenditure (Dimick & Murray, 1978); cushion of resources and untapped opportunities in the organization (March, 1979); existing resources in the organization above its real needs, which will become part of the company’s routine (Moses, 1992); excess resources in the organization in relation to the minimum necessary to carry out productive activities (Nohria & Gulati, 1996).
The organizational slack can be configured in a variety of ways in compa-nies, such as innovation, R&D, human resources, decision-making, among others. There is a wide field of its application in organizations (Dallabona & Beuren, 2012). Poynter and White (1985) point out that the organizational slack is important, as it is related to the ability to innovate and create new forms of strategy. Investigating how different types of organizational slack can relate to innovation activities is necessary in the business sector (Nohria & Gulati, 1996). Yang, Wang and Cheng (2009) warn that excess resources in the company, from a certain point, can fail to have a positive impact on innovation and minimize performance in innovation.
Among the different types of organizational slack addressed in the litera-ture, the focus of this study is on the slack of financial resources, highlighting three specific categories: absorbed slack, unabsorbed slack and potential slack. Absorbed slack is characterized by the resources that at a given time were absorbed by an organization, and that can be recovered through increased effi-ciency, for example, reducing costs that were elevated (Moses, 1992; Herold, Jayaraman, & Narayanaswamy, 2006).
Unabsorbed slack, according to Thomson and Millar (2001, p. 66), “is related to the net slack of liquid resources and can be quickly allocated to improve pro-ductivity or contribute to the achievement of a particular goal”. Potential slack, in turn, refers to the ability of a company to obtain extra resources from the envi-ronment, i.e., the ability to create extraordinary resources, for example, ability to increase capital, additional loan or investment in market stock (Bourgeois III & Singh, 1983; Moses, 1992; Cheng & Kesner, 1997).
136
Based on the above, the research question is: What is the relationship between the types of organizational slack and the innovation of companies, mea-sured based on intangible assets? Thus, the objective of this study is to identify the relationship between absorbed, unabsorbed and potential slack and the inno-vation of companies of sectors members of the sectoral innoinno-vation ranking of the Innovation Brazil Index (IBI) listed on BM&FBovespa.
This research is justified by its theoretical contribution, since there are few studies involving these variables in the national sphere. Organizational slack and innovation have been objects of study in the international sphere (Damanpour, 1991; Nohria & Gulati, 1996; Geiger & Cashen, 2002; Geiger & Makri, 2006; Herold et al., 2006; Huang & Chen, 2010; Chen, Yang, & Lin, 2013), but still rep-resent a research gap in the national sphere (Quintas & Beuren, 2011).
Also, it was not found studies using the intangible asset to measure innova-tion and their possible relainnova-tionships with organizainnova-tional slack measures. However, more studies on intangible assets have been conducted, especially given the sce-nario of convergence with the international accounting standards, supported by Law n. 11,638/2007 (Brazil, 2007) and Law n. 11,941/2009 (Brazil, 2009), as well as the publication of the Technical Pronouncement 04 – Intangible Assets (CPC, 2008). This study is also justified by its relevance to the organizations, since it contributes to a possible creation of competitive advantage, representing a kind of support in the strategic activities.
2
T H E O R E T I C A L B A C K G R O U N D
2 . 1
O R G A N I Z AT I O N A L S L A C KSeveral concepts of organizational slack are found in the literature. However, the most widely adopted definition for organizational slack is Bourgeois III’s (1981, p. 30), paraphrased from Cyert and March (1963) from the publication of the book The Behavioral Theory of the firm, which characterizes it as “cushion of potential and real resources that causes organizations to adapt satisfactorily to the numerous changes in the environment in which they operate, including adaptation of strategies before the external environment”.
137 Sender (2004, p. 9) explains that “the term antecedent refers to factors
which, according to the literature examined, can influence the existence, the composition and the level of organizational slack”. Thus, it comprises the facts, attitudes and actions that enable the appearance of slack in the business environ-ment, and are grouped in: industry (structure in which the company operates, i.e., external characteristics), organization (internal characteristics of the company), and interest groups (beliefs and values). Each of these can influence the level and type of organizational slack of an entity, for example, the bigger the firm, the higher the level of slack (Sharfman, Wolf, Chase, & Tansik, 1988).
According to Sender (2004), the process of organizational slack itself comprises nature, types and measures. As for nature, it is divided into human resources (employees), physical resources (tangible acquired or produced by the entity), and financial resources (cash for immediate use). The types of slack can be segregated regarding to availability (available, recoverable and potential), absorption by the organization (absorbed, absorbed immediate and non-absorbed potential), and autonomy of use (low autonomy and high autonomy). In turn, the slack measures can be broken down into potential, recoverable and available slack.
The last component of the organizational process proposed by Sender (2004) contemplates the role of slack in the business community, involving strategic behavior, growth of the company, coalition management, response to the envi-ronment and employee motivation. Mostly, it comprises contributions and posi-tive implications, benefiting the organizations, although some authors, as Facó and Csillag (2010) and Chen, Yang and Lin (2013) point out negative aspects of the organizational slack.
Regarding the innovation process, organizational slack may contribute to the innovation performance, reduce additional costs with innovation and create a culture of experiments. However, the slack can also be a negative force to the innovative process, providing risk to the business, becoming problem organi-zational agents (Keegan & Turner, 2002; Tan & Peng, 2003; Yang et al., 2009; Huang & Chen, 2010).
Facó and Csillag (2010) explain that the excess or lack of resources (human, physical, patrimonial, financial, technological, etc.) can impact the operational performance of companies, especially when it comes to innovation, expansion and creation of new businesses. The authors also point out that the theme of organizational slack and innovation can be seen from an angle that, at the same time, can provide incentives for innovative opportunities, and also losses and expenses that negatively affect companies’ results.
operationaliza-138
tion of the calculation of measures was Bourgeois III (1981), entitled On the Measurement of Organizational Slack, that proposed the use of secondary data (financial) for the measurement of organizational slack. Then, mechanisms to measure the organizational slack are presented, which, according to Sender (2004, p. 18), “is subdivided into potential, recoverable and available”, or, respec-tively, potential, absorbed and unabsorbed.
2 . 2
M E A S U R E S O F O R G A N I Z AT I O N A L S L A C KThe pioneer study by Bourgeois III (1981), supplemented by Bourgeois III and Singh (1983), served as basis for much of the research in the area involving measures of organizational slack. This wide acceptance possibly derives from the characteristic of “a mechanism which can be used as a first way to detect the organizational slack in an entity without requiring the cooperation of the organi-zations themselves for providing data, since they are inferred from the financial records” (Bourgeois III, 1981, pp. 36-37).
Gary (2005) states that to operationalize certain measure of organizational slack, it is necessary to know and discriminate the work demands in the business context, including the level of resources to be used in meeting these demands. In this sense, Sender (2004) highlights three types of organizational slack addressed in the literature: potential slack, recoverable/absorbed slack, and available/ unabsorbed slack.
Potential slack refers to the company’s ability to obtain extra resources from the environment, i.e., the ability to create extraordinary resources before the environment, for example, ability to increase capital, additional loan or invest-ment in market stock (Bourgeois III & Singh, 1983; Moses, 1992; Cheng & Kes-ner, 1997). Potential slack, according to Sender (2004, pp. 21-23) comprises “the unused borrowing capacity of the company” (Cheng & Kesner, 1997); “the ability to generate resources” (Rust & Katz, 2002); “the ability to raise loans for future investments, to take risk and raise additional loans, raise additional equity, and dividend payments” (Greenley & Oktemgil, 1998; Bourgeois III & Singh, 1983); and “profitability” (Marino & Lange, 1983).
139 generate net resources in excess to short-term bonds, to generate internal capital
for future investments, and to obtain surplus revenue from employees (Greenley & Oktemgil, 1998)”.
Available/unabsorbed slack, according to Thomson and Millar (2001, p. 66), “is related to the net slack of net resources and can be quickly allocated to improve productivity and contribute to the fulfillment of a certain goal”. These resources have not yet been assimilated to the technical design of the entity, possibly being related to a liquidity excess (Bourgeois III & Singh, 1983; Cheng & Kesner, 1997). When processing the unabsorbed slack calculations, it is observed, according to Sender (2004, p. 26), “the slack invested in working capital, salaries, overhead expenses, various administrative expenses, fixed and current assets (Greenley & Oktemgil, 1998); and the value of net resources not committed to liabilities in the near future (Sing, 1986)”.
These three ways of measuring organizational slack were used in this research, and the adopted metrics are displayed in the section that presents the construct of the research. In the empirical analysis, the three types of organiza-tional slack were initially calculated, and, as a result, its relationship with innova-tion was investigated, based on the intangible assets disclosed by the companies object of study.
2 . 3
I N N O VAT I O N A N D I N TA N G I B L E A S S E T SThe meaning of Innovation flourishes the idea of news or even renovation. In the third edition of the Oslo Manual, innovation is characterized as the imple-mentation process of a new product, good or service or significantly improved, or even a process or a new organizational method in the business practices, whether in the workplace or in the external relationships (Santos et al., 2012).
The process of innovation can occur in an organization because of the inten-tion of conquering new markets or simply the need to remain competitive in its current market. Cassiman, Golovko and Martínez-Ros (2010) found strong evidence that innovation affects productivity and leads small non-exporting com-panies to join in the export market.
140
In competitive markets, companies with significant investments in R&D can develop different organizational structures to speed up the innovation pro-cess (Dahlander & Gann, 2010). Researches that achieve positive results are able to provide companies with certain intangible assets, such as the registration of trademarks and patents of a given product. Santos et al. (2012) allege that com-panies with strong innovative character have intensive investments in intangible assets.
In Brazil, section VI of art. 179 of Law n. 6,404/1976 (Brazil, 1976), intro-duced by Law n. 11,638/2007 (Brazil, 2007), states that intangible assets are clas-sified as rights whose subjects are intangible assets intended for the company’s maintenance or used for this purpose. To establish the criteria for accounting, recognition and measurement of these assets, the Accounting Pronouncements Committee (Comitê de Pronunciamentos Contábeis – CPC) issued the Technical Pronouncement CPC 04 R1, which conceptualizes intangible assets as an “iden-tifiable non-monetary asset without physical substance” (CPC, 2008).
Intangible assets can also be defined as non-material factors that contribute to the company’s performance, whether in the production of goods or the provi-sion of services, in order to generate future economic benefits to the entities or individuals that control them (Kramer, Marinelli, Iammarino, & Diez, 2011).
Den Hertog, Bilderbeek and Maltha (1997) criticize the idea that innova-tion is only related to technological aspects. They claim that intangibles have proven that they are essential to innovation. Kramer et al. (2011) went further by reporting that intangible assets started to be seen as key drivers on innovation and knowledge creation, contributing to the economic growth, entitling them as drivers of innovation.
Perez and Famá (2006) identified a strong correlation between the per-formance of US companies and the corresponding investments in intangible assets. They also highlight that assets, such as trademarks, patents, intellectual capital and copyright, are unique assets, usually coming from innovation and knowledge. From the observation of the role of intangible assets for innovation by enterprises, it is inferred that a greater degree of newness requires higher pro-portion of intangible absorption in the innovative activity (Tironi & Cruz, 2008). Resulting from this innovative process, the creation of value in companies emerges as a favorable point. While Crisóstomo (2009) corroborates this asser-tion, pointing out that the wealth of the company is generated by the innovaasser-tion, Kremer et al. (2011) argue that the sources of value creation are increasingly dependent on intangible assets, strengthening the belief on the existence of the relationship between innovation and intangibles.
141 since they represent a source of value creation (Kremer et al., 2011). Perez and
Famá (2006) found out that companies with higher share of intangible assets generated more value for its shareholders and that, in the analyzed period, the tangible assets have provided to the companies only regular profits, while the value creation was originated by intangible assets.
Ritta and Ensslin (2010) analyzed the relationship between intangible assets and financial variables in 47 non-financial companies with the highest trading volumes on BM&FBovespa. They identified the existence of a positive relation-ship between intangible assets and the variables analyzed, verifying that invest-ments in intangibles cause an increase in revenue, adding value to the equity and valuation of shares. Therefore, they are strategic resources, according to Santos et al. (2012).
3
M E T H O D O L O G I C A L P R O C E D U R E S
3 . 1
P O P U L AT I O N A N D S A M P L EThe population of this research comprised, initially, companies of mem-bers of the sectoral innovation ranking of Brazil Innovation Index (IBI), with the assumption that, by being innovative, they have investments in intangible assets. The ranking to collect the innovative sectors is based on the Survey of Technological Innovation (Pesquisa Industrial de Inovação Tecnológica – Pintec), conducted by IBGE in 2005, and in the IBI’s Guide, Second Edition, 2007.
Furtado et al. (2007) explain that the IBI consists of macro indicators, divided into Aggregate Effort Indicator (Indicador Agregado de Esforço – IAE), which assess efforts such as spending on purchase of machinery and equip-ment, investments in research and development; and Aggregate Result Indica-tor (Indicador Agregado de Resultado – IAR), related to the business potential of creating patents and the impact of innovations in net income of sales of products characterized as innovative. Another important aspect of IBI methodology is the voluntary compliance of companies to the project, under the assumption that the provision of information on innovation is limited, and the increasing participa-tion of companies would be an encouragement to others to also adhere to the IBI (Furtado et al., 2007).
142
After that, the 22 industrial segregation of the National Economic Indus-trial Classification (Classificação Nacional de Atividades Econômicas – CNAE) were grouped into quartiles according to the intensity of R&D. Investments in R&D were used due to the relevance of spending on R&D in the process of measure-ment of innovation in the companies, as recommended by Furtado et al. (2007), besides the fact that they enable comparisons between international indicators of technological intensity.
Therefore, considering the sectors indicated as innovative in the second edi-tion of IBI, the companies listed on BM&FBovespa were identified, as shown in Chart 1.
cHaRt 1
INNOVATIVE COMPANIES LISTED ON BM&FBOVESPA
IBI INNOVATION GROUPS
CNAE 2.0 ACTIVITIES – PINTEC 2005
CORRESPONDING SUBSECTORS AT BM&FBOVESPA
NO. OF COMPANIES BY SUBSECTOR AT
BM&FBOVESPA
Group 1 – High-technology
Manufacture of other transport equipment, Computing activities and related services, Industrial instrumentation and automation, Machinery for office and computer equipment, Manufacture of machinery, Appliances and electrical equipments and vehicles, trailers and bodies.
Transport equipment, Electrical Equipment, Programs and Services, Computers and Equipments, Automobiles & Motorcycles and Services. 44 Group 2 – Medium-high technological intensity
Electronic and appliances and equipment for
telecommunications, Oil and alcohol refining, Manufacture of machinery and equipment, Manufacture of chemicals, Telecommunications and Manufacture of furniture and various industries.
Oil, gas and bio-fuels, Chemicals, Machinery and Equipment, Personal use and Cleaning Products, Health, Household goods, Fixed Telephony, Mobile Telephony and Gas.
67
143 cHaRt 1 (conclusion)
INNOVATIVE COMPANIES LISTED ON BM&FBOVESPA
IBI INNOVATION GROUPS
CNAE 2.0 ACTIVITIES – PINTEC 2005
CORRESPONDING SUBSECTORS AT BM&FBOVESPA
NO. OF COMPANIES BY SUBSECTOR AT
BM&FBOVESPA
Group 3 – Medium-low technological intensity
Manufacture of rubber and plastic products, manufacture of non-metallic mineral products, Leather, footwear and manufacture of leather goods, Manufacture of tobacco-derived products, Manufacture of cellulose, paper and paper products, Manufacture of apparel and accessories and Manufacture of textiles.
Wood and Paper, Packaging, Various materials, Tobacco, Textiles and Apparel and Footwear.
41
Group 4 – Low technological intensity
Manufacture of metal products, Extractive industries, Primary metallurgy, Manufacture of wood products, Manufacture of food products and beverages and Publishing, printing and reproduction of recorded media.
Mining, Steel and Metallurgy, Various materials, Processed Food, Beverages, and Other Media.
56
Source:Elaborated by the authors, classified according to the proposition of Santos et al. (2012).
It is observed in Chart 1 that, out of the 551 companies listed on BM&FBovespa, 208 are classified into sectors considered innovative according to IBI. To consti-tute the final sample, totalizing 112 companies, 96 companies were excluded because they did not have the data necessary to calculate the organizational slack and/or did not disclose the information about the intangible, in any of the three periods analyzed (2010 to 2012).
3 . 2
P R O C E D U R E S O F D ATA C O L L E C T I O N A N D A N A LY S I S144
of intangible assets of companies surveyed, Explanatory Notes from the periods of 2010, 2011 and 2012 were researched, collecting the data that discriminated the amount in each year in the Standardized Financial Statements, available on BM&FBovespa website. This set of data allowed the calculation of indicators, as in Chart 2, with the construct used to identify the types of organizational slack and the innovation.
cHaRt 2
CONSTRUCT WITH ORGANIZATIONAL SLACK AND INNOVATION MEASURES
INDICATORS METRICS OF CALCULATION
Slack
Potential Equity/Third Party Capital
Available/Unabsorbed Net Income - Dividends/Sales (+) Available - Current liabilities/Sales (-) Dividends/Equity
Recoverable/Absorbed Expenses/Sales (+) Receivables/Sales (+) Inventories/Sales
Innovation Composition of intangible assets listed in the Explanatory Notes of the Financial Statements.
Source: Adapted from Bourgeois III and Singh (1983), Singh (1986), Cheng and Kesner (1997), Greenley and Oktemgil (1998), Thomson and Millar (2001), Rust and Katz (2002),
Dallabona and Beuren (2012).
The tabulation of data on intangible assets of selected companies was car-ried out by using the EmpresasNet system and the information available on BM&FBovespa website. Databases imported into EmpresasNet system have the financial information necessary to capture the relationships of intangible assets of companies surveyed. In the Explanatory Notes of the Standardized Financial Statements for the years 2010, 2011 and 2012, the composition of intangible assets of each company was collected and tabulated into a Microsoft Excel spread-sheet for further crossing with the organizational slack measures.
3 . 3
A N A LY S I S M O D E L145 cross-sections are not able to detect (Baltagi, 2008). For the realization of
statisti-cal procedures, the following model was drawn up:
INTANG = βo β1FPOT + + + β2 FDISPON β3FRECUP + β4 VARCON-TROLE + ε
In which:
INTANG = Intangible FPOT = Potential Slack
FDISPON = Available / Unabsorbed Slack FRECUP = Recoverable / Absorbed Slack VARCONTROLE = Control Variables
ε = Error term
To restrict the relationship between the research variables and to minimize possible problems of variables endogeneity, i.e., correlation between the regres-sors and terms of error of the model (Wooldridge, 2002), the data regarding the size of companies and their respective groups of innovation of IBI were used as control variables. As regards to the size of companies, the classification of the National Bank for Economic and Social Development (BNDES, 2013) was adopted, which considers the annual gross income. Once the model was defined, the data was analyzed using the software Statistics Data Analysis 12.0 (Stata).
4
DISCUSSION AND ANALYSIS OF RESULTS
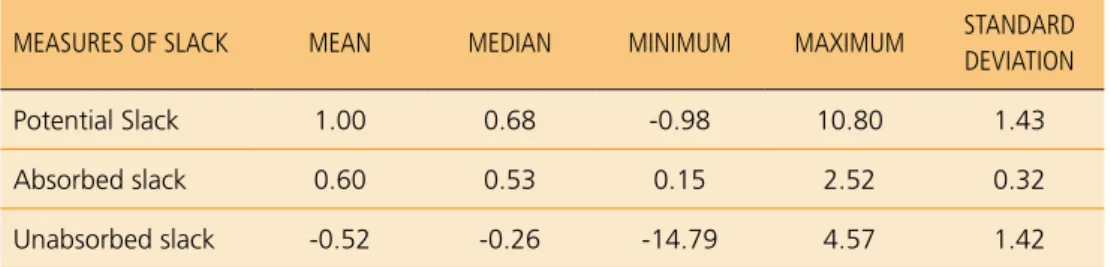
Table 1 shows the descriptive analysis of the three types of organizational slack: potential, absorbed and unabsorbed.
table 1
DESCRIPTIVE ANALYSIS OF THE TYPES OF SLACK
MEASURES OF SLACK MEAN MEDIAN MINIMUM MAXIMUM STANDARD DEVIATION
Potential Slack 1.00 0.68 -0.98 10.80 1.43 Absorbed slack 0.60 0.53 0.15 2.52 0.32 Unabsorbed slack -0.52 -0.26 -14.79 4.57 1.42
Source: Elaborated by the authors.
146
with mean of 1.00 and median of 0.68. As for the standard deviation, the type of slack that is closer to the average of the calculated slack indicators is the absorbed slack, with 0.32, which evaluates the relationship among costs, receivables, inventory and sales. The potential and unabsorbed slacks had a similar standard deviation, representing a greater variability around the mean.
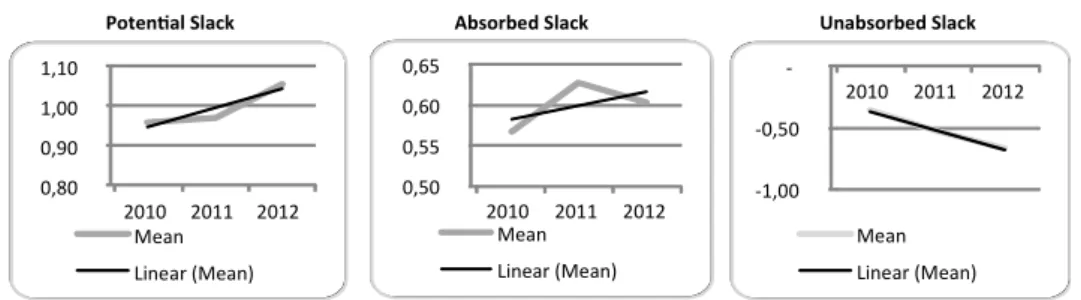
Graph 1 presents a panel with mean and trend lines of the types of slack in the years 2010, 2011 and 2012.
gRapH 1
PANEL OF MEAN AND TREND LINES OF THE TYPES OF SLACK
Unabsorbed Slack Potenial Slack Absorbed Slack
0,80 0,90 1,00 1,10
2010 2011 2012 Mean Linear (Mean) 0,50 0,55 0,60 0,65
2010 2011 2012 Mean
Linear (Mean)
-1,00 -0,50
-2010 2011 2012
Mean Linear (Mean)
Source: Elaborated by the authors.
In Graph 1, it is noticed that in the period from 2010 to 2012, the trend lines used to represent trends or forecasts of future data show an increasing behavior for potential and absorbed slacks and decreasing for the unabsorbed slack, indicating an increase in the organizational slack over the time. George (2005) argues that, over the years, companies tend to have more slack of resources, being able to use the excess resources to improve their performance and their activities.
Table 2 shows the number of companies and mean by type of organizational slack for each IBI innovation group.
table 2
ORGANIZATIONAL SLACK MEAN IN THE IBI INNOVATION GROUPS
IBI INNOVATION GROUPS N. OF COMPANIES N. OF COMPANIES (%) MEAN OF POTENTIAL SLACK MEAN OF ABSORBED SLACK MEAN OF UNABSORBED SLACK
Group 1 – High technology 21 19% 0.66 0.53 -0.54 Group 2 – Median-high
technological intensity 35 31% 0.83 0.57 -0.60
147 table 2 (conclusion)
ORGANIZATIONAL SLACK MEAN IN THE IBI INNOVATION GROUPS
IBI INNOVATION GROUPS N. OF COMPANIES
N. OF COMPANIES
(%)
MEAN OF POTENTIAL
SLACK
MEAN OF ABSORBED
SLACK
MEAN OF UNABSORBED
SLACK
Group 3 – Median-low
technological intensity 29 26% 1.23 0.73 -0.62 Group 4 – Low technological
intensity 27 24% 1.23 0.55 -0.30
Grand Total 112 100%
Source: Elaborated by the authors.
It is verified in Table 2 that, out of the total of companies surveyed, 31% fall in Group 2, medium-high technological intensity. The innovation group with fewer companies was Group 1 – high-technology, with 21 companies, which corresponds to 19% of the total sample. Regarding the mean of types of slack, Group 3 – medium-low technological intensity showed higher mean of potential and absorbed slack, and lower mean of unabsorbed slack among the companies, respectively, 1.23, 0.73 and -0.62.
After calculating the organizational slack (potential, unabsorbed, absorbed) and the composition of intangible assets in the years of 2010, 2011 and 2012, calculated with the aid of Microsoft Excel electronic spreadsheets, the panel data model was applied using the software Statistics Data Analysis 12.0 (Stata). The basic unit of study was represented by companies, observed in three periods of time. The data set is characterized as a short panel type, i.e., has a high quantity of cross observations (companies), in a few longitudinal instants (time).
Initially, the pooled model (Ordinary Least Squares – OLS) was adopted, con-sidering the types of slack and the variables of size control, and IBI innovation group as explanatory variables, and the intangible assets (excluding goodwill) as proxies of innovation in companies. From the results, the panel diagnostic tests were conducted, which are intended to identify the most appropriate model to make the regression.
148
hypothesis that the pooled model is the most relevant, aiming at indicating whether the pooled model is the most appropriate before the random effects model (p-value 0.000). Finally, the Hausman test was conducted, which com-pares the consistency and efficiency between models of random effects and fixed effects, and the rejection of H0 reveals that the fixed effects model is the best for realizing the regression (p -value 0.470).
In the results of diagnostic tests of the panel data and their respective sig-nificance levels, as the indicative hypothesis that the models of fixed effects and pooled are the most appropriate was not accepted, the random effects model was assumed as the most consistent, which showed a p-value of 0.000 in the final test of Breusch-Pagan. After that, the random effects model was processed to verify the relationship between intangible assets and independent explanatory variables.
In order to normalize the data, a logarithmic variable was created for the dependent variable. For the control variable of the size of companies, four dummy variables were created to indicate if companies are small, medium, medium-large or large. And for the control variable of the IBI innovation group, four dummy variables were created, in order to demonstrate whether the enti-ties are of medium, medium- low, medium-high or high technological intensity. Table 3 presents the data of the correlation between variables and significance.
table 3
CORRELATION BETWEEN VARIABLES AND SIGNIFICANCE
DEPENDENT VARIABLE NUMBER OF OBSERVATIONS
NUMBER
OF GROUPS R² WITHIN R² BETWEEN R² OVERALL
lny (log of Intangible Assets) 336 112 0.0768 0.2584 0.2555 Wald chi2 (9): 55,51 Prob > chi2: 0,0000*
* Significant at 5%
Predictors:(Constant), Potential, absorbed and unabsorbed slacks; Dummy for Size and IBI Innovation Group
Source: Elaborated by the authors.
149 proposed model in the random effects models, 25.55% of the variability in the
percentage of intangible assets is explained by the independent variables (poten-tial, absorbed and unabsorbed slack) and control variables.
It was found out that the organizational slack, taking into consideration the size and IBI innovation group, may impact the level of innovation of organiza-tions surveyed. Although they seem small, the R² values indicate a satisfactory adequation of the proposed model, since it is common for panel data models to offer low R² values (Fávero, Belfiore, Silva, & Chan, 2009).
The findings of this research are similar to the preconized by Yang et al. (2009), that the level of organizational slack can greatly impact the innovation process. When checking the relationship of each measure of slack with innova-tion, from the intangible assets, as shown in Table 4, some significant relation-ships among the variables can be inferred.
table 4
COEFFICIENTS OF THE RANDOM EFFECTS MODEL
EXPLANATORY VARIABLES COEFFICIENT STD. ERROR Z SIG: P > |Z|
Potential Slack 0.1803 0.0513 3.51 0.000* Absorbed Slack 0.4806 0.2724 1.76 0.078** Unabsorbed Slack 0.0537 0.0366 1.47 0.143*** Dummy – Large Size 5.0954 1.5905 3.2 0.001* Dummy – Medium – Large Size 2.3602 1.6888 1.4 0.162 Dummy – Medium Size -0.9181 2.2145 -0.41 0.678 Dummy – Small Size 0 (omitted)
Dummy – High Tech 0.2113 0.7861 0.27 0.788 Dummy – Medium-High Tech 0.7279 0.6912 1.05 0.292 Dummy – Medium-Low Tech -0.9032 0.7301 -1.24 0.216 Dummy – Low Tech 0 (omitted)
Dummy 5.7048 1.6761 3.4 0.001
* Significant at 5%. ** Significant at 10%. *** Significant at 15%.
150
It can be noticed in Table 4 that the measures of organizational slack were statistically significant with the dependent variable, which has the intangible assets as a metric to measure innovation, in the respective significance levels demonstrated. Regarding the control variables of IBI innovation and part of the size control variables, there was no statistically significant relationship.
In contrast, the dummy variable indicates that the large companies stand-out, at the significance level of 0.001. Its coefficient of 5.0954 indicates a positive impact on the measures of slack in the innovation process. This is consistent with the results of the research by Sharfman et al. (1988) and Sender (2004), that found out that the larger the size of the companies, the greater the level of organizational slack.
As for the potential slack, with significance at the level of 1%, the data sug-gest a positive impact on innovation, since the higher the potential slack, the higher the investments in intangible assets. Thus, for each change in a potential slack unit, there is an increase of 18.03% in intangible assets (in thousands of Brazilian Reais).
Regarding the absorbed slack, the results also indicate a positive relation-ship with the percentage of intangible assets, thus, the increase in the absorbed slack contributes to the innovative process in 48.06% in intangible assets (in thousands of Brazilian Reais). Similar results were found by Nohria and Gulati (1996) and Huang and Chen (2010) that report that the absorbed slack directly impacts on the innovation process.
Regarding the unabsorbed slack, although it is significant only at the level of 15%, there is a relationship among the variables, but with a relatively lower increase compared to the potential and absorbed slacks. This result is similar to the inferences of Greve (2007), and Vinces, Cepeda-Carrión and Chin (2012), indicating that a high level of unabsorbed slack can cause problems in the inno-vation process and impact development projects.
Thus, the results of this research are in line with those disclosed in the literature, such as Keegan and Turner (2002) and Tan and Peng (2003), that found that organizational slack may contribute to innovation performance, reduce additional costs with innovation and create a culture of experiments.
5
C O N C L U S I O N S
151 BM&FBovespa. The descriptive analysis revealed that, in the measures of
orga-nizational slack, the potential slack differed the most, with a mean 1.00 and median of 0.68. Regarding the standard deviation, the absorbed slack was the closest to the mean of slack indicators, with a value of 0.32, and the potential and unabsorbed slack had similar standard deviations, which shows a greater variability around the mean. In documentary research regarding the intangible assets, the representation of these assets in funds invested in innovation was observed, indicating their contribution to the innovative process, generating knowledge and value creation for the companies.
In the panel data analysis, the first test conducted was the estimator of fixed effects, followed by the Breusch-Pagan test and, finally, the Hausman test. They showed the random effects model as the most appropriate to verify the relation-ship between intangible assets and the independent explanatory variables. In this model, it was observed that 25.55% of the variability of intangible assets was explained by the dependent variables (potential, absorbed and unabsorbed slack) and the control variables. This information and the values of R² indicate a satis-factory adequation of the model, allowing to infer that the organizational slack can impact on the level of innovation of the companies surveyed.
With the results presented, as well as in studies by Sharfman et al. (1988) and Sender (2004), it is possible to state that, in the sample studied, the larger the size of the company, the greater its organizational slack. The survey results demonstrate that the higher the potential and absorbed slacks, more innovative the companies are. Regarding the unabsorbed slack, the results show a less sig-nificant relationship between the variables, corroborating the inferences of Greve (2007), and Vinces et al. (2012), that argued that a high level of unabsorbed slack is able to generate problems in the innovation process and negatively influence the development projects.
152
It is important to highlight that the companies surveyed are the ones with shares listed on BM&FBovespa, but only the ones with Brazilian stock control. Thus, the analysis of companies with foreign capital compared to these national companies can be carried out in a future research in order to contribute to the results of this study. It is also recommended to analyze the relationships between the types of organizational slack and the generation of innovations less depen-dent on traditional investments, in order to investigate new ways of idepen-dentification and generation of innovation in companies. Similarly, other factors that explain the degree of innovation of companies can be investigated, such as the culture of countries of origin of these organizations, besides other elements that represent the investments of companies in innovation, including in another timeline.
RELAÇÃO ENTRE FOLGA ORGANIZACIONAL
E INOVAÇÃO EM EMPRESAS DA BM&FBOVESPA
R E S U M O
Objetivo: O estudo objetiva identificar a relação da folga absorvida, inabsorvida e potencial com a inovação de empresas de setores membros do ranking setorial de inovação do Índice Brasil de Inovação (IBI) listadas na BM&FBovespa.
Originalidade/lacuna/relevância/implicações: A folga organizacional e a inovação têm sido objetos de estudo em âmbito internacional, mas ainda representam uma lacuna de pesquisa no Brasil. Também não foram identificados estudos que utili-zaram o ativo intangível para mensurar a inovação e as possíveis relações com as medidas de folga organizacional. Esse tema também pode apoiar as atividades estra-tégicas das organizações, como contribuir para a criação de vantagem competitiva.
Principais aspectos metodológicos: Uma pesquisa descritiva com abordagem quantitativa foi realizada utilizando dados financeiros de 208 empresas listadas na BM&FBovespa classificadas como inovadoras segundo o Índice Brasil de Ino-vação. As informações relativas aos ativos intangíveis, utilizadas como métricas para medir a inovação, foram extraídas das Notas Explicativas; e os dados para calcular as medidas de folga organizacional foram coletados da base de dados da Economática®
.
153
Principais considerações/conclusões: Conclui-se que os resultados apontam relação em maior grau da folga absorvida e da potencial e em menor grau da folga inabsorvida com a inovação das empresas pesquisadas.
PA L AV R A S - C H AV E
Folga absorvida. Folga inabsorvida. Folga potencial. Inovação. Intangível.
RELACIÓN ENTRE HOLGURA ORGANIZACIONAL
E INNOVACIÓN EN EMPRESAS DE LA BM&FBOVESPA
R E S U M E N
Objetivo: El objetivo de este estudio es identificar la relación de la holgura absor-bida, no absorbida y potencial con la innovación de las empresas de los sectores miembros de la clasificación sectorial de la innovación en el Índice Brasileño de Innovación (IBI) que figuran en la BM&FBovespa.
Originalidad/laguna/relevancia/implicaciones: La holgura organizacional y la innovación han sido objetos de estudio a nivel internacional, pero aún repre-sentan una brecha de investigación en Brasil. También no fueron identificados estudios utilizando el activo intangible para medir la innovación y las posibles relaciones con las medidas de holgura organizacional. Este tema también puede apoyar las actividades estratégicas de las organizaciones, tales como contribuir a la creación de una ventaja competitiva.
Principales aspectos metodológicos: La investigación descriptiva con enfoque cuantitativo se realizó con los datos financieros de las 208 empresas que figuran en la BM&FBovespa clasificadas como innovadoras según el Índice de Innova-ción Brasil. La informaInnova-ción relativa a los activos intangibles, utilizados como indicadores para medir la innovación, fueron extraídos de las Notas Explicativas; y los datos para calcular las medidas de holgura organizacional se recogieron de la base de datos Economatica®.
154
Principales consideraciones/conclusiones: Se concluye que los resultados apun-tan una relación en mayor grado de holgura absorbida y potencial y en menor grado de holgura no absorbida con la innovación de las empresas encuestadas.
PA L A B R A S C L AV E
Holgura absorbida. Holgura no absorbida. Holgura potencial. Innovación. Inmaterial.
R E F E R E N C E S
Baltagi, B. H. (2008). Forecasting with panel data. Journal of Forecasting, 27, 153-173.
Banco Nacional de Desenvolvimento Econômico e Social (BNDES) (2013). Classificação e porte das empresas. Retrieved November 20, 2013, from http://www.bndes.gov.br/SiteBNDES/bndes/ bndes_pt/Institucional/Apoio_Financeiro/porte.html.
Bolsa de Valores, Mercadorias e Futuros de São Paulo (BM&FBovespa) (2013). Empresas listadas. Retrieved November 20, 2013, from http://www.bmfbovespa.com.br/Cias-Listadas/Empresas-Lis-tadas/BuscaEmpresaListada.aspx?idioma=pt-br.
Bourgeois III, L. J. (1981). On the measurement of organizational slack. Academy of Management Review, 6(1), 29-39.
Bourgeois III, L. J., & Singh, J. V. (1983). Organizational slack and political behavior among top management teams. Academy of Management Proceedings, 43-47.
Brasil. Lei n. 6.404, de 15 de dezembro de 1976. Dispõe sobre as sociedades por ações. Brasília, DF. Retrieved November 20, 2013, from http://www.planalto.gov.br/ccivil_03/leis/l6404compilada.htm. Brasil. Lei n. 11.638, de 28 de dezembro de 2007. Altera e revoga dispositivos da Lei n. 6.404, de 15 de dezembro de 1976, e da Lei n. 6.385, de 7 de dezembro de 1976, e estende às sociedades de grande porte disposições relativas à elaboração e divulgação de demonstrações financeiras. Brasília, DF. Retrieved November 20, 2013, from http://www.planalto.gov.br/ccivil_03/_ato2007-2010/2007/ Lei/L11638.htm.
Brasil. Lei n. 11.941, de 27 de maio de 2009. Altera a legislação tributária federal relativa ao parce-lamento ordinário de débitos tributários; concede remissão nos casos em que especifica; institui regime tributário de transição. Brasília, DF. Retrieved November 25, 2013, from http://www.pla-nalto.gov.br/ccivil_03/_ato2007-2010/2009/lei/l11941.htm.
Cassiman, B., Golovko, E., & Martínez-Ros, E. (2010). Innovation, exports and productivity. Inter-national Journal of Industrial Organization, 28(4), 372-376.
Chen, Y. M., Yang, D. H., & Lin, F. J. (2013). Does technological diversification matter to firm perfor-mance? The moderating role of organizational slack. Journal of Business Research, 66(10), 1970-1975. Cheng, J. L., & Kesner, I. F. (1997). Organizational slack and response to environmental shifts: The impact of resource allocation patterns. Journal of Management, 23(1), 1-18.
155
Crisóstomo, V. (2009). Ativos intangíveis: estudo comparativo dos critérios de reconhecimento, mensuração e evidenciação adotados no Brasil e em outros países. Contabilidade, Gestão e Gover-nança, 12(1), 50-68.
Cyert, R. M., & March, J. (1963). A behavioral theory of the firm. Englewood Cliffs, NJ: Prentice Hall. Dallabona, L. F., & Beuren, I. M. (2012). Relação da folga organizacional com medidas de desempe-nho de empresas brasileiras. Anais do Congresso Brasileiro de Custos, João Pessoa, Brasil, 19. Dahlander, L., & Gann, D. M. (2010). How open is innovation? Research Policy, 39(6), 699-709. Damanpour, F. (1991). Organizational innovation: a meta-analysis of effects of determinants and moderators. Academy of Management Journal, 34(3), 555-590.
Darroch, J., & McNaughton, R. (2002). Examining the link between knowledge management prac-tices and types of innovation. Journal of Intellectual Capital, 3(3), 210-222.
Den Hertog, P., Bilderbeek, R., & Maltha, S. (1997). Intangibles: the soft side of Innovation. Futu-res, 29(1), 33-45.
Dimick, D. E., & Murray, V. V. (1978). Correlates of substantive policy decisions in organizations: The case of human resource management. Academy of Management Journal, 21(4), 611-623. Edvinsson, L., Dvir, R., Roth, N., & Pasher, E. (2004). Innovations: the new unit of analysis in the knowledge era: the quest and context for innovation efficiency and management of IC. Journal of Intellectual Capital, 5(1), 40-58.
Facó, J. F. B., & Csillag, J. M. (2010). Processo de inovação em bancos: análise do desenvolvimento de novos produtos. Revista de Administração da UNIMEP, 8(3), 1-26.
Fávero, L. P., Belfiore, P., Silva, F. L., & Chan, B. L. (2009). Análise de dados: modelagem multiva-riada para tomada de decisões. Rio de Janeiro: Campos, Elsevier.
Gary, M. S. (2005). Implementation strategy and performance outcomes in related diversification.
Strategic Management Journal, 26(7), 643-664.
Geiger, S. W., & Cashen, L. H. (2002). A multidimensional examination of slack and its impact on innovation. Journal of Managerial Issues, 14(1), 68-84.
Geiger, S. W., & Makri, M. (2006). Exploration and exploitation innovation processes: the role of organizational slack in R&D intensive firms. The Journal of High Technology Management Research, 17(1), 97-108.
George, G. (2005). Slack resources and the performance of privately held firms. Academy of Mana-gement Journal, 48(4), 661-676.
Greenley, G. E., & Oktemgil, M. (1998). A comparison of slack resources in high and low perfor-ming British companies. Journal of Management Studies, 35(3), 377-398.
Greve, H. R. (2007). Exploration and exploitation in product innovation. Industrial and Corporate Change, 16(5), 945-975.
Herold, D. M., Jayaraman, N., & Narayanaswamy, C. R. (2006). What is the relationship between organizational slack and innovation? Journal of Managerial Issues, 18(3), 372-392.
Huang, Y.-F., & Chen, C.-J. (2010). The impact of technological diversity and organizational slack on innovation. Technovation, 30(7-8), 420-428.
156
Índice Brasil de Inovação – IBI. (2007). Manual do IBI. Departamento de Política Científica e Tecnológica (DPCT/IG) da Universidade de Campinas (Unicamp). Retrieved November 20, 2013, from http://www.conhecimentoeinovacao.com.br/ibi/manual_ibi.pdf.
Instituto Brasileiro de Geografia e Estatística – IBGE (2015). Retrieved July 25, 2015, from http:// www.ibge.gov.br.
Keegan, A., & Turner, J. R. (2002). The management of innovation in project-based firms. Long Range Planning, 35(4), 367-388.
Kramer, J. P., Marinelli, E., Iammarino, S., & Diez, J. R. (2011). Intangible assets as drivers of innovation: empirical evidence on multinational enterprises in German and UK regional systems of innovation. Technovation, 31(9), 447-458.
Lev, B. (2001). Intangibles: management, measurement and reporting. Washington: Brookings Insti-tution Press.
March, J. G. (1979). Ambiguity and the engineering of choice. International Studies of Management and Organization, 9(3), 9-39.
Marino, K. E., & Lange, D. R. (1983). Measuring organizational slack: a note on the convergence and divergence of alternative operational definitions. Journal of Management, 9(1), 81-92.
Moses, O. D. (1992). Organizational slack and risk-taking behaviour: tests of product pricing stra-tegy. Journal of Organizational Change Management, 5(3), 38-54.
Mudambi, R. (2008). Location, control and innovation in knowledge-intensive industries. Journal of Economic Geography, 8(5), 699-725.
Narvekar, R. S., & Jain, K. (2006). A new framework to understand the technological innovation process. Journal of Intellectual Capital, 7(2), 174-186.
Nohria, N., & Gulati, R. (1996). Is slack good or bad for innovation? Academy of Management Jour-nal, 39(5), 1245-1264.
Organisation for Economic Co-operation and Development (OECD) (2005). Oslo Manual:proposed guidelines for collecting and interpreting technological innovation data. Paris, OCDE.
Perez, M. M., & Famá, R. (2006). Ativos intangíveis e o desempenho empresarial. Revista Conta-bilidade & Finanças, 17(40), 7-24.
Pesquisa de Inovação Tecnológica (PINTEC) (2005). Pesquisa de Inovação. IBGE. Retrieved Novem-ber 20, 2013, from http://www.ibge.gov.br/home/estatistica/economia/industria/pintec/2005/ pintec2005.pdf.
Poynter, T. A., & White, R. E. (1985). The strategies of foreign subsidiaries: responses to organiza-tional slack. International Studies of Management & Organization, 14(4), 91-106.
Quintas, T. T., & Beuren, I. M. (2011). Abordagens sobre folga organizacional nas pesquisas publicadas em periódicos internacionais: um ensaio teórico. Revista de Administração da UFSM, 4(1), 53-72.
157
Rust, K. G., & Katz, J. P. (2002). Organizational slack and performance: the interactive role of workforce changes. Anales of Strategic Management Track of the Midwest Academy of Management Conference.
Santos, J. G. C., Silva, L. S., Gallon, A. V., & De Luca, M. M. M. (2012). Intangibilidade e inovação em empresas no Brasil. Revista de Administração e Inovação, 9(2), 198-222.
Schumpeter, J. A. (1988). Capitalismo, sociedade e democracia. São Paulo: Abril Cultural.
Sender, G. (2004). O papel da folga organizacional nas empresas: um estudo em bancos brasileiros.
2004. 226f. Dissertação de mestrado, Universidade Federal do Rio de Janeiro, Rio de Janeiro. Sharfman, M. P., Wolf, G., Chase, R. B., & Tansik, D. A. (1988). Antecedents of organizational slack. Academy of Management Review, 13(4), 601-614.
Singh, J. V. (1986). Performance, slack, and risk taking in organizational decision making. Acade-my of Management Journal, 29(3), 562-585.
Tan, J., & Peng, M. (2003). Organizational slack and firm performance during economic transi-tions: Two studies from an emerging economy. Strategic Management Journal, 24(13), 1249-1264. Teece, D. J. (2006). Reflections on profiting from innovation. Research Policy, 35(8), 1131-1146. Teh, C. C., Kayo, E. K., & Kimura, H. (2008). Marcas, patentes e criação de valor. Revista de Admi-nistração Mackenzie, 9(1), 86-106.
Thomson, N., & Millar, C. J. (2001). The role of slack in transforming Organizations: A compa-rative analysis of East German and Slovenian companies. International Studies of Management &
Organization, 31(2), 65-83.
Tironi, L. F., & Cruz, B. O. (2008). Inovação incremental ou radical: há motivos pra diferenciar? Uma abordagem com dados da Pintec (Texto para discussão, n. 1360). Rio de Janeiro: IPEA.
Vinces, J. C., Cepeda-Carrión, G., & Chin, W. W. (2012). Effect of ITC on the international compe-titiveness of firms. Management Decision, 50(6), 1045-1061.
Wooldridge, J. M. (2002). Econometric analysis of cross section and panel data. Cambridge, MA: MIT Press.