Synthesis of Cubic Y Zeolite Using a Pulsed Microwave Heating
System
L.R.G. de Araújo
a, C.L. Cavalcante Jr.
a, K.M. Farias
b, I. Guedes
b*,
J.M. Sasaki
b, P.T.C. Freire
b, F.E.A. Melo
b, J. Mendes-Filho
baUniversidade Federal do Ceará, Departamento de Química Orgânica e Inorgânica,
C.P. 12200, Campus do Pici, 60455-760 Fortaleza - CE, Brazil
bUniversidade Federal do Ceará, Departamento de Física,
C.P. 6030, Campus do Pici, 60455-760 Fortaleza - CE, Brazil * e-mail: [email protected]
Received: February 27, 1998 Revised April 23, 1999
Cubic Y zeolite were successfully synthesized using microwave heating for 18 - 25 min, whereas 10 - 50 h are required by hydrothermal heating technique depending upon the lattice Si/Al ratio. To this end, we used a commercial microwave oven modified in order to provide pulsed microwave pumping on the synthesis mixtures. The obtained samples were analyzed by X-ray diffraction, BET surface area and infrared spectroscopy measurements. As a result, we verify that Y zeolite samples obtained from hydrogels containing low aluminum contents, present a good degree of crystallinity and then can be suitable for using in adsorption and catalysis experiments.
Keywords:synthetic zeolites, microwave heating, X-ray and infrared spectroscopy
1. Introduction
Nowadays, zeolites as well as other molecular sieves find several applications in a diversity of areas. In particu-lar, zeolites are hydrated, crystalline aluminosilicates con-structed from TO4 tetrahedra (T = Al, Si) where each apical oxygen atom is shared with an adjacent tetrahedron. Thus, the ratio of O/T is always equal to 2. Usually, zeolites are synthesized under hydrothermal conditions in a period from a many hours to a few days depending on the nature of zeolite, mixture composition and synthesis temperature. Frequently, low temperatures must be used to reduce the formation of undesired phases which requires longer syn-thesis times which increase the cost of industrial synsyn-thesis and is often unacceptable. Therefore, reducing the crystal-lization time is one of the most important targets for com-mercial synthesis. However, recent research shows that microwave techniques present the possibility to achieve such a target.
Microwave techniques have been extended to serve different areas in chemical research and practice including drying of chemicals, dehydration of solid materials, e.g., zeolites1, acid hydrolysis of proteins2, cleaning of metal
surfaces3, sintering of ceramics4 and promotion of both inorganic and organic reactions5.
In accordance with Ref. 6, microwave heating can be used in the unseeded preparation of zeolite A and the seeded preparation of ZSM-5. Jansen and coworkers7, have reported on the advantages of applying microwave heating to produce A and X zeolites, hydroxysodalite, and TMA-hydroxysodalite. Recently, Arafat et al.8 have used a mi-crowave heating to prepare important zeolite catalyst such as Y and ZSM-5. In the experiment reported in Ref. 8, the microwave power and the heating rate were adjusted by partial shielding of the vessel containing the hydrogel using a perforated stainless-steel cages, while the temperature and pressure of the vessel were controlled using a fibre optic system. These previous works employed microwave ovens specially designed for laboratory experiments.
vessel temperature was kept constant within 1 °C during all synthesis process (nucleation and growth). Even with these modifications, we are able of synthesizing crystalline Y zeolites using microwave radiation during 18 - 25 min. This paper is outlined as follows. In Sec. 2 we explain our experimental installation and the Y zeolite preparation scheme. In Sec. 3 we discuss the results obtained from the samples characterization using the X-ray and infrared tech-niques, and finally in Sec. 4 we present the concluding remarks.
2. Experimental
The microwave equipment used in this work was a commercial Panasonic microwave oven model NN 7856 BA/K with maximum output power of 900 W at 2.45 GHz. In order to control the nucleation and growth temperature accurately keeping the magnetron power constant, we pro-ceed as follows. First, we developed an electronic system to provide pulsed microwave pumping, This could be done by switching the magnetron externally using a square-wave voltage. Secondly, the correct period and width of the microwave pulses were previously determined in a large number of experiments. The vessel temperature was con-tinuosly monitored using a conventional alcohol ther-mometer. Finally, from the obtained results we create a databank and use it to control the electronic switching system by a personal computer. The accuracy in the syn-thesis temperature using this pulsed heating system is of order of 1 °C.
A polytetrafluoroethilene (PTFE) autoclave was de-signed and used as a reaction vessel for Y zeolite synthesis. The dimensions of this autoclave (internal diameter of 5 cm) have been chosen to stay within the penetration depth of 2.5 cm of microwave radiation in aqueous solution at 2.45 GHz.
Silica (Aerosol 200, Degusa), sodium aluminate (Riedel - De Haen AG), and sodium hydroxide (Merck) were used as silicon, aluminum and sodium sources in Y zeolite synthesis mixture, which is prepared using the fol-lowing formulation:
16 SiO2 : Al2O3 : 3 Na2O : 400 H2O
The silica solution was slowly added to hydroxide/alu-minate solution with stirring. After ripening for 24 h, the synthesis mixture was charged into the PTFE vessel. The synthesis was first heated using the highest power of the magnetron (900 W) to reach 120 °C in 30 s. Subsequently, the power was switched off and after some initial cooling, microwave emission time was adjusted from 10 to 20 s to keep the temperature constant during 2 - 6 min. After this nucleation stage, microwave emission time was varied from 10 to 25 min to maintain the temperature constant at 100 °C for 3 - 6 h. The products, thereafter, were crash-cooled, isolated by filtration, washed several times with
demineralized water, and finally dried in air for 2 - 3 h at 150 °C.
3. Results and Discussion
3.1. X-ray analysis
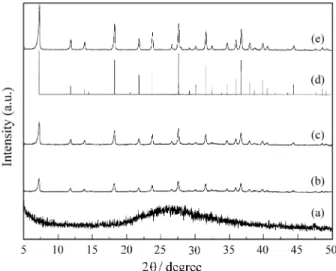
The X-ray diffraction pattern were recorded on a Ri-gaku X-ray diffractometer using CoKα radiation (tube current 20 mA and voltage 40 kV). Figures 1a - 1c show the diffraction patterns of samples #1, #2 and #3, respec-tively. These samples were prepared by pulsed microwave heating using the same nucleation time (τN = 50 s) but different growth times (τG). It can be seen that sample #1, where τG = 10 min, presents an amorphous character evi-dencing the fact the pumping emission time for both nu-cleation and growth stages was not long enough to produce a sample with reasonable degree of crystallinity. However, for τG = 18 min and τG = 25 min, we can see from Figs. 1b and 1c that samples #2 and #3 now present a typical diffraction pattern of Y zeolite framework. It should be mentioned that these measurements were carefully per-formed and no extra crystalline phase was observed. From the JCPDS data9 (see Fig. 1d) we observe that the samples obtained can be classified as faujasite - type cubic Y zeolite belonging Fd3m space group (lattice parameter a = 24.681 Å) with 32 Na2 Al2Si4O12•8H2O unit formula per unit cell. However, we can determine the cell parameter of the Y zeolites obtained from the diffraction patterns shown in Figs. 1b and 1c through the least-square method (LSM)10. The lattice parameters determined by LSM using 22 dif-fraction peaks for samples #2 and #3 are a = 24.674 ± 0.003 Å and a = 24.699 ± 0.004 Å, respectively. These values agree well with that found in the JCPDS list. These results
can be used to calculate the Si/Al ratio of the products according to following equation11:
Si Al=
192 x 0.00868
a − 24.191 −1 (1)
which yields for samples # 2 and # 3 the values 2.45 and 2.28, respectively. These values are in good accordance with those ones reported in Ref. 8 for a Si/Al ratio in the gel equal to 8.
We can determine the cristallinity of the samples by means of the integrated intensity of the diffraction peaks. In accordance with the American Society of Testing Mate-rials, the integrated intensity of at least five peaks should be compared with the integrated intensity of the same peaks of a standard sample. The X-ray crystallinity (XRC) can be calculated from
XRC = integrated intensity of hkl reflections
integr atedintensity of hkl for standard sample (2)
Here we have used as standard sample a commercial Y zeolite (Aldrich) synthesized employing the hydrothermal method , whose diffraction pattern is shown in Fig. 1e. An estimate of the peak intensity, integrated intensity and linewidth can be obtained by carriyng out a numerical fitting of the peak profile. The fitting was performed using the pseudo - Voight function12 which is given by the convolution of Gaussian and Lorentzian ones, namely
y = y0+A [ µ 2 πω (
1
1 + 4 (x − xc ω )2
)+
+(1−µ) 2
ω
√
ln2
π exp (− 4 ln 2 (
x− xc ω )2)] where A is the integrated intensity, y - y0 is the intensity of point displaced by ∆2θ from the Bragg angle, ω is the full width at half-maximum (FWHM), xc is the peak position and µ is a parameter that mixes both functions. After averaging over 18 peaks, we find that samples #2 and #3 present XRC equal to 52% and 61%, respectively. In these calculations we have discarded very low intensity peaks.
The relatively small XRC values presented by samples #2 and #3 are also reflectedby nitrogen adsorption meas-urements (BET technique), which yields the porosity of the samples . Here we have used the αs method in which the volume of the adsorbed N2 is plotted against the reduced standard adsorption (αs). Extrapolation to αs = 0 gives the
micropore volume (Vt). The values of Vt and the BET surface area (S-BET) for samples #2 and #3 as well as other characteristics parameters for samples #2 and #3, are shown in Table 1. By comparing these values with those reported in Ref. 8, we can see that the smaller is the porosity smaller is the XRC of the synthesized samples.
3.2. Infrared spectroscopy study
A systematic investigation of the framework structures of many synthetic zeolites has been carried out in the 200 - 1300 cm-1 region (the mid-infrared region) by Flanigen et al.13. Interpretations of these spectra were based on assign-ment of the infrared bands to certain structural groups in the various zeolite frameworks. In order to conduct this assignment, it is necessary to know the basic zeolite struc-ture. Hence, this method of investigation is complementary to X-ray structural analysis.
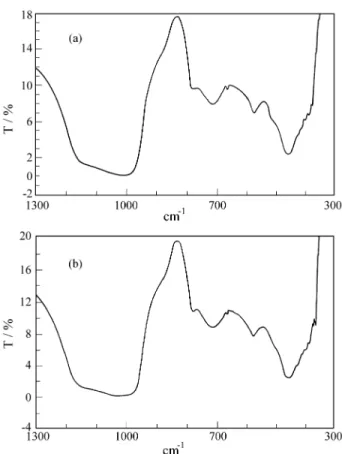
The zeolite structures can be classified according to common elements of framework topology and the secon-dary zeolite structure as found in the seconsecon-dary building units. By an extension of the infrared studies it may be possible to deduce structural information as a new zeolite for which X-ray structural analysis is not complete. The mid-infrared region of the spectrum is useful in this regard since it contains the fundamental vibrations of TO4 (T = Al, Si ) tetrahedra. The infrared spectra can be grouped into two classes, (1) those due to internal of the TO4 tetrahedron which is the primary unit of structure and which are not sensitive to other structural variations, and (2) vibrations which may be related to the linkages between tetrahedra. Class 2 vibrations are sensitive to the overall structure and the joinning of the individual tetrahedra in secondary struc-tural units, as well as their existence in the larger pore openings. Individual assignments to specific AlO4 tetrahe-dra are not possible. However, the vibrational frequency represents the average composition. Figures 2.a and 2.b show the infrared spectra of samples #2 and 3, respectively. These spectra were obtained from potassium bromide pel-lets on a Perkin-Elmer Spectra 1000 spectrometer. The first class of spectra consists of the strongest vibrations found in all zeolites which are assigned to the internal tetrahedron vibrations and are found at 950 - 1250 cm-1 and at 420 -500 cm-1. The strongest vibration close to 950 cm-1 is assigned to a T-O stretching mode. The next strongest band in the 420 - 500 cm-1 region is assigned to a T-O bending mode.
Table 1. Characteristics parameters for Y zeolites prepared under pulsed microwave radiation
Samples Characteristic parameters
τN (s) τC (min) a (Å) XRC (%) Si/Al Vt (mL/g) S-BET (m2/g)
#2 50 18 24.674 ± 0.003 52 2.45 0.21 192
Stretching modes involving mainly the tetrahedral at-oms are assigned in the region of 650 - 820 cm-1 . The stretching modes are sensitive to the Si-Al composition of the framework and may shift to a lower frequency with increasing number of tetrahedral Al atoms. The bending mode, that is, the 420 - 500 cm-1 band is not as sensitive.
The second group of frequencies which are sensitive to the linkages between tetrahedra and the topology and mode of arrangement of the secondary units of structure in the zeolite occur in the regions of 500 - 650 cm-1 and 300 -420 cm-1. The band in the 500 - 650 region is related to the presence of double rings in the framework structures and is observed for all zeolites presenting the same structure.
The next main frequency which is assigned to external linkages is in the 300 - 420 cm-1 portion of the infrared spectra and is related to the pore opening or motion of the tetrahedra rings which form the pore openings in the
zeo-lites, It appears to be more or less observable depending upon the type of zeolite structure. It is a distinct band in the spectra of zeolites A, X, Y and Ω, but is less apparent in the spectra of zeolite P, ZK-5 among others13. It seems to be more prominent in cubic structures and decreases in prominence with a decrease in symmetry. This is consid-ered to be a bending mode. The bands at 750 - 820 cm-1 region and the 1050 - 1150 cm-1 region. The T-O-T angle in zeolite frameworks ranges from 140° to 150°, No corre-lation was found in the infrared spectra with deviations from these values. The observed wavenumbers and relative intensities and the mode assignments for the two samples are listed in Table 2. It should be mentioned that all values listed in Table 2 are in good agreement with those reported previously by Flanigen et al. in Ref. 13. This is another strong evidence that the samples obtained are of course cubic Y zeolite presenting good crystallinity quality.
4. Concluding Remarks
In conclusion we have reported on the Y zeolite prepa-ration scheme using pulsed microwave irradiation. This method was developed to overcome the difficulty of con-trolling correctly the power emitted by the commercial microwave oven. The synthesis times used are similar to those ones presented in Ref. 8, which implies in a cost reduction of the crystallization process about 95% with respect to the conventional hydrothermal method. We ob-served using the techniques described in Sec. 3 that the samples synthesized are of course purely crystalline Y zeolite with cubic structure belonging to Fd3m space group presenting good crystallinity quality. Despite of the some-what good values of the characteristics parameters pre-sented for the synthesized zeolites, the pulsed microwave radiation heating synthesis method described in this work need to be improved, in order to provide Y or other zeolite samples presenting very good cristallinity degree and then suitable to be used in several kinds of adsorption and catalysis experiments.
Acknowledgments
The authors wish to thank the Fundação Cearense de Amparo à Pesquisa (FUNCAP) and Conselho Nacional de Desenvolvimento Científico e Tecnológico (CNPq) for financial support.
Figure 2. Absorption infrared spectra of cubic Y zeolite prepared under pulsed microwave radiation. (a) sample #2 and (b) sample #3.
Table 2. Infrared spectral data for synthetic Y zeolite. The frequencies are given in cm-1.
Asymmetric stretching Symmetric stretching Double rings
T-O bending
Pore opening Sample Internal Tetrahedra External Linkages Internal Tetrahedra External Linkages
#2 1027 msh 1148 vw 720 msh 789 ms 578 m 455 ms 379 m
#3 1027 vw 1152 vw 716 vwsh 780 vwsh 578 vwsh 458 m 375 m
References
1. Roussy, G.; Chenot, P. J. Phys. Chem., v. 85, p. 2199, 1981.
2. Margolis, S.M.; Jasse, L.; Kingston, H.M. J. Aut. Chem., v. 13, p. 93, 1991.
3. Sanders, A.; Wetzel, H.; Krust, M. In Microwave Processing of MaterialsII , Snyder Jr., W.; Sutton, W.; Iskander, M.; Johnson, D.L., eds., MRS Pittsburgh PA, 1990.
4. Varadan, V.K.; Yushieh, M.; Lakhtakia, A.; Varadan, V.V. In Microwave Processing of Materials, Sutton, W.H.; Brooks, M.H.; Chabainsky, I.J. MRS Pitts-burgh PA, 1988.
5. Mingos, D.M.; Baghurst, D.R. Chem. Soc. Rev., v. 20, p. 1, 1991.
6. Chu, P.; Dwyer, F.W.; Clarke, V.J. Eur. Pat. 358827, 1990.
7. Jansen, J.C.; Arafat, A.; Barakat, A.K.; van Bekkum, H. In Synthesis of Microporous Materials, Ocelli, M.L.; Robinson, H.E., eds., Van Nostrand Reinhold, New York NY, 1992.
8. Arafat, A.; Jansen, J.C.; Ebaid, A.R.; van Bekkum, H.
Zeolites, v. 13, p. 162, 1993.
9. JCPDS-International Centre for Diffraction Data, Card number: 39-1380, 1995.
10. Cullity, B.D. Elements of X-ray diffraction, Addison-Wesley Publishing Co. Inc., Massachusetts, 1967. 11. Breck, D.W. Zeolite Molecular Sieves, John Wiley &
Sons, New York, 1974.
12. Young, R.A.; Willes, D.B. J. Appl. Cryst., v. 15, p. 430, 1982.