ISSN 0104-6632 Printed in Brazil
of Chemical
Engineering
Vol. 21, No. 03, pp. 423 - 434, July - September 2004
ENHANCEMENT OF THE PERFORMANCE OF AN
ANAEROBIC SEQUENCING BATCH REACTOR
TREATING LOW-STRENGTH WASTEWATER
THROUGH IMPLEMENTATION OF A VARIABLE
STIRRING RATE PROGRAM
J. A. D. Rodrigues
1*, A. G. Pinto
1, S. M. Ratusznei
1, M. Zaiat
2and R. Gedraite
11
Departamento de Engenharia Química e de Alimentos, Escola de Engenharia Mauá, Instituto Mauá de Tecnologia (IMT), Praça Mauá 1, CEP 09.580-900,
Fax: +(55) (11) 4239-3131São Caetano do Sul -,SP, Brazil E-mail: [email protected]
2
Departamento de Hidráulica e Saneamento, Escola de Engenharia de São Carlos, Universidade de São Paulo (USP), Av. Trabalhador São-Carlense 400,
CEP 13.566-590, São Carlos - SP; Brazil.
(Received: October 1, 2002 ; Accepted: March 9, 2004 )
Abstract - This work focuses on enhancement of the performance of an anaerobic sequencing batch reactor with a six-vertical-blade-disk-turbine impeller, containing granulated biomass treating low-strength synthetic wastewater, through a study of the feasibility of implementing a variable stirring rate program. The reactor was operated at 30oC and a six-hour cycle was used to treat approximately 2.0 L of the synthetic substrate with a chemical oxygen demand (COD) of nearly 500 mg/L. Two different stirring rate program were implemented: a constant rate of 50 rpm and a variable rate consisting of 75 rpm for one hour, 50 rpm for four hours and 25 rpm for 0.5 hour. The last 0.5 hour of the cycle was used for the settling step. In both cases, a very short start-up period and unfiltered and filtered substrate removal efficiencies of 81% and 88%, respectively, were attained. However, use of the variable stirring rate enhanced efficiency of the reactor dynamics without impairing biomass morphology, thus resulting in a reduction in the total cycle time and a possible decrease in energy consumption. Additionally, a simplified model of the anaerobic metabolic activity, using apparent kinetic parameters, was proposed as a consecutive first-order kinetic model with substrate and total volatile acid residual concentrations in order to analyze how the variable stirring rate affects reactor performance.
Keywords: stirring rate program, performance enhancement, anaerobic sequencing batch reactor, granulated biomass, synthetic domestic wastewater.
INTRODUCTION
Anaerobic sequencing batch reactors allow typical biological anaerobic metabolism from substrate consumption to methane and carbon dioxide production and operate according to the following cyclic steps: feed, reaction, settling and discharge (Dague et al., 1992). The main advantages
when sewage is produced intermittently and has variable characteristics as a result of the type of downstream process.
The technological potentials of this reactor have already been assessed for some types of effluents such as nonfat dry milk synthetic wastewater (Sung and Dague, 1995), sucrose (Wirtz and Dague, 1997), dairy wastewater (Dugba and Zhang, 1999) and low-strength synthetic wastewater (Ndon and Dague, 1997). However, Zaiat et al. (2001) demonstrated that many engineering process features still have to be studied in order to achieved better insight into the operational aspects of this reactor, thereby enabling application in real situations with an optimized procedure.
Specifically, when applied to the treatment of low-strength wastewater, operation of this reactor requires some type of agitation in order to improve transfer of the substrate in the aqueous phase to the microorganisms in the granulated biomass and responsible for anaerobic degradation (Hulshoff-Pol et al., 1998). Agitation may be achivied by recirculating the liquid or gas phases (Brito et al., 1997) or by mechanical stirring (Ratusznei et al., 2000). This fact is directly due to the lack of homogeneity in the reaction medium brought about by low biogas production, which is a result of the low substrate concentration since the start-up of operation. However, in dealing with a biological system, where the biomass responsible for the whole process has a granular morphology that in turn is directly related to the efficiency of the settling step, which is very important for overall process efficiency, implementation of mechanical stirring should be carefully considered. At the same time that mass transfer from the substrate in the fluid phase to the granulated biomass is improved, the shearing forces brought about by mechanical stirring may impair the settleability characteristics of the sludge and create biomass drag.
Study of the influence of stirring rate on the efficiency and stability of the anaerobic sequencing batch process carried out by Rodrigues et al. (2003) indicated the existence of an optimum stirring rate (50 rpm), below which efficiency drops due to insufficient mixing and above which this reduction occurs due to the disperse growth of biomass brought about by excessive mixing. However, this work was conducted with constant stirring during the entire experiment, which is not necessarily an optimal condition, since continuous stirring is not always required to improve mass transfer in sludge.
The main scope of this work is to enhance the performance of an anaerobic sequencing batch reactor treating low-strength wastewater through implementation of a variable stirring rate program.
Furthermore, a simplified model of the biological process using apparent kinetic parameters, i.e., considering both kinetic and mass transfer effects, was proposed and validated with experimental results, assuming only two stages with first-order kinetic reactions in series, as a way to elucidate the improvement seen with the operational strategy adopted.
MATERIALS AND METHODS
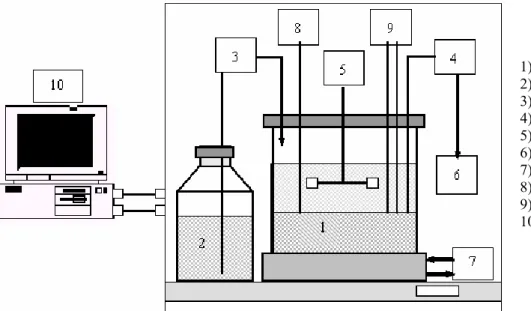
The experimental apparatus (Figure 1) used in this study consisted of a bioreactor (New Brunswick Scientific Co. model BIOFLO III) with a working capacity of 5 L, containing granulated biomass. There was a six-vertical-blade-disk-turbine impeller in the center part of the reactor for mixing and reduction of the shear forces on the granules. The sequencing batch operation was carried out through an automation system, developed using LABVIEW£ software with RS-232 and data acquisition interfaces, comprising four synchronized steps (feed, reaction, settling and withdrawal). This system provided for switching the feed and discharge pumps on and off as well as for the motor turning off during the settling and withdrawal steps. Temperature was controlled by water circulation through a jacket in the reactor. The pH and the dissolved oxygen concentration were monitored in order to verify stability and the presence of oxygen due to stirring, respectively.
The reactor was operated in a six-hour cycle sequential batch at 30 r 2 oC with a settling time of 30 minutes. The total volume of medium in the reactor during the batch was 5L, i.e., the volume of wastewater to be treated and of biomass. A volume of 2.0 L of treated medium was discharged during 13 min at the end of the cycle. The same volume of fresh synthetic wastewater was fed into the reactor during 7 min at the start-up of the next cycle.
Two liters (2,053 g) of sludge, taken from a pilot-plant UASB reactor treating domestic sewage, with 53.9 mg-tvs/g-sludge were added to the reactor, thus resulting in a total volatile solids (tvs) content of 110.7 g and a biomass concentration (CX) of 22.1 g-tvs/L.
The synthetic wastewater with a chemical oxygen demand (COD) of approximately 500 mg/L was prepared with sucrose (35 mg/L), starch (114 mg/L), cellulose (34 mg/L), meat extract (208 mg/L), soy oil (51 mg/L), NaCl (250 mg/L), MgCl2.6H2O (7 mg/L),
CaCl2.2H2O (4.5 mg/L), NaHCO3 (200 mg/L) and
1) Bioreactor 2) Influent 3) Feed pump 4) Withdrawal pump 5) Agitation system 6) Effluent
7) Temperature control 8) Temperature sensor
9) pH and dissolved oxygen electrodes 10) Automation system with RS-232 and
data acquisition interfaces
Figure 1: Diagram of the stirred anaerobic sequencing batch reactor
The system was first operated with a constant stirring rate of 50 rpm for 310 min during 17 days (68 consecutive cycles) and then with a variable stirring rate of 75 rpm for 60 min, 50 rpm for 220 min and 25 rpm for 30 min during 14 days (56 consecutive cycles). The total time per cycle required for the feed, discharge and settling steps was 50 min and the total cycle time was 360 min. These stirring strategies were taking from the results of Rodrigues et al. (2003) with the intention of optimizing the process.
The concentrations of substrate (measured as chemical oxygen demand – COD) in unfiltered and filtered samples, total volatile acids (TVAC), bicarbonate alkalinity (BA), total solids (TS), total volatile solids (TVS), total suspended solids (TSS), volatile suspended solids (VSS) and pH were monitored in both the influent and effluent in different cycles for all the conditions according to the Standard Methods for the Examination of Water and Wastewater (1995). The concentrations of methane and carbon dioxide in the biogas were evaluated through gas chromatography (HP model 6890) using a thermal conductivity detector, a Porapack Q column, a temperature of 35 oC, H2 as
the carrier gas and a sample volume of 1 mL. The overall substrate removal efficiencies, based on unfiltered (H7) and filtered samples HS) and the
substrate removal efficiency in the reactor (Hi) were
calculated by Equations (1), (2) and (3), respectively, where CI was the influent unfiltered substrate
concentration, CET was the effluent unfiltered
substrate concentration, CES was the effluent filtered
substrate concentration, CS was the filtered substrate
concentration in the reactor and CSo was the initial
value of CS.
I ET I T
C
C
C
H
(1)I ES I S
C
C
C
H
(2)So S So i
C
C
C
H
(3)The filtered substrate and total volatile acid concentrations in the reactor profiles were obtained in the same cycle. Stirring was stopped 10 seconds before sample removal to allow sedimentation of the largest granules and turned on again immediately thereafter. These profiles were obtained in duplicate for each condition studied.
The anaerobic process model used in this work was based on the approach of Bagley and Brodkorb (1999) applied to an anaerobic sequencing batch reactor, i.e., an adaptation of the systematic approach developed for activated-sludge treatment processes by the International Water Association (IWA).
The methanogenic anaerobic process treating carbohydrate-based wastewater includes the following microbiological activities: hydrolysis, acidogenesis, acetogenesis, methanogenesis and cell lysis. The first and the last of these activities are considered nongrowth processes, whereas the others are considered growth processes. These processes may be divided into subprocesses based on the system and components of interest, such as solubilization of nonliving particulate material to readily fermentable, slowly degradable and inert compounds; conversion of slowly degradable soluble compounds to readily fermented compounds; and conversion of soluble carbohydrate polymer to readily fermentable sugar monomers.
In the acidogenesis process a vast group of microorganisms is used to biotransform sugars into acids with or without concurrent release of hydrogen and producing lactic, butyric, propionic and acetic acids. This also includes fermentation of lactic acid by lactic-acid acidogenic microorganisms, producing propionic and acetic acids and hydrogen. In acetogenesis processes a vast group of acetogenic hydrogen-producing microorganisms convert short-chain fatty acids (butyric and propionic acids) into acetic acid. In the methanogenesis process aceticlastic and hydrogenotrophic methanogen microorganisms are responsible for the conversion of acetic acid into carbon dioxide and methane and the reduction of carbon dioxide with hydrogen to form methane. Cell lysis is the process by which living cells are converted into nonliving particulate and soluble material, providing as many processes as there are microorganism groups of interest.
The kinetic analysis in this work simplifies the anaerobic processes in two consecutive steps: (i)
conversion of soluble substrate, measured as COD concentration (CS), to total volatile acids, measured
as acetic acid concentration (CTVA), i.e., hydrolytic,
acidogenesis and acetogenesis processes, and (ii)
conversion of this compound into methane,
measured as the amount of methane produced per reaction volume (CM), i.e., aceticlastic
methanogenesis process. Both steps were assumed to be first-order. Furthermore, final residual concentration values for soluble substrate (CSr) and
total volatile acids (CTVAr) were considered in this
model, where the values of the reaction rates (Rs, RTVA and RM) were equal to zero. The residual
concentration represents a correction in the formula, since the reactions in series are considered irreversible in the proposed model.
The proposed model is presented in Equations (4) to (11), where a, b and c are stoichiometric coefficients; k1 and k2 are apparent first-order kinetic
parameters; RS, RTVA, R’TVA and RM are the soluble
substrate consumption, total volatile acids formation and consumption, and methane production reaction rates, respectively; PS, PTVA, P’TVA and PM are the
specific soluble substrate consumption, total volatile acids formation and consumption, and methane production reaction rates, respectively; CX is the
biomass concentration; X1, I1, X2 and I2 are,
respectively, the biomass and the other intermediate compounds formed during the anaerobic transformation, but not considered in the kinetic model; and the subscript 0 denotes the values at time zero. Furthermore, the kinetic model did not consider the possibility of substrate consumption due to cell growth and maintenance.
The same kinetic parameters (k1 or k2) estimated
through S, TVA and M profiles will have different values, since concentrations are in weight units (Smith, 1981). Moreover, anaerobic biomass growth and maintenance as well as formation of other intermediate compounds result in substrate consumption in the two steps permitted in this model, but did not result in TVA and M formation.
Anaerobic reaction
1 2
k k
1 1 2 2
a Sob TVAX oI cMX I (4)
Kinetic models:
S Sr S 1 X SS C k C C
R P (5)
S SrTVA 1 X TVA
TVA C k C C
R P (6)
TVA TVArTVA 2 X TVA
TVA ' C k C C
'
R P (7)
TVA TVArM 2 X M
M C k C C
All the estimated kinetic parameters are apparent, since their values include kinetic and mass transfer rates. Moreover, the kinetic model is a simplification of the overall complex anaerobic metabolism. Material balance equations:
S
1 S S Sr S So
dC
k C C , t 0 C C dt
(9)
RESULTS AND DISCUSSION
TVA
1 TVA S Sr 2 TVA TVA TVAr
TVA TVAo
dC
k C C dt
k C C , t 0 C C
(10)
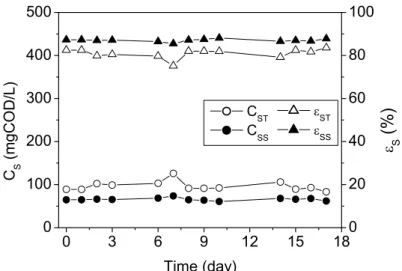
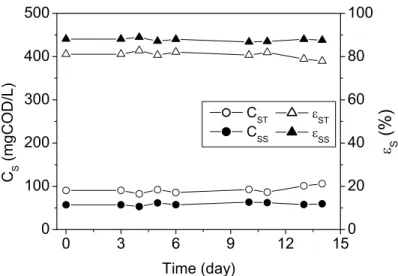
The mean values of the operating variables monitored during the assays and the corresponding standard deviations are presented in Tables 1 and 2. Figures 2 and 3 show the profiles of the unfiltered and filtered substrate concentration and the respective removal efficiency. The final removal efficiencies for the filtered and unfiltered substrate samples were 88% and 81%, respectively, for both assays with constant and variable stirring rates (see Table 1). Both operating conditions provided satisfactory total and volatile suspended solids retention (see Table 2).
M
2 M TVA TVAr M
dC
k C C , dt
t 0 C 0
(11)
Integrating Equations (9) to (11) resulted in Equations (12) to (14). The parameters were estimated by a nonlinear fit using the Levenberg-Marquardt method, where the subscripts S, TVA and M indicate the equation used to estimate the parameters. So, k1S, k1TVA and k1M are the values of
parameter k1 estimated by Equations (12), (13) and
(14), respectively. The same is valid for parameter k2
(see units of these parameters in the nomenclature).
Stability of influent and effluent bicarbonate alkalinity and total volatile acid concentration values (see Table 2) was attained in the first three days for both conditions, indicating a short start-up period, since the low values for total volatile acid and the generation of bicarbonate alkalinity are indicative of equilibrium between acidogenesis and methanogenesis. Moreover, the effluent pH (see Table 2) and methane contents in the biogas (see Table 1) were always close to 7.0 and 55%, respectively.
CSCSr CSo CSrexpk1S t (12)TVA TVAr TVAo TVAr
2 TVA So Sr 1 TVA
1 TVA 2 TVA
2 TVA 1 TVA 1 TVA 2 TVA
C C C C exp k t C C k
exp k t exp k t k k k k
ª « » « ¬ º »¼ (13)
The organic loading was 787 r 25 mgCOD/L.d, the specific organic loading was 36 r 1 mg COD/g-tvs.d and the specific organic removal was 7.4 r 0.3 mgCOD/g-tvs, estimated using influent and effluent concentrations, affluent volume, total cycle time, bioreactor volume and volatile solids content in the bioreactor.
M TVAo TVAr 2 M
2 M 1 M
1 M 2 M
So Sr
1M 2 M
2 M 1 M
C C C 1 exp k t
k exp k t 1
k k C C
k exp k t k k
ª º
¬ ¼
ª « « « « « « «¬ º » » » » » » »¼ (14)
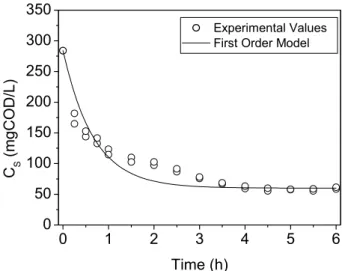
The concentration profiles for the cycle of filtered (or soluble) substrate, total volatile acids and methane concentrations in the reactor, experimentally obtained and estimated by the proposed consecutive first-order model (Equations 12 to 14), are shown in Figures 4 to 6 for the constant stirring rate of 50 rpm and in Figures 7 to 9 for the variable stirring rate of 75-50-25 rpm. The values obtained for parameters k1 and k2 with the
Table 1: Mean values of substrate concentration, efficiency, effluent volume and biogas concentration, measured in the reactor at different stirring rates.
CE(b) (mg COD/L) H (%)
N (rpm) CI
(a)
(mg COD/L) C
ET CES HT HS
V(c) (L)
50 508r 40 97r 11 66r 3 81r 2 87r 1 1.98r 0.03 75-50-25 479r 22 92r 8 59r 3 81r 2 88r 1 2.01r 0.01
Biogas average composition(d): CH
4 = 55 r 4%, CO2 = 45 r 3%
Biogas average concentration (d): CH
4 = 4.5 r 0.2 mMol/L, CO2 = 2.2r 0.2 mMol/L
Number of samples for each condition: (a) 10, (b) 12, (c) 11, (d) 6
Table 2: Mean values of bicarbonate alkalinity, total volatile acids, suspended solids concentration and pH, measured in the reactor at different stirring rates.
BA(a)
(mgCaCO3/L)
TVA(b)
(mgHAc/L)
TSS(c)
(mg/L)
VSS(d)
(mg/L) N
(rpm)
Inffluent Effluent Influent Effluent Influent Effluent Influent Effluent
50 126r 2 220r 5 36r 3 21r 1 34r 22 40r 29 19r 7 23r 18 75-50-25 128r 7 225r 5 37r 7 24r 4 33r 7 38r 14 35r 10 33r 11
Average of pH values (e): Influent = 8.8r 0.2, Effluent = 6.9 r 0.1
Number of samples for each condition: (a) 6, (b) 6, (c) 5, (d) 5, (e) 6
Note: In an anaerobic reactor there is a relation between pH and alkalinity in equilibrium with CO2partial pressure; even a low level of
CO2 has a significant impact on the pH. The influent containing NaHCO3 and substrate was sterilized at 121oC for 15 minutes, causing
CO2 escape from the liquid medium, which resulted in a high pH value (8.8). The CO2 partial pressure in the influent was probably
around 10-4 atm from equilibrium calculations. In the effluent, the pH was lower (6.9) since the CO
2 partial pressure was ‘normal’, about
0.05 atm. Thus pH decreased while alkalinity increased. This phenomenon is also observed in facultative ponds (Speece, 1996).
0 3 6 9 12 15 18
0 100 200 300 400 500
0 20 40 60 80 100
C S
(mgCOD/L)
Time (day) CST CSS
H ST H
SS
H S
(%
)
0 3 6 9 12 15 0
100 200 300 400 500
0 20 40 60 80 100
C S
(mgCOD/L)
Time (day) CST CSS
HST H
SS
H S
(%
)
Figure 3: Unfiltered and filtered substrate concentration and the respective removal efficiency obtained for the assay conducted with a variable stirring rate of 75-50-25 rpm.
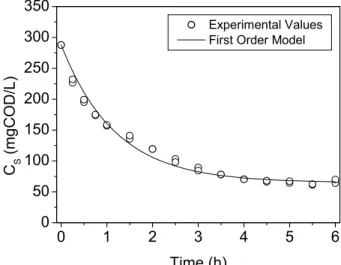
Analysis of Figures 4 to 9 and the respective correlation coefficients (see Table 3) indicate a good fit for the consecutive first-order model proposed in this work, despite its simplification in the anaerobic metabolic steps. Furthermore, the residual values for substrate and total volatile acid were acceptable, since the respective reaction rates were zero when the other variables were approximately constant and different from zero.
The different values obtained for parameters k1
and k2 from the fits of Equations (12) to (14) were
due to the stoichiometric coefficients (a, b and c) of the compounds involved in the consecutive reactions of the model as discussed earlier, since a mass basis rather than a molar basis was used. This can be confirmed by the fact that the ratios k1TVA/k1S and k2M/k2TVA were approximately the
same for both conditions (k1TVA/k1S = 0.3 and
k2M/k2TVA = 0.2), indicating that the stoichiometric
coefficients (a, b and c) were approximately constant. It is worth pointing out that only parameter k1M was very small compared to the
others. This parameter probably has no physical significance, since the experimental methane concentration values during the transient period were good enough to estimate this parameter.
The values of parameter k2 were higher than those
of parameter k1 for both operating conditions,
indicating that the process had been limited by the first step considered in this model,
hydrolysis-acidogenesis-acetogenesis, and not by the second step, aceticlastic methanogenesis. This might be due to the kind of substrate, composed of relatively difficult-to-degrade carbohydrates, mainly starch and cellulose. In addition to this, hydrolysis of protein and lipid may represent a limiting reaction step.
Implementation of a variable stirring rate program provided improved reactor performance since the kinetic parameters k1 and k2 were larger for
this condition than those obtained when a constant stirring rate was applied. This behavior might be attributed to enhanced mass transfer between the substrate in the bulk and the self-immobilized anaerobic biomass, indicating the positive effects of variable stirring on reactor performance, from substrate removal to methane formation and that the improvement in mass transfer resulted in better overall biological activity.
0 1 2 3 4 5 6 0
50 100 150 200 250 300 350
C S
(mgCOD/L)
Time (h)
Experimental Values First Order Model
Figure 4: Filtered substrate concentration for the assay conducted with a constant stirring rate of 50 rpm, obtained experimentally and by the first-order model.
0 1 2 3 4 5 6
0 9 18 27 36 45
C TV
A
(mgHA
c/L)
Time (h)
Experimental Values First Order Model
Figure 5: Total volatile acids concentration for the assay conducted with a constant stirring rate of 50 rpm, obtained experimentally and by the first-order model.
0 1 2 3 4 5 6
0 3 6 9 12 15
C M
(mg/L)
Time (h) Experimental Values First Order Model
0 1 2 3 4 5 6 0
50 100 150 200 250 300 350
C S
(m
gC
OD
/L)
Time (h)
Experimental Values First Order Model
Figure 7: Filtered substrate concentration for the assay conducted with a variable stirring rate of 75-50-25 rpm, obtained experimentally and by the first-order model.
0 1 2 3 4 5 6
0 9 18 27 36 45
CTV
A
(mg
HA
c/L)
Time (h)
Experimental Values First Order Model
Figure 8: Total volatile acids concentration for the assay conducted with a variable stirring rate of 75-50-25 rpm, obtained experimentally and by the first-order model.
0 1 2 3 4 5 6
0 3 6 9 12 15
CM
(mg
/L)
Time (h) Experimental Values First Order Model
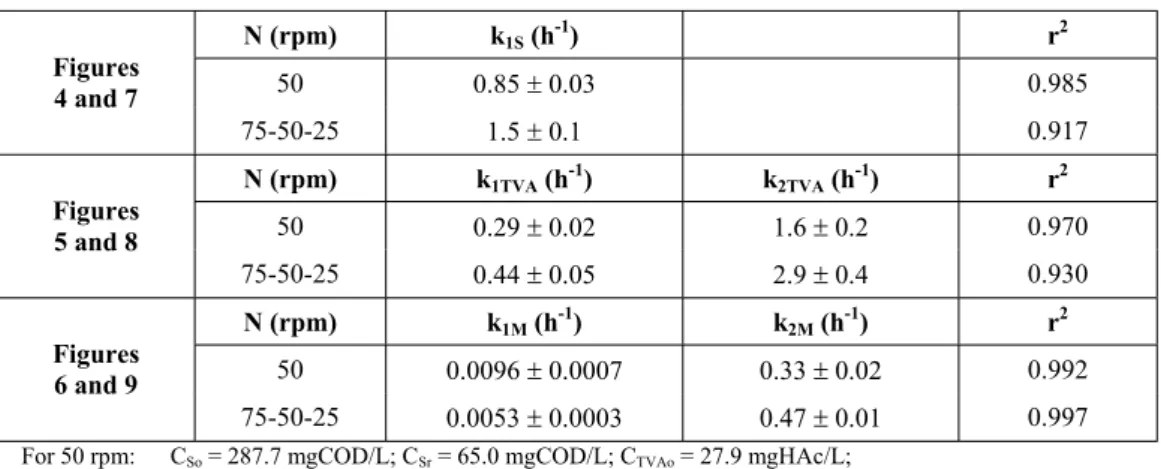
Table 3: Values of kinetic parameters from the consecutive first-order reaction model (Equations 12, 13 and 14) and the respective correlation
coefficient r2 for the balances on S, TVA and M.
N (rpm) k1S (h-1) r2
50 0.85r 0.03 0.985
Figures 4 and 7
75-50-25 1.5r 0.1 0.917
N (rpm) k1TVA (h-1) k2TVA (h-1) r2
50 0.29r 0.02 1.6r 0.2 0.970
Figures 5 and 8
75-50-25 0.44r 0.05 2.9r 0.4 0.930
N (rpm) k1M (h-1) k2M (h-1) r2
50 0.0096r 0.0007 0.33r 0.02 0.992
Figures 6 and 9
75-50-25 0.0053r 0.0003 0.47r 0.01 0.997
For 50 rpm: CSo = 287.7 mgCOD/L; CSr = 65.0 mgCOD/L; CTVAo= 27.9 mgHAc/L;
CTVAr = 20 mgHAc/L;
For 75-50-25 rpm: CSo = 284.0 mgCOD/L; CSr = 60.0 mgCOD/L; CTVAo = 26.4 mgHAc/L; CTVAr = 17 mgHAc/L.
CONCLUSIONS
Implementing a variable stirring rate program seems to be advantageous to operation of anaerobic sequencing batch reactors containing granular biomass as it shows a positive performance and economical benefits. The reactor had a short start-up period, good organic matter removal and both a solids retention for both operations with a constant and stirring agitation program. However, a better performance was observed when the latter program was applied.
This study also presented an approach to verify the influence of stirring rate on reactor performance, taking into account a simplified model for anaerobic biological metabolism as a consecutive first-order model that consists of only two steps: (1) the conversion of soluble substrate into total volatile acids, i.e., hydrolysis, acidogenesis and acetogenesis and (2) the conversion of this compound into methane, i.e., aceticlastic methanogenesis, with final residual concentration values for soluble substrate and total volatile acids.
Implementation of a variable stirring rate program seems to be advantageous mainly to the dynamic performance of the system, in that the higher values of the reaction rates assumed in the proposed model result in better overall biological activity, due to enhanced mass transfer from the substrate in the bulk phase to the granulated biomass. Moreover, this program also permitted maintenance and development of biomass with good settleability
characteristics. Therefore, the use of a variable stirring rate program in sequencing batch reactors with granulated biomass may improve the efficiency of the process, mainly with the scale-up of the system, permitting good unfiltered and filtered substrate concentration removal in a shorter cycle time.
ACKNOWLEDGMENTS
This study was supported by the Fundação de Amparo à Pesquisa do Estado de São Paulo – FAPESP (São Paulo, Brazil), process numbers 97/05.987-3 and 97/13.270-1 (J.A.D. Rodrigues), 98/10.303-9 (S.M. Ratusznei) and 99/05.967-8 (A.G. Pinto). We are also grateful to Dr. Walter Borzani for the helpful discussions and his many valuable suggestions and to Dr. Baltus C. Bonse for his revision of this paper.
NOMENCLATURE
Symbols
a stoichiometric coefficient
BA bicarbonate alkalinity concentration, mgCaCO3/L
CES filtered substrate concentration in the
effluent, mgCOD/L
TVAC total volatile acids concentration, mgHAc/L
CET unfiltered substrate concentration in the
effluent, mgCOD/L
V volume of effluent discharged, L VS volatile solids concentration, mg/L or
mg/g-sludge CI unfiltered substrate concentration in the
influent, mgCOD/L VSS volatile suspended solids concentration, mg/L
CM amount of methane per reaction volume,
mg/L H
T substrate removal efficiency for total
substrate concentration, % CS filtered substrate concentration in the
reactor, mgCOD/L H
S substrate removal efficiency for filtered
substrate concentration, % CSo initial value of CS, mgCOD/L
CSr residual filtered substrate concentration in
the reactor, mgCOD/L Hi substrate removal efficiency in the reactor for filtered substrate concentration, % CTVA total volatile acids concentration in the
reactor, mgHAc/L PM specific methane formation reaction rate,mg/L.h CTVAr residual total volatile acids concentration in
the reactor, mgHAc/L Ps specific substrate removal reaction rate, mgCOD/L.h CTVAo initial total volatile acids concentration in
the reactor, mgHAc/L PTVA specific total volatile acids reaction rate, mgCOD/L.h Cx biomass concentration, g-tvs/L
k1M apparent first-order kinetic parameter for
the conversion of soluble substrate to total volatile acids used in Equation (14), g-TVA/g-S.h
Abbreviations
COD chemical oxygen demand M methane
k1S apparent first-order kinetic parameter for
the conversion of soluble substrate to total volatile acids used in Equation (12), g-S/g-S.h
S substrate
TVA total volatile acids tvs total volatile solids k1TVA apparent first-order kinetic parameter for
the conversion of soluble substrate to total volatile acids used in Equation (13), g-TVA/g-S.h
REFERENCES
Bagley, D.M. and Brodkorb, T.S., Modeling Microbial Kinetics in an Anaerobic Sequencing Batch Reactor – Model Development and Experimental Validation, Water Environment Research, 71, 1320 (1999).
k2M apparent first-order kinetic parameter for
the conversion of total volatile acids to methane used in Equation (14), g-M/g-TVA.h
k2TVA apparent first-order kinetic parameter for
the conversion of total volatile acids to methane used in Equation (13), g-TVA/g-TVA.h
Brito, A.G., Rodrigues, A.C. and Melo, F.L., Feasibility of a Pulsed Sequencing Batch Reactor with Anaerobic Aggregated Biomass for the Treatment of Low Strength Wastewater, Water Science and Technology, 35, 193 (1997).
N agitation rate, rpm
Dague, R.R., Habben, C.E. and Pidaparti, S.R., Initial Studies on the Anaerobic Sequencing Batch Reactor, Water Science Technology, 26, 2429 (1992).
RM methane formation reaction rate, mg/L.h
Rs substrate removal reaction rate, mgCOD/L.h
RTVA total volatile acids reaction rate,
mgHAc/L.h Dugba, P.N. and Zhang, R., Treatment of Dairy Wastewater with Two-Stage Anaerobic Sequencing Batch Reactor System – Thermophilic Versus Mesophilic Operations. Bioresource Technology, 68, 225 (1999).
t time, h or day
TS total solids concentration, mg/L
Smith, J.M., Chemical Engineering Kinetics, McGraw-Hill, New York (1981).
Hulshoff-Pol, L., Rebac, S., Kato, M.T., Van Lier, J. and Lettinga, G., Anaerobic Treatment of Low-Strength Wastewater, Proceedings of the 5th Latin-American Workshop-Seminar Wastewater Anaerobic Treatment, Viña del Mar, Chile (1998).
Speece, R.E., Anaerobic Biotechnology for Industrial Wastewaters, Archae Press, New York (1996).
Standard Methods for the Examination of Water and Wastewater, 19th Edition, American Public Health Association / American Water Works Association / Water Environment Federation, Washington DC, USA (1995).
Ndon, U.J. and Dague, R.R., Effects of Temperature and Hydraulic Retention Time on Anaerobic Sequencing Batch Reactor Treatment of Low-Strength Wastewater, Water Research, 31, 2455
(1997). Sung, S. and Dague, R.R., Laboratory Studies on the Anaerobic Sequencing Batch Reactor, Water Environment Research, 67, 294 (1995).
Ratusznei, S.M., Rodrigues, J.A.D., Camargo, E.F.M., Zaiat, M. and Borzani, W., Feasibility of a Stirred Anaerobic Sequencing Batch Reactor Containing Immobilized Biomass for Wastewater Treatment. Bioresource Technology, 75, 127 (2000).
Wirtz, R.A. and Dague, R.R., Laboratory Studies on Enhancement of Granulation in the Anaerobic Sequencing Batch Reactor, Water Science Technology, 36, 279 (1997).
Rodrigues, J.A.D., Ratusznei, S.M., Camargo, E.F.M. and Zaiat, M., Influence of Agitation Rate on the Performance of an Anaerobic Sequencing Batch Reactor Containing Granulated Biomass Treating Low-Strength Wastewater, Advances in Environmental Research, 7, 405 (2003).