ISSN 0104-6632 Printed in Brazil
Vol. 21, No. 03, pp. 487 - 495, July - September 2004
of Chemical
Engineering
PERFORMANCE OF MECHANICALLY
SHAKEN INDIRECT CONTACT
ATMOSPHERIC DRYER IN DRYING
PASTELIKE MATERIALS
K. P. Melo
1and M. A. Cremasco
1*1
School of Chemical Engineering, State University of Campinas PO Box 6066, 13083-970, Campinas - SP, Brazil.
E-mail: [email protected]
(Received: January 6, 2003 ; Accepted: February 20, 2004 )
Abstract - Pastelike materials are encountered in many technological processes in chemical, pharmaceutical, foodstuff and natural product industries. The most important factor in the drying of this type of materials is the nature of the moisture bonding that occurs. Because of the different characteristics of pastes, it is impossible to recommend a universal type of dryer for all of these materials. Some of the dryers available provide only indirect contact with the drying agent (heat) and also maintain constant moisture with a system of rotating paddles. We evaluated the performance of this type by studying the dryer kinetics curves for ground coffee under a variety of operational conditions of moisture load of material, temperature of the heating plate, intensity of the mechanical mixing of the moisture material, and initial moisture. The effects of these parameters (except for moisture) were studied using a 23factorial design. According the analyses of the kinetics drying curves, was observed that the increase in the temperature of the plate and rotation as well as the decrease in the load facilitates more effective removal of moisture. In statistical analysis was determined that the load of the material and the heating plate temperature influence the final moisture content of the material and plate temperature modifies the final temperature of the solid. Also, was suggested linear models from the factorial design to describe the process of drying coffee grounds satisfactorily.
Keywords: contact dryer, performance, coffee grounds.
INTRODUCTION
Drying is used in a variety of industrial operations, with the objective to remove moisture, as vapor, from the material (Okada., 1987). Removal of this moisture reduces the volume and the mass of the product, making its transport and packing economically more advantageous. In addition, increases this storage time (Cook and Dumont, 1991). Pastelike materials are among those submitted to drying processes; these can be found in a
metallic surface and, consequently, to the material being dried. This type of equipment will be studied in the present work, in which coffee grounds after the first extraction were used, as the test material in a atmospheric drying chamber. The performance of the equipment is evaluated by analyzing the drying kinetics curves as a function of several operational parameters, such as wet load of material, temperature of the heating plate, mechanical shaking, and moisture of the material.
Drying by Indirect Contact
Contact drying in shaking bed is often used to dry granular materials such as pharmaceutical products, mineral powders, agricultural products or foodstuffs, and pastes (Gevaudan and Andrieu, 1991).
According to Sztabert (1989), the drying mechanism of this type of equipment depends on the temperature of the hot surface, the temperature and properties of the raw material and mechanical operation of the dryer
MATERIALS AND METHODS
This work was conducted in the Laboratory of Processes in Porous Media (LPMP) of the School of Chemical Engineering (FEQ) at the State University of Campinas (UNICAMP).
Materials
For the purpose of this paper, coffee grounds after the first extraction on an express machine were used as the test material. The principal characteristics physics of the coffee are in Table 1.
The density was determined in gas picnometer Accupyc 1330 and porosity in porosimeter Autopore III 9400, both were producing for Micromeritics Instrument Corp. The particle diameter was used such as Maialle and Menegalli (1996).
Table 1: Physics characteristics of the coffee grounds.
ρs(kg/m 3
) εp dp(m)
1.3271 0.121 0.0007
Equipment
The apparatus used in this work is illustrated in Figure 1. This unit consists of a stainless steel cylindrical drying chamber exposed to the atmosphere with 0.24 m diameter, 1.5 cm thickness and 0.11 m2 drying area having an internal heater device, through which silicone oil is circulated at 350cP.
The equipment is isolated with rock wool and corrugated aluminum. The drying chamber is connected to the oil container (1) (Figure 1), which is coupled to two electrical resistance of 750W each (2). The oil is heated by these electrical resistances, which are controlled by the control panel (3), and a gear pump (4) circulates the heating fluid. Two valves (5a, 5b) control the pressure of the circulation device pump; one of these (5b) operates partway-open and is located after the gate valve by-pass. This by-pass (6) sends oil to the container or heater
device (7). The equipment has a replacement oil container (8) and an oil distribution container (9). The shaking system consists of a continuous flow motor (11), a connection shaft, and a scraper, which is controlled by a voltmeter. The drying system also contains type T thermocouples (12a, 12b), installed at the input and output of the oil container. Measurement of pressure is monitored by a manometer (13) coupled to the line.
Figure 1: The schematic diagram of the dryer.
Experimental Procedure
Initially the temperature of the heating surface was adjusted by a resistance monitored by a control panel. If took two hours to reach the stationary regime in the drying chamber. Then, when the variation in the temperature of the heating surface was about 0.5°C, the regime was considered permanent. The criterion for drying time take into account the time for total removal of the moisture with weight 0.5 kg, i.e., when the moisture is keep constant.
Once the stationary regime was achieved, the wet material, whose mass had been previously measured, was added to the drying chamber. At the same time the shaking system, whose revolution had also been previously fixed, was activated. Samples were collected in the drying chamber every 5 min in same place, because the less moisture until the material temperature was practically constant. At the end of the period an some of the material homogenous was collected in a small, previously weighed container and the small container with material was weighed and put in the oven at 104±5ºC. After 24 hours the sample was taken out and weighed again and the
moisture removed (d.b.) determined by the difference in mass as follows:
wet dry
dry
mass mass
X
mass
−
= (1)
Factorial Design
The strategy of the experiments was defined by means of a 23 factorial design generating a total of eight experiments. This design was used to verify to what extent the three independent variables, load of the material, temperature of the heating plate, and agitation speed, would be influence the response variables Xfinaland Tp,final.
The three independent variables used in this design were coded in the following way:
Var cod = +1 (highest level of the variable) Var cod = -1 (lowest level of the variable)
The originals variables chosen to experimental and their levels are show in Table 2.
To analyze the trust worthiness and application of the models, three approaches were used: standard errors, probability (ANOVA), and regression coefficients.
Table 2: The originals variables chosen to experimental and their levels.
Originals variables (notacion) Levels
Low (-) High (+)
Temperature heating plate (Tw) 75ºC 95ºC
Moisture load of material (W0) 0.5 kg 1.0 kg
Intensity of the shaking system (n) 20rpm 40 rpm
1) Silicone oil container
2) Electrical resistance to heating 3) Control panel
4) Gear pump
5) 5a and 5b- valve controls 6) Bypass
7) Heater device
8) Replacement oil container 9) Sub-container oil for distribution 10) 10 a and b- Agitation system 11) Continuum current motor
RESULTS
Nine assays were carries out in the laboratory. Drying kinetics was studied using five selected experiments. The experimental conditions adopted to this studied are presented in Table 3 for further analysis, where Tp,0 is the initial
temperature of the particle, Tw,the temperature of the
heating plate, Ws the material load, X0, the initial
moisture of the material, and n the rotation of the mixing device.
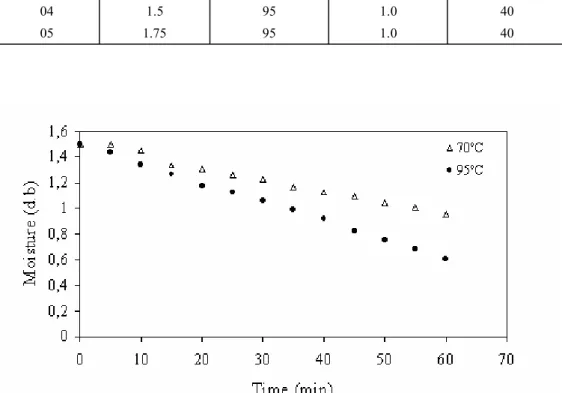
Figures (2) to (5) are the experimental kinetics drying curves in the form of moisture of the material on a dry weight basis expressed in kg of H2O/kg of
dry material for the time (fixed at 1h for all the experiments). It can be verified that for all curves only surface moisture is removed from the material. It can also be observed that initially the material is cohesive (until the fourth point of the curves).
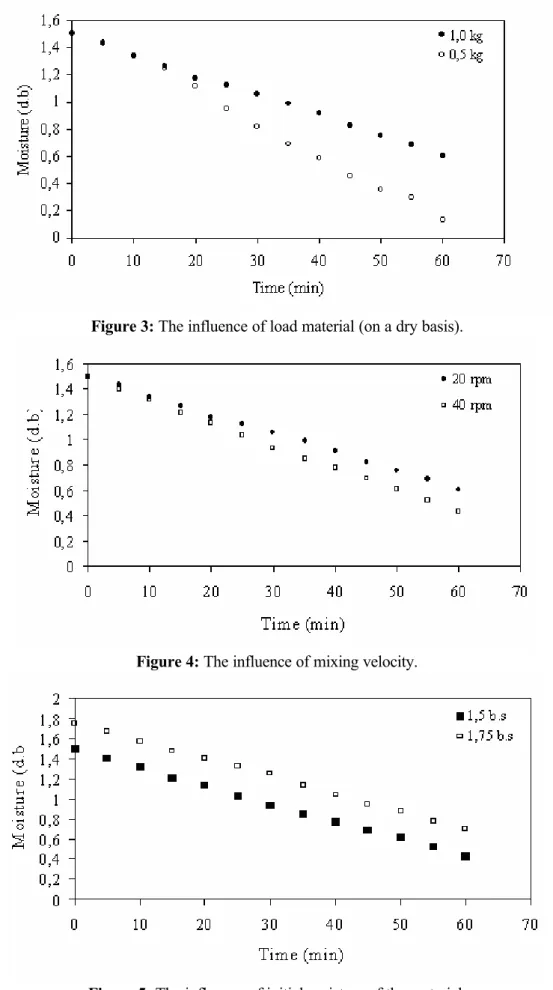
powder. It can be seen in Figure 2 that this modification is faster as the temperature difference between the drying agent and the material to be dried becomes higher (when the temperature of the plate is 95ºC). So, this should result in a larger removal moisture. Considering the effect of material load (Figure 3), it can be seen that the moisture reaches about 0.13 d.b with the lighter load, while for the heavier load it reaches around 0.6 d.b. The difference between these values is due to the smaller amount of processed material. When the mixing velocity is increased, a small tendency towards a quicker drying appears, which tends to show that shaking provides on time of contact of the material with the warm surface (Figure 4). However, it can be observed that moisture removal with time varies in the same proportion for different values of initial moisture (Figure 5).
Table 3: Experimental conditions.
Assays X0(d.b) Tw (ºC) Ws (kg) n (rpm)
01 1.5 70 1.0 20
02 1.5 95 1.0 20
03 1.5 95 0.5 20
04 1.5 95 1.0 40
05 1.75 95 1.0 40
Figure 3: The influence of load material (on a dry basis).
Figure 4: The influence of mixing velocity.
was adopted in this work. In agreement with this design, the original variables, Tw, Ws and n, coded at
their respective levels for each experiment, as well as the values obtained experimentally for response Xfinal (final moisture of the material) and Tp,final (final
temperature of the particle) in the drying process, can be founds in Table 4.
analysis was conducted with the aid of the software Statistica 5.0® with the purpose of evaluating which of the variables, independent or combined, influences Xfinal
and Tp,final in a period of 1 h of drying. As a result of the
analysis the values of the estimated effects of each variable and their iterations with the respective deviation pattern, as shown in the Tables 5 and 6, were obtained.
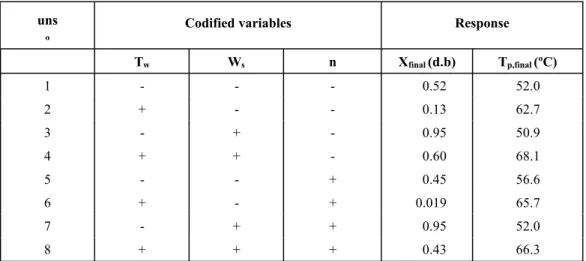
Table 4: Experiments Matrix and results of the factorial design of experiments.
uns
º
Codified variables Response
Tw Ws n Xfinal(d.b) Tp,final(ºC)
1 - - - 0.52 52.0
2 + - - 0.13 62.7
3 - + - 0.95 50.9
4 + + - 0.60 68.1
5 - - + 0.45 56.6
6 + - + 0.019 65.7
7 - + + 0.95 52.0
8 + + + 0.43 66.3
Table 5: Estimate of the effects for the response variable Xfinal.
Effects Estimated values +\-errors T (student) P. Level
Tw -0.42+\-0.033 0.097 0.050*
Ws 0.45+\-0.033 -12.67 0.046*
N -0.09+\-0.033 13.64 0.22
TwWs -0.013+\-0.033 -2.76 0.76
Twn -0.052+\-0.033 -0.39 0.36
Wsn 0.003+\-0.033 -1.57 0.94
Mean 0.51+\-0.017 30.48 0.02*
Table 6: Estimate of the effects for the response variable Tp,final.
Effects Estimated values +\-errors T (student) P. Level
Tw 12.82 +\-0.325 39.46 0.02*
Ws 0.075+\- 0.325 0.23 0.85
n 1.73+\-0.325 5.30 0.12
TwWs 2.923+\-0.325 9 0.07
Twn -1.13+\-0.325 -3.46 0.18
Wsn -2.08+\-0.325 -6.38 0.098
Analyzing the p. levels values in Tables 5 and 6, it can be verified that for the response variable Xfinal,
the independent variables (Tw and Ws) are
statistically significant, i.e., their values are into of the significant level (p<0.055), while, for variable Tp,final, only the temperature of the plate is
significant. These results, however, have to be confirmed for a confidence level of 94.5%. That is why, the statistical parameter Pr (probability) from the variance analysis is used, as shown
in Tables 7 and 8.
Based on the statistical parameter Pr (probability), the influence of variables Tw and Wson
Xfinal and Tw on Tp,final to be confirmed and the no
significant effects are considered to be aleatory experimental errors.
According to the results in Tables 7 and 8, a linear statistical model for the responses, Xfinaland Tp,final, is
proposed. The coefficients of these models can be found in Tables 9 and 10.
Table 7: Analysis of variance (ANOVA) for the variable Xfinal .
Effects Sum of
square
Degrees of freedom
Mean square F Test Probability
Tw 0.357300 1 0.357300 161.0902 0.050055
Ws 0.414183 1 0.414183 186.362 0.046504
n 0.017012 1 0.017012 7.6698 0.220598
TwWs 0.000335 1 0.000335 0.1513 0.763866
Twn 0.005492 1 0.005492 2.4764 0.360401
Wsn 0.000021 1 0.000021 0.0096 0.937816
Errors 0.002218 1 0.002218 -
-Total (Correlation) 0.796562 7 - -
-R2= 0.99722
Table 8: Analysis of variance (ANOVA) for the variable Tp,final.
Effects Sum of
square
Degrees of freedom
Mean square F Test Probability
Tw 328.9612 1 328.9612 1557.213 0.016129
Ws 0.0112 1 0.0112 0.053 0.855615
n 5.9513 1 5.9513 28.172 0.118553
TwWs 17.1112 1 17.1112 81.000 0.070447
Twn 2.5313 1 2.5313 11.982 0.179038
Wsn 8.6112 1 8.6112 40.763 0.098908
Errors 0.2113 1 0.2113 -
-Total (Correlation) 363,3888 7 - -
-R2= 0.9942
Table 9: Regression coefficients for Xfinal.
Parameter Coefficients
Constant 0.50835
Tw -0.21135
Ws 0.227525
n -0.0461
TwWs -0.00648
Twn -0.0262
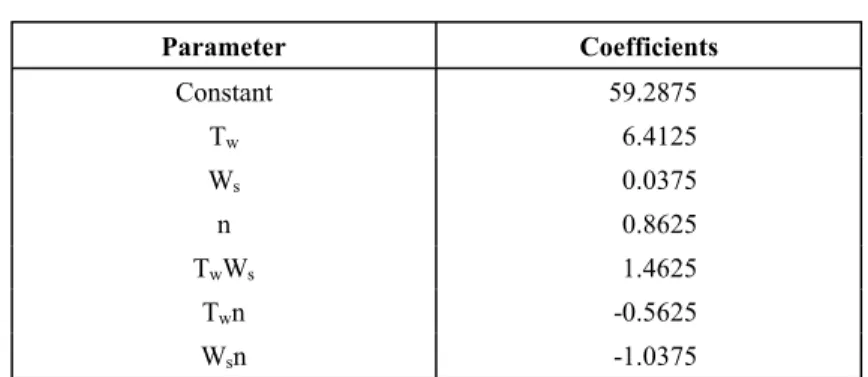
Table 10: Regression coefficients for Tp,final.
Parameter Coefficients
Constant 59.2875
Tw 6.4125
Ws 0.0375
n 0.8625
TwWs 1.4625
Twn -0.5625
Wsn -1.0375
These models are described by equations (2) and (3) as a function of the variables that had a significant influence on the responses Xfinal and Tp,final,
in accordance with the regression coefficients presented in Tables 8 and 9. The correlation coefficients of 0.9972 for Xfinal and 0.9942 for Tp,final
suggest that these linear models represent the experimental data satisfactorily.
Xfinal= 0.508-0.21Tw+0.23Ws (2)
Tp,final= 59.29+6.41Tw (3)
CONCLUSIONS
Conclusions drawn on the influence of the operational parameters (load of the material, temperature of the heating plate, and rotation) on the drying process, based on the statistical analysis and on the results of the experimental drying kinetics curves, are as follows:
1) In accordance with the analyses of the kinetics drying curves, it can be observed that the increase in the temperature of the plate and rotation as well as the decrease in the load facilitates more effective removal of moisture.
2) By means of the statistical analysis one can determine that the load of the material and the heating plate temperature influence the final moisture content of the material and plate temperature modifies the final temperature of the solid.
3) It can be verified that the linear models from the factorial design describe the process of drying coffee grounds satisfactorily.
NOMECLATURE
dp particle diameter, m;
n rotation of the mixing device, rpm;
t drying time, min;
Tp,0 initial temperature of the particle, ºC;
Tp,final final temperature of the particle, ºC;
Tw temperature of the heating plate, ºC;
X removed moisture content of the material, kg/kg;
X0 initial moisture content of the material on a
dry weight basis, kg/kg;
Xfinal final moisture content of the material on a
dry weight basis, kg/kg; Ws material load, kg;
ρs density, kg/m3
εp porosity.
REFERENCES
Cook, E.M. and Dumont, H.D. Process Drying Practice. New York: Editora McGraw-Hill, 1991. Gevaudan, A. and Andrieu, J. Contact Drying
Modelling of Agitated Porous Alumina Beads, Chem. Eng. Process, vol. 30,pp.31-37, 1991. Maialle, K.G.; Menegalli, F.C. Secagem de Borra de
Café em Leito de Jorro Fluidizado Bidimensional: estudo preliminar. Anais do XXIV Congresso Brasileiro de Sistemas Particulados. UFSCar, São Carlos, p. 301-306, 1996.
Strumillo, C. Markowski, A. and Kaminski, W, Modern Developments in Drying of Pastelike Materials, Advances in Drying, vol. 2, pp. 193-231, 1983.